Urban traffic fines: disciplining dangerous or vulnerable road users?
Abstract
While research on traffic policing is dominated by technical studies in the field of traffic safety, critical accounts show that traffic laws are socially constructed and selectively enforced. Based on an analysis of traffic fines in Barcelona for the years 2022–24, our article assesses and reflects on the equity of traffic enforcement strategies across transport modes. In the context of policing campaigns targeting cyclists and e-scooters, we examine whether these two transport modes are overrepresented in traffic fines relative to their trip volumes and involvement in traffic crashes. Our findings show that cyclists and especially e-scooters are overrepresented compared to motorists if we only look at manually issued fines, accounting for 32% of fines despite representing only 13% of trips and 13% of vehicles involved in traffic crashes; however, if we include automated fines cars become the most fined vehicles relative to trip volumes and crash involvement. In addition, the average amount for fines issued to cyclists and e-scooters is much higher than for car drivers and motorcyclists. These monetary disparities, we suggest, raise important questions regarding fairness in the treatment of traffic violations between transport modes, hinting at a motonormative bias in existing traffic legislation.
1. Introduction
Existing research on traffic enforcement is dominated by technical studies in the field of traffic safety, which have shown that effective legislation and policing can play a crucial role in increasing road safety and reducing traffic fatalities (Tay, 2005; Conner, 2017; Castillo-Manzano et al., 2019; Staton et al., 2016). Among other aspects, this research has assessed the impacts and effectiveness of different enforcement strategies in minimising traffic violations and crashes (e.g. Factor, 2018; Castillo-Manzano et al., 2019; Pantangi et al., 2019), and the personal and sociodemographic predictors associated with traffic violations (Peplińska et al., 2015).
While such research provides key empirical evidence to inform traffic legislation and policing, it tends to reproduce an uncritical road safety discourse which sees reducing traffic violations as its main goal (e.g. Tang et al., 2020; Huemer, 2018). This problem framing is exemplified in quotes like the following:
There is an urgent need for more police involvement to deter illegal cyclist behaviour and punish offenders. When on-the-spot fines for cyclists are introduced later this year, police should regularly conduct random spot checks at busy junctions along popular cycling routes. (Richardson and Caulfield, 2015, 72)
As critical accounts from historical and social sciences perspectives have argued, however, the performative nature of conventional road safety discourse is problematic in many respects. Although they are often presented as natural, dominant road engineering and traffic legislation practices are the product of historical choices which have led to the priorisation of the interests of automobility over pedestrians and cyclists (Norton, 2011; Marshall, 2024; van der Meulen, 2023), a situation which is only beginning to be reversed in most cities. As argued by te Brömmelstroet (2024), dominant road safety discourses normalize systemic traffic danger, recast all interactions between mobile bodies as “conflicts”, and often presenting cycling and walking as inherently dangerous activities:
…within these statistics cycling and walking is often represented as a dangerous activity and people are seen as ‘vulnerable road users (VRU)’. In itself both of these phenomena already confuse the danger itself with the vulnerability to danger: a human in public space is not inherently vulnerable without others bringing in danger. Why do we not talk about ‘dangerous road users (DRU)’ instead? (p. 7)
From this perspective, such discourses need be understood within the wider context of motonormativity (Walker et al., 2023), i.e. a collective societal bias which treats cars as the default mode of transport and systematically overlooks their negative externalities. As suggested by Loader (2026), existing road safety legislation is largely premised on ideas “motonormative punishment” which seek to individualize responsibility, while ignoring the structural violence generated by the regime of automobility.
In this context, traffic enforcement and fining practices can play a key role in sustaining (or dismantling) automobility, discouraging or enabling the use of alternative transport modes. As argued by Conner (2017), achieving traffic justice requires moving beyond the frequently cited three “E’s” of engineering, education, and enforcement, to also include equity and evaluation. Despite the potential relevance of traffic fining practices to issues of transport equity and mobility justice (Verlinghieri and Schwanen, 2020; Pereira, Schwanen, and Banister, 2017), there remains a lack of empirical analyses examining how urban traffic fines are distributed across transport modes, and whether such distributions align with exposure and traffic safety indicators.
Our study addresses this gap through an exploratory analysis of traffic fines registered in Barcelona (Spain) for the years 2022–24, recently published in the city’s Open Data portal. While the open publication of traffic fine datasets is still relatively uncommon, we argue that traffic fines offer a valuable lens through which to examine issues of equity between transport modes, especially when combined with other data sources such as traffic counts, trip volumes or traffic crashes. In this sense, the present article is also intended as a first step and an invitation to other authors to build upon this line of research by using datasets from other cities, or carrying out comparative studies between contexts.
Our analysis revolves around the following questions:
-
What is the relative distribution of fines between transport modes, and does it change over time?
-
To what extent are different transport modes disproportionately represented in traffic fines compared to their share of a) trip volumes; b) involvement in traffic crashes?
-
How do the spatial distribution of traffic fines and traffic crashes compare?
-
What are the most common types of traffic fine per transport mode?
As in many other cities (e.g. Tuncer et al., 2020; Lipovsky, 2021), in Barcelona there exists a widespread perception that e-scooters – and to a lesser degree cyclists – tend to ignore traffic rules, often endangering pedestrians and making them feel unsafe. Regardless of the legitimacy of such claims, in recent years this has led to ongoing public discussion on this topic, which has been amplified by local media. With the municipal election of Mayor Collboni in May 2023, this has translated into the introduction of “educational” traffic policing campaigns specifically targeting cyclists and e-scooters, as well as new cycling (and e-scooter) restrictions in certain pedestrian areas (El Periódico, 2024). In February 2025, this tougher stance towards cyclists and e-scooters culminated in the adoption of a new municipal traffic regulation which imposed compulsory helmets for e-scooter use, and increased penalties for cycling on the sidewalk from €200 to €500. As argued by the local cycling association (BACC) (betevé 2025), this new regulation penalises cyclists by imposing them higher fines than for motorbikes riding on the sidewalk (€200), and is often ambiguous or impossible to adhere in practice (many bike lanes in Barcelona force cyclists to use the sidewalks at key connections and junctions).
In the following section, we briefly elaborate on the theoretical framing and rationale of our article by placing it in the context of previous critical research on traffic policing and enforcement. The remainder of the paper is structured into three sections: Methodology, Findings, and Discussion.
2. Disciplining mobile subjects: critical perspectives on traffic policing and enforcement
Existing critical research on traffic policing and enforcement comes from a variety of disciplines and intellectual traditions, ranging from law to psychology, history or mobility studies. What unites these perspectives is their understanding of traffic enforcement not as a static practice, but rather as the evolving outcome of the interplay between legislation, policing and compliance (Gardiner, 2013; Conner, 2017). As these accounts highlight, traffic laws are socially constructed and selectively enforced, in ways which may either minimise or enhance power imbalances between different transport modes or social groups. In an ideal world, traffic enforcement should arguably respond exclusively to the objective traffic danger posed by specific behaviours:
Above all, traffic enforcement must be data-driven, targeting the most dangerous actions that contribute to the most crashes. This means targeting offenses like speeding, drunk driving, failing to yield, and texting by drivers, and focusing far less on bicycling on the sidewalk, tinted windows, and other offenses relatively insignificant to traffic safety. (Conner, 2017, p. 994)
In reality, however, traffic fining practices are driven by a wide variety of considerations (e.g. punitive, educational, tax-seeking, convenience) which may shape enforcement priorities in ways that do not align with risk-based criteria (Alonso et al., 2017; Makowsky and Stratmann, 2009). The fact that the police combine the tasks of crime control and traffic enforcement may also result in conflicting incentives and objectives, leading some authors to argue that it would be better to have a non-police agency dedicated exclusively to traffic enforcement (Love et al., 2025). Within a US context, for instance, evidence of racial bias regarding police traffic stops has been reported by multiple studies (Conner, 2017; Rojek, Rosenfeld, and Decker, 2012).
Since it is impossible to systematically police all road users, traffic policing essentially acts as a form of deterrence: “The police prevent road users from committing violations by causing a fear of being detected and fined or receiving some other form of punishment” (Castillo-Manzano et al., 2019, 2). In its strongest form, this reasoning is reminiscent of a Foucauldian understanding of state power and governmentality, most famously presented in Discipline and Punish (Foucault, 1991). This connection has been explicitly made by Packer (2012), who argues that traffic policing aspires to a form of panopticism in which road users end up self-disciplining and internalising traffic rules. As he notes, traffic enforcement assumes that repressive measures are needed to discipline the inherent desire towards risk taking of mobile subjects.
Regardless of whether we subscribe to this Foucauldian perspective, the view of traffic policing as a form of disciplining road users provides a useful of way of thinking about traffic enforcement. This notion of “disciplining”, we suggest, is particularly relevant to pedestrians and cyclists (to which we might add e-scooters), whose characteristics and needs are often disregarded in existing traffic legislation. As historical accounts have shown, the evolution and consolidation of traffic rules and regulations during the 20th century have generally gone hand in hand with the criminalisation of pedestrians and cyclists, seeking to discipline unruly behaviours which do not conform to the mechanistic logic of motorised traffic (Norton, 2011; Emanuel, 2021; Männistö-Funk, 2023). As argued by Tuvikene (2023), traffic discourse forces pedestrians into car-based logic which is fundamentally at odds with the holistic way in which pedestrians move through their surrounding environment: “Such a rule-following perspective casts the rules of traffic as the technical area wherein pedestrians are technical devices acting within given norms and following, best if the word for word, what has been written in the regulations.” (p. 190).
Likewise, contemporary road safety discourses often problematise cyclists as “hazards” (rather than viewing car drivers themselves as hazards) (Bonham, Johnson, and Haworth, 2020). Traffic rules are often not adapted to cyclists’ needs, to the point that many cyclists often consider breaking the law to be the safest option (Chaloux and El-Geneidy, 2019). As noted by Varet et al. (2021), the perceived legitimacy of traffic rules is a key determinant of compliance: if a rule is patently perceived to be unjust or unfair, its enforcement is likely to fail, as exemplified by the widespreadness of jaywalking in cities like New York (Conner, 2017). Rather than strengthening police enforcement, high levels of traffic violations among cyclists may point to the need to revise traffic rules: “With most cyclists choosing not to follow traffic laws to some extent, it is clear that frequent revision of the rules must be a key plank of cycling policy (Chaloux and El-Geneidy, 2019)”. The well-known “Idaho stop”, which allows cyclists to treat a red light like a stop sign, for example, is better adapted to the physics of cycling and may actually improve traffic safety (Tekle, 2017). However, existing legislation on this point remains highly inconsistent between countries: turning right upon a red light is illegal for cyclists in Ireland, for instance, but legal in France, the Netherlands or Germany (Richardson and Caulfield, 2015).
Building upon such critical perspectives on traffic enforcement, our study seeks to reflect on the fairness of traffic fining practices by examining a large dataset of urban traffic fines and assessing their distribution across transport modes. A short study by Linovski and Snider (2021) – who found that cycling tickets in Winnipeg (Canada) were issued primarily in inner-city areas with higher levels of low-income and immigrant residents – provides a relevant precedent of research along this line, but as far as we are aware there exists little empirical research assessing urban traffic fines from an equity perspective.
More broadly, our analysis draws attention to the relevance of traffic enforcement practices for debates on transport equity and mobility justice. While critical mobilities scholarship has highlighted the role of policing in reproducing mobility injustices (Sheller, 2018), it has primarily focused on larger-scale issues of police violence directed at specific ethnic or social groups (e.g. border controls and immigration, police stops), rather than on inequities between transport modes in the specific domain of traffic enforcement. Mobility scholars have also noted the central role of infrastructure in sustaining the dominance of automobility and its uneven power relationship with other transport modes (Urry, 2004; Koglin and Rye, 2014; Cox and Koglin, 2020), but have paid less attention to the role of traffic legislation and enforcement in reproducing this relationship.
Following Conner (2017), we argue that a fair traffic enforcement regime should not seek to equally enforce all violations, but prioritise those which pose the greatest traffic safety risk to others and to oneself. In this context, the difficulty lies in how to assess enforcement proportionality in the absence of systematic data on violations and the risk they pose. In the present paper, we suggest that comparing traffic fines with trip volumes and traffic crash data by transport mode provides a starting point for doing so. Comparing trip volumes with traffic fines provides a first approximation of whether specific transport modes are being over- or under-policed relative to exposure. In turn, comparing fines with the share of traffic crashes involving each mode (and the share of injuries attributable to it) allows us to assess whether the over- or under-policing of certain transport modes appears justified from a traffic safety standpoint. While neither of these indicators implies culpability or blame, together they highlight the uneven distribution of harm and risk between transport modes, supporting a more systemic discussion of traffic safety which moves beyond individual blame framings (Loader, 2026, te Brömmelstroet, 2024).
3. Methodology
Our analysis relies on a data set of municipal traffic fines in Barcelona for the years 2022–24, published in the city’s open data repository1. This period encompasses the earliest and latest years with available data at the time of writing, and provides a relevant timeframe to explore potential shifts in traffic enforcement following the change of municipal government in May 2023. The data set is provided by the Barcelona Municipal Tax Office, and includes all registered traffic fines in the municipality from local police (Guàrdia Urbana), Catalan police (Mossos d'Esquadra), and automated traffic enforcement. This data set includes information on the date, time and geocoded location of the fine, as well as details on the type of vehicle, traffic violation category, corresponding fixed statutory fine amount, and issuing method (e.g. police patrol, speed camera). However, no information is available on the personal characteristics of traffic offenders, or on whether fines have been appealed or remain unpaid. The size of this data set is substantial, with a total of 2.8 million individual records for the three study years before any filtering.
In the present paper, we limit ourselves to considering fines for four main transport modes which account for a large majority of enforcement activity: cars, motorcycles (inc. mopeds), bicycles and e-scooters, which together represent 79% of all fines. While relevant to the topic of the present paper, we have excluded pedestrians from the analysis, since they only account for 1,033 fines over three years, representing an insignificant proportion of total fines. After careful consideration, we also decided to exclude all parking-related fines (which represented 45% of all fines) and only include traffic offences related to movement. While interesting in themselves, parking fines are overwhelmingly dominated by motor vehicles, which account for over 99% of all parking fines (88% cars; 11% motorcycles). Since our paper focuses on the relationship between traffic fines and other movement-based indicators – i.e. trip volumes and involvement in traffic crashes – we consider that parking fines should be studied as a separate phenomenon, which is less directly related to traffic safety.
For the analysis, we used a combination of R and ArcGIS to process, summarise and visualize all data. To compare fine volumes with trip and traffic crash data, we compared 2023 traffic fine data with the following two data sets for the same year: (1) the police record of all vehicles and casualties involved in registered traffic crashes in Barcelona – also available on the city’s Open Data portal – and (2) the annual mobility survey of the Barcelona Metropolitan region (EMEF)2. For this comparison, we focus solely on 2023 since it is the latest year with publicly available EMEF survey data.
Unfortunately, available traffic crash data for Barcelona does not specify which specific vehicle is responsible for each traffic crash. Accordingly, we compare traffic fines for each transport mode with two different traffic crash indicators: (1) Involvement in traffic crashes per mode (regardless of who – if anyone – is injured); and (2) Share of attributed traffic injuries per mode. Neither of these two traffic crash indicators implies culpability or blame: in the absence of systematic violation base rate data by mode, however, they offer a starting point against which assess to proportionality in enforcement. To calculate this second indicator, we attribute each registered traffic injury to the counterpart mode involved in each traffic crash, or to the mode of the injured person in single vehicle crashes3. To provide a couple of examples, in the case of a car-bicycle collision where only the cyclist is hurt, the injury is attributed to the car; in the case of a car-motorcycle collision where both are hurt, each injury is attributed to the other party. The percentage share of attributed traffic injuries is calculated over the four modes included in our study (car/motorbike/bicycle/e-scooter), but is based on traffic injuries sustained by all modes (including pedestrians).
To compare traffic fine levels with trip volumes per transport mode, we relied on data from the 2023 EMEF survey. Reported trip volumes for each transport mode include all trips starting or ending in Barcelona in the survey, which uses population weights to scale up survey data to estimated real-world trip values. Since this survey only targets registered residents aged 16 and over, it somewhat underestimates overall mobility levels (particularly for tourists and non-residents), and only provides mobility data for an average weekday. To estimate traffic fines per 1,000 trips for each mode, we first converted daily weekday trip volumes to annual trip volumes (assuming 260 weekdays/year), enabling us to compare them with all traffic fines for the year 2023. Since fines cover the full year while trips cover weekdays only, these results should be treated with some caution, but what matters is not so much the absolute numbers as the magnitude of differences between transport modes.
4. Findings
4.1 Temporal evolution
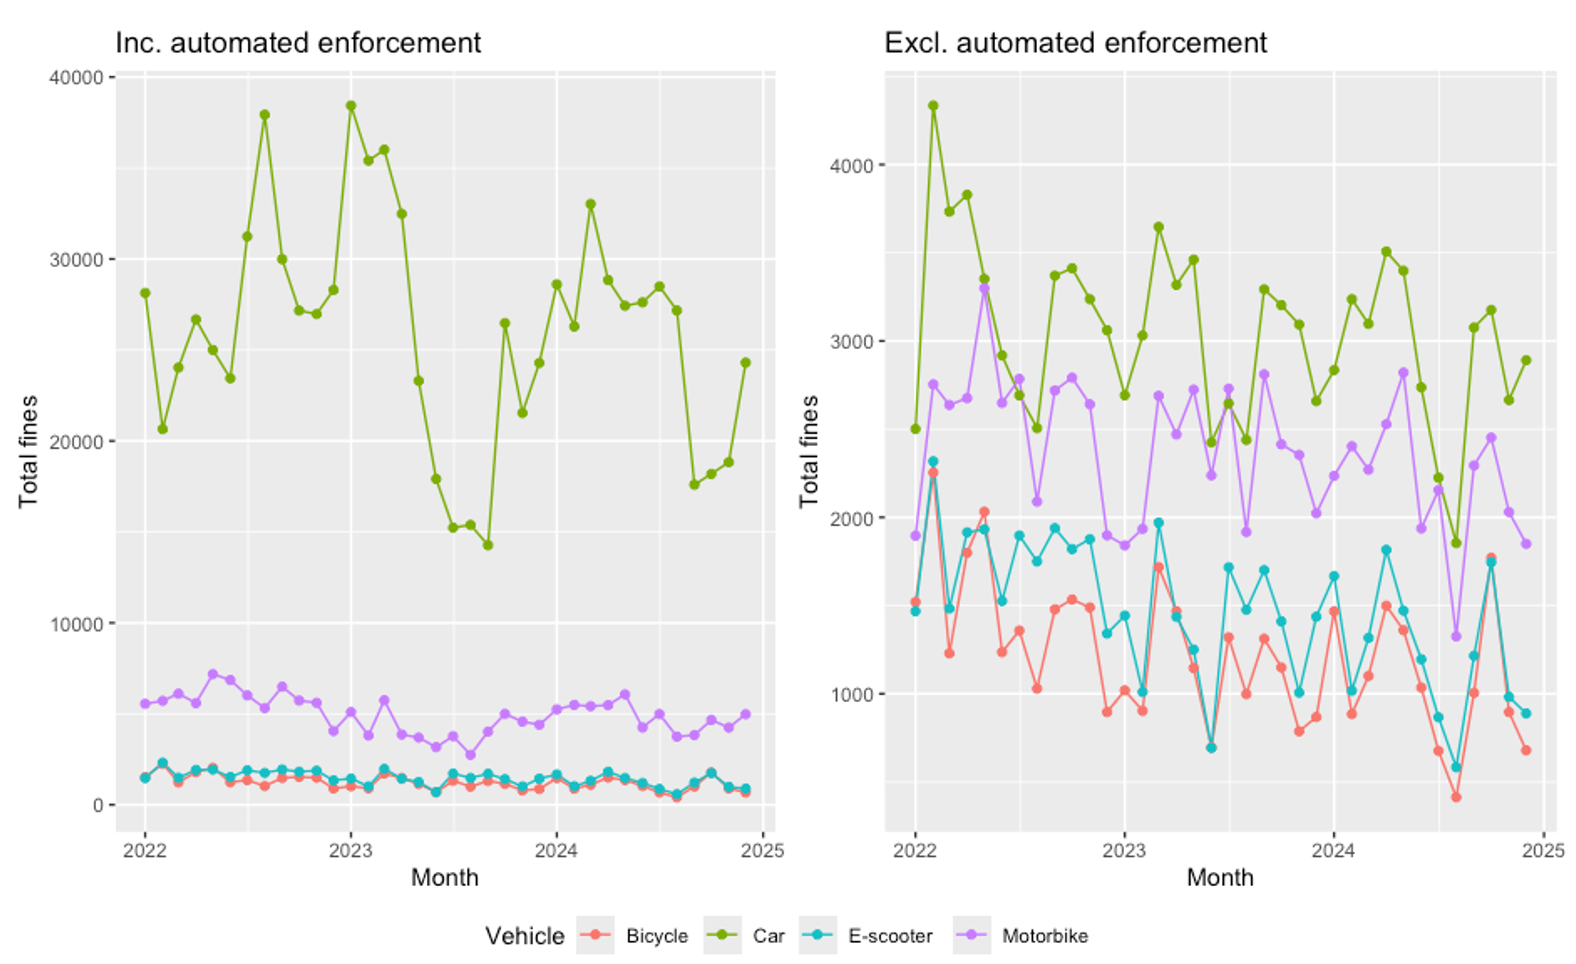
In Figure 1, we provide a timeline of the evolution of total monthly traffic fines by transport mode over the three study years. Figure 1a (left) includes all types of fines including those issued through automated traffic enforcement (i.e. speed cameras), while Figure 1b only includes fines issued manually by police agents. As a visual comparison between both figures shows, automated traffic enforcement accounts for a large majority of traffic fines, almost all of which correspond to cars (and to a lesser extent motorcycles). Since bicycles and e-scooters are not subject to automated traffic enforcement, to allow for a better comparison of policing levels between transport modes in the remainder of the findings we sometimes distinguish between results for: (1) all fines (including automated enforcement); and (2) manually issued fines only. Distinguishing between these two outcomes is useful for understanding the relative role of automated enforcement of traffic rules, and exploring possible police bias in manually issued fines.
While the data present significant fluctuations which seem partially attributable to seasonality (e.g. reduction in fines during summer months), their appears to be no clear trendline or sudden change of tendency regarding total fines for any mode of transport. If anything, overall fines have tended to decrease slightly from 2022 to 2024 for all transport modes. If there have been any changes in traffic enforcement policy (e.g. targeted campaigns at e-scooters), these have not had a significant enough impact to be confidently discernible in the aggregate data.
4.2 Relationship with trip volumes and traffic crashes
In Table 1, we compare the share of traffic fines with relative trip volumes for each transport mode, both for all fines (inc. automated enforcement) and manual fines only. All percentages refer to totals across these four transport modes only, excluding other modes such as public transport and walking; for this reason, trip volumes should not be equated with modal share. If we include all fines, we can see that cars are overrepresented compared to their relative trip volumes, while bicycles and motorbikes are underrepresented. However, the picture changes considerably if we only look at manually issued fines: cars become underrepresented relative to their share of trips, while. all other transport modes are overrepresented. The case of e-scooters particularly stands out: while they are only responsible for 3.2% of trips, they account for 17.6% of traffic fines.
| Mode | Trip volumes (daily) | All fines(annual) | Difference | Manual fines (annual) | Difference |
|---|---|---|---|---|---|
| Car | 60.3% (1,050,902) | 79.0% (300,729) | +18.8% | 38.2% (35,907) | −22.1% |
| Motorbike | 26.9% (469,787) | 13.1% (49,879) | −13.8% | 29.9% (28,146) | +3.0% |
| E-scooter | 3.2% (55,210) | 4.3% (16,549) | +1.2% | 17.6% (16,549) | +14.4% |
| Bicycle | 9.6% (167,583) | 3.5% (13,384) | −6.1% | 14.2% (13,384) | +4.6% |
This overrepresentation of cyclists and e-scooters in manual traffic fines compared to trip volumes could potentially indicate that traffic enforcement is disproportionately targeting these modes compared to car drivers and motorcyclists, but may equally reflect a greater propensity towards traffic violations among users of these modes: without base rate data on traffic violations for each transport mode, it is impossible to distinguish between these two factors. In addition, it is important to consider that trip volumes only provide a crude measure of exposure to traffic, which does not take into account differences in average trip duration between modes. While average distances vary as a result of speed differentials between modes, travel survey data for 2023 show that average travel time for trips within Barcelona (excluding trips to and from other municipalities) is broadly comparable across the four modes considered (car: 20 min; motorbike: 16 min; bicycle: 17 min; e-scooter: 16 min;).
In Table 2, we compare each mode's share of traffic fines with its relative involvement in traffic crashes and share of attributed traffic injuries. The results of this comparison follow a similar pattern to the one reported in Table 1: if we include all traffic fines, cars are overrepresented relative to their involvement in traffic crashes, with motorbikes being most clearly underrepresented. If we consider manual fines only, however, it is instead bicycles and especially e-scooters which become overrepresented. If we look at attributed traffic injuries rather than involvement in traffic crashes, the picture does not change substantially for cyclists and e-scooters, but it increases the share of injuries attributed to cars and decreases the share attributed to motorbikes. This is clearly because cars are much more likely to injure other road users, while offering comparatively good protection to their occupants; by contrast, the greatest risk posed by motorbike crashes is to the rider.
| Mode | All fines | Manual fines | Involvement in traffic crashes | Attributed traffic injuries |
|---|---|---|---|---|
| Car | 79.0% (300,729) | 38.2% (35,907) | 46.3% (5,364) | 67.5% (4,022) |
| Motorbike | 13.1% (49,879) | 29.9% (28,146) | 40.8% (4,723) | 20.6% (1,229) |
| E-scooter | 4.3% (16,549) | 17.6% (16,549) | 6.7% (772) | 6.0% (360) |
| Bicycle | 3.5% (13,384) | 14.2% (13,384) | 6.3% (724) | 5.9% (350) |
As a complement to Tables 1 and 2, it is useful to calculate the ratio of traffic fines per trip/ traffic crash for each transport mode, which allows for a more direct comparison of traffic enforcement levels between transport modes. Table 3 compares traffic fines per 1,000 trips across transport modes, while Table 4 compares traffic fines per vehicle involved in traffic crashes. Perhaps even more clearly than when comparing percentages, these indicators underline the high rates of traffic fines of e-scooters relative to trip volumes (Table 3), as well as the relatively high rates of fines of cyclists and e-scooters compared to their involvement in traffic crashes. The importance of automated traffic enforcement for cars is also clearly reflected in the large differences in fine rates depending on whether we include all fines or only manually issued fines. This difference is much less pronounced for motorcycles, suggesting that speed cameras are not as effective at capturing motorcycle infractions.
| Vehicle | All fines | Manual fines only |
|---|---|---|
| E-scooter | 1.15 | 1.15 |
| Car | 1.10 | 0.13 |
| Motorbike | 0.41 | 0.23 |
| Bicycle | 0.31 | 0.31 |
| Vehicle | All fines | Manual fines only |
|---|---|---|
| Car | 56.1 | 6.7 |
| E-scooter | 21.4 | 21.4 |
| Bicycle | 18.5 | 18.5 |
| Motorbike | 10.6 | 6.0 |
4.3 Spatial analysis
To get some insight into the spatial distribution of traffic fines, we undertook an exploratory spatial analysis using the optimised spatial hotspot analysis tool in ArcGIS Pro (based on the Getis-Ord Gi* statistic). In Figure 2, we compare the distribution of traffic fines (including both automated and manual fines) and crashes, both for cyclists and e-scooters (above) and for cars and motorcycles (below). The results of the hotspot analysis comparison tool in ArcGIS – which displays the significance level combinations of both hotspots – are shown in the rightmost pane.
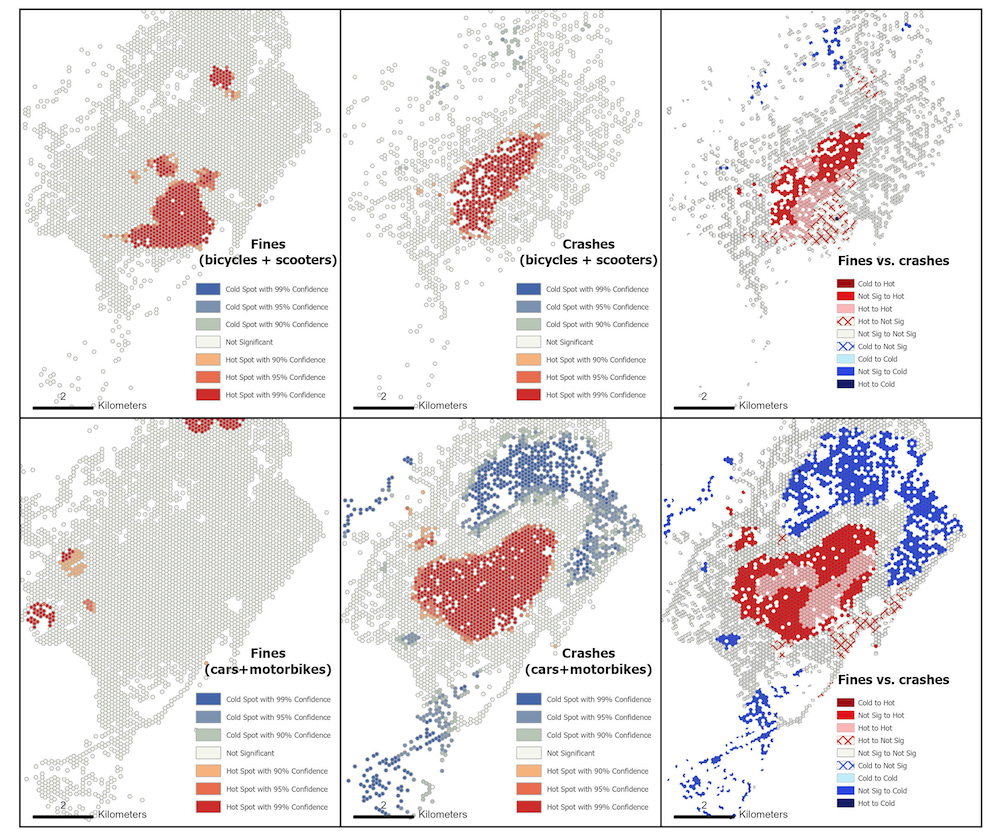
As these maps illustrate, there exist significant differences between fine and traffic crash hotspots. For cyclists and e-scooters, traffic fines are disproportionately concentrated in the historical city centre (Ciutat Vella), while the main hotspot for crashes involving cyclists and e-scooters covers the bulk of the Eixample district. For motorists, traffic fine hotspots clearly match the specific locations of automatic speed enforcement cameras along the city’s ring road, while crashes remain heavily concentrated in the Eixample district.
Admittedly, there are many valid reasons why traffic fines and traffic crash patterns may exhibit different spatial patterns. Indeed, one might argue that it is precisely the presence of traffic fines which may be avoiding the occurrence of traffic crashes; likewise, being involved in a traffic crash does not necessarily imply committing a traffic violation. High crash rates in the Eixample, for instance, do not necessarily reflect locally higher levels of traffic violations, but can be seen as the foreseeable outcome of high traffic intensities for both motorised traffic and cyclists/e-scooters, combined with high intersection and cycling infrastructure density. To assess whether the mismatch between traffic fines and crash locations reflects geographic imbalances in policing, we would need representative data on the spatial distribution of traffic violations.
Nevertheless, the spatial mismatch between traffic fines and crashes suggests that fining practices may be partly driven by other considerations than objective traffic safety. In the case of cyclists and e-scooters, for example, high fine levels in the historical city centre are at least in part likely to respond to greater police presence in the area, as well as to a desire to unruly behaviours which do not pose a substantial risk in terms of traffic safety, but generate conflict between cyclists/e-scooter users, pedestrians and tourists (den Hoed and Russo, 2025). This desire to reduce such conflicts is understandable, particularly if they result in feelings of subjective unsafety for pedestrians.
4.4 Fine amount and type
If we compare average fine amounts between transport modes, we find that there are significant differences between modes (Table 5). Fines for cyclists and e-scooters are significantly higher than for motorised vehicles, with average fines for cyclists being 58% higher than for car drivers.
| Vehicle | n | Mean amount (€) | Median amount (€) | Concentration ratio (CR1) |
|---|---|---|---|---|
| Bicycle | 44,025 | 224 | 200 | 0.77 |
| E-scooter | 52,578 | 193 | 200 | 0.45 |
| Motorbike | 178,498 | 174 | 100 | 0.67 |
| Car | 936,653 | 141 | 100 | 0.37 |
The reasons for this difference in average fine amounts between transport modes can be better understood by looking at the most common types of traffic violations for each transport mode. In Table 6, we list the five most frequent violations for each mode and their corresponding fixed statutory fine amount. As can be seen, the main violations for cars and motorcycles are relatively similar, with speed limit excesses being by far the most common category (more so for cars than motorcycles). Likewise, the most common violations for cyclists and e-scooters share are also quite similar (even though the distribution is a little different between both modes), focusing mainly on “indisciplines” such as disregarding red traffic lights, using the phone or headphones, or riding on the pavement. Except for riding on the pavement, all of these are considered “serious violations” according to Spanish traffic law, thereby automatically incurring a fine of €200. By contrast, fines for speed limit excesses of up to 20 km/h for cars and motorcycles correspond to a fine of 100€, which largely explains the lower average fine amount (Table 5) for cars and motorcycles. Interestingly, these speed limits are also considered “serious violations” in Spanish traffic law, but this law provides a special exception for speeding violations which exempts them from being subject to the usual minimum €200 fine for serious violations4.
| Type of violation | n | Amount (€) |
|---|---|---|
| Cars | ||
| Exceeding speed limit (posted on traffic sign) | 48.2% (451,736) | 100 |
| Exceeding speed limit (based on street category) | 19.0% (177,776) | 100 |
| Disregarding low emissions zone | 12.8% (119,710) | 200 |
| Disregarding red traffic light without danger | 7.3% (68,715) | 200 |
| Driving while using phone | 1.1% (10,148) | 200 |
| Motorbikes | ||
| Exceeding speed limit (posted on traffic sign) | 19.0% (33,877) | 100 |
| Exceeding speed limit (based on street category) | 16.7% (29,795) | 100 |
| Disregarding red traffic light without danger | 10.0% (17,873) | 200 |
| Unauthorised circulation on reserved traffic lanes | 6.6% (11,864) | 90 |
| Circulating on road dividing lines | 5.7% (10,227) | 90 |
| Bicycles | ||
| Disregarding red traffic light (bike/e-scooter) | 36.4% (16,040) | 200 |
| Riding bike/e-scooter with headphones | 25.8% (11,374) | 200 |
| Riding bike/e-scooter while using phone | 12.4% (5,461) | 200 |
| Cycling on sidewalk (less than 5 m width and 3 m free space) | 3.9% (1,725) | 100 |
| Riding bike/e-scooter with blood alcohol content above 0.25 mg/L | 2.9% (1,267) | 500 |
| E-scooters | ||
| Disregarding red traffic light (bike/e-scooter) | 22.4% (11,780) | 200 |
| Riding e-scooter on sidewalk | 22.3% (11,740) | 100 |
| Riding bike/e-scooter with headphones | 14.1% (7,390) | 200 |
| More than one person riding on e-scooter | 13.8% (7,248) | 100 |
| Riding bike/e-scooter while using phone | 4.3% (2,268) | 200 |
Should these differences in average fine amounts be understood as a sign of inequitable treatment between transport modes? As noted above, it is not that the same violation is being treated more harshly for cyclists/e-scooters than for cars, but rather that the most common offence types for these modes carry a higher fine. In the absence of systematic data on traffic violation rates, we have no way of ascertaining whether the police are prioritising the enforcement of certain types of violations over others. Likewise, given the lack of rigorous data on the effects of these different traffic violations on traffic safety, there is no objective way of determining whether such fine amounts are “fair”. To give a couple of examples: is driving at 50 km/h along a street with a 30 km/h limit a more or less dangerous violation than skipping a red light on a bike? Similarly, should running a red light on a bicycle incur the same fine amount as running a light in a car?
These are complex questions which have no easy answer and can perhaps only be answered on a case-by-case basis. In the absence of an objective risk-based criterion to determine whether existing fine amounts are "fair", however, we suggest that the fact that motorist speeding offences generally receive a lower fine than cyclist and e-scooter violations hints at systemic inequities favouring the motonormative status quo in existing traffic legislation. While not necessarily reflecting enforcement bias, fining practices are typically based on legal traffic codes which reproduce a motonormative framework which tends to be relatively lenient towards common motor vehicle offences such as speeding (Walker et al., 2023; Loader, 2026). By contrast, non-motorised modes are forced to conform to the expectations of motor vehicles, disregarding their different physical characteristics, way of moving through space, and the far lower traffic safety risk they pose to other road users (Davis, 1992; Norton, 2011; Prytherch, 2018).
If nothing else, the high fine amounts associated to cycling also risk being counterproductive in terms of cycling promotion. This is especially true if we consider the existence of significant wealth differentials between users of different transport modes. Despite the reported association between cycling and privilege in some urban contexts (Flanagan, Lachapelle, and El-Geneidy, 2016), in the context of Barcelona car owners and drivers tend to be clearly wealthier and older than non-car users (Cubells, Miralles-Guasch, and Marquet, 2024), while cycling and e-scooter usage is associated with younger – and in the case of e-scooters lower – sociodemographic profiles (Roig-Costa, Miralles-Guasch, and Marquet, 2024).
On this point, it is interesting to contrast our findings for Barcelona with a recent comparative report on cycling fines (Willmes, 2024) which found wide disparities in fine amounts between 20 European cities, for example ranging from €21 (Bern) to €200 (Madrid) for using the mobile phone while cycling, or from €23 (Warsaw) to €700 (Athens) for running a red light. Beyond showing a remarkable lack of correlation between relative local income levels and fine amounts, these disparities suggest that fine amounts are largely driven by subjectivity and local custom, rather than objective considerations. In fact, it is tempting see a certain inverse relationship between fine amounts and cycling modal share: the two cities in the abovementioned report with the highest average fines are Athens and Rome, which – to put it mildly – are not exactly famous for their urban cycling culture.
5. Summary and discussion
By comparing the relative volumes of traffic fines, trips, and involvement in traffic crashes by transport mode, our analysis of traffic fines in Barcelona for the years 2022–24 reveals the existence of significant disparities in fining rates across transport modes. Likewise, our analysis shows that there exist significant differences between the spatial distribution of traffic fines and traffic crashes, suggesting that traffic fines may not always be focusing on the most relevant locations in terms of traffic safety.
If we exclude automated traffic enforcement, we find that bicycles and especially e-scooters account for a disproportionately high proportion of traffic fines relative to their trip volumes and involvement in traffic crashes. If we also include automated traffic enforcement (i.e. speed cameras), however, cars become the most fined mode relative to trip volumes and traffic crashes. This suggests that automated enforcement provides a welcome corrective against potential policing bias towards cyclists and e-scooters, which may provide easier targets than motorists for manual fining. These findings support Conner’s (2017) argument that automated enforcement is generally desirable from an equity perspective. As reported by Castillo-Manzano et al. (2019), automated enforcement also appears to be particularly effective from a traffic safety perspective: speed controls via radar have also been found to be the single most effective measure in reducing road fatalities in Spain. This contrasts with recent resistance to expand speed radars in the local context of Barcelona: in 2021 the municipality planned to introduce 46 new speed radars, but after extensive lobbying from the local automobile association (RACC) this figure was finally reduced to 17 new radars (12 of which only issue fines during school hours), with a further 28 new “pedagogical” radars that do not issue fines (El Periódico, 2023). In our view, this provides a clear example of the enduring power of the automobility regime, which seeks to ensure lenient treatment for motorists while simultaneously advocating for stricter traffic enforcement of other traffic modes. As estimated in a recent review paper by Fondzenyuy et al. (2024), speeding may contribute to 54% of global traffic fatalities. However, speeding is rarely mentioned in local media and traffic enforcement discourses on traffic safety in Barcelona, while much greater attention is paid to traffic violations from cyclists and e-scooters.
Our analysis shows that while speeding is by far the most common violation for cars and motorcyclists, the most common fines for cyclists and e-scooters refer to indisciplines such as disregarding red lights, riding on the sidewalk, and using mobile phones or headphones. Critically, this type of violations is generally associated with higher fine amounts than traffic speeding (for speed excesses up to 20 km/h), resulting in significantly higher average fines for cyclists (€224) and e-scooters (€193) than for car drivers (€148). While this is not necessarily a sign of disproportionate enforcement, we suggest that the high fine amounts associated with common cycling and e-scooter offences may reflect a motonormative bias in existing traffic legislation, which seeks to hold cyclists and e-scooters to the standards of motorised traffic, despite their distinct characteristics and needs. This is especially true in the context of an "infrastructural settlement" (Latham and Wood, 2015) designed around motor vehicles, which in certain circumstances may even lead cyclists to engage in rule-breaking as a rational behaviour to increase their perceived safety (Marshall et al., 2017).
This ultimately raises an underlying question regarding cycling and e-scooter fines: should these modes be subject to conventional “traffic discourse” (Tuvikene, 2023), and thereby using the same standards as motor vehicles? While talking about pedestrians, the following statement by Tuvikene (2023) seems at least partially extensible to cycling: “human bodies are capable of moving in all sorts of ways that often diverge from what is legally accepted” (p. 188). As argued by Emanuel (2021), a key difference between motorists and pedestrians is that the slow speed of pedestrians means they can easily see that they are not hindering traffic or presenting a danger to other road users when they decide to cross a red light; following this logic, pedestrians should only be fined if they are being careless, and can cause danger or harm through their behaviour. Indeed, existing traffic enforcement practices in Barcelona appear to take this logic on board for pedestrians, which are extremely rarely fined despite frequently ignoring traffic regulations: despite accounting for over 40% of all trips in the city, they account for less than 0.001% of all fines for the years 2022–2024.
To what extent should this reasoning also apply to cycling and e-scooters? As noted by Liu, Krishnamurthy, and van Wesemael (2021), the difficulty in legislating for cycling is it falls somewhere between the “traffic zone” and the pedestrian “social zone”. This is perhaps even truer for e-scooters: examining e-scooter behaviour, Roig-Costa, Miralles-Guasch, and Marquet (2025) have found that the ability to quickly change legal status between pedestrian and vehicle constitutes a key adaptive strategy which helps e-scooter users minimise frictions optimise their travel route and experience. However, existing legislation and policing in Barcelona – as in many other cities – seeks to place cycling and e-scooters squarely in the “traffic zone”. This undoubtedly has some benefits, such as minimising conflicts with pedestrians, and potentially promoting the development of specific infrastructure for cycling and e-scooters. However, confining cyclists and e-scooters to the “traffic zone” also comes at a significant cost. Where existing traffic regulations and infrastructure do not match the characteristics and needs of cyclists and e-scooters, stringent traffic enforcement is likely to limit the attractiveness of these modes and dissuade potential users.
To sum up, our analysis raises significant questions regarding the (in)equity of traffic fining practices across transport modes. Nevertheless, ascertaining whether the existing distribution of fines between transport modes is “fair” arguably remains an impossible task in the absence of systematic evidence of violation rates by transport mode, and of the safety risk posed by such violations. This constitutes a key limitation of our study: obtaining representative data on traffic violation rates by transport mode and comparing it with traffic fining practices is an important direction for future research, although such data is likely to be difficult to come by in most urban contexts.
Likewise, it would be valuable for future studies to explore potential social inequities in traffic fining practices based on sociodemographic information, which was not available in our dataset. Finally, we suggest that the increasing availability of urban traffic fine datasets opens up opportunities for future research to conduct comparative analyses of traffic fining practices between urban contexts. In particular, comparing traffic fine distributions across cities with different mobility cultures (e.g. car-dominated vs. bicycle-dominated) could provide a valuable means of exploring the interrelation between mobility practices and traffic enforcement.
CRediT contribution
Samuel Nello-Deakin: Conceptualization, Formal analysis, Methodology, Supervision, Visualization, Writing – original draft, Writing – review & editing. Guillem Viñas Salvador: Formal analysis, Visualization, Writing – review & editing.
Declaration of competing interests
The authors have no competing interests to report.
Declaration of generative AI use
Claude AI (Opus 5) was used as a coding assistant for initial data processing tasks in R, and to review selected passages for language clarity. The final responsibility for the text rests fully with the authors.
Prior dissemination declaration
The main author presented some preliminary findings on the topic of this paper at various conferences, including Cycling Research Board 2025, NECTAR 2026 and RGS 2026.
Ethics statement
Given the focus of the manuscript (anonymized open data) and in line with university guidelines, this work did not require any formal ethical assessment.
Funding statement
This work contributes to the ICTA-UAB ‘María de Maeztu’ Programme for Units of Excellence of the Spanish Ministry of Science, Innovation and Universities [CEX2024-001506-M funded by MICIU/AEI/10.13039/501100011033]. Samuel Nello-Deakin was also supported from the Ministry of Science and Innovation of Spain through a Juan de la Cierva Fellowship [JDC2023-050393-I].
Data availability statement
All datasets used in the paper proceed from public open data repositories and are freely downloadable (see specific links in Methodology section).
Code availability statement
Code sharing is not applicable to this article, as no custom code was produced beyond basic data processing and visualisation.
Editorial information
Handling editor: Aliaksei Laureshyn, Lund University, Sweden.
Reviewers: Marco te Brömmelstroet, University of Amsterdam, the Netherlands; Till Koglin, Lund University, Sweden; Mathias De Roeck, Vias Institute, Belgium.
The handling editor takes full responsibility for the final acceptance decision. The editor's decision may differ from the recommendation made by one or more reviewers.
Submitted: 17 June 2026; Accepted: 17 October 2026; Published: 6 November 2026.