Influence of weather on aspects of driving behaviour at an urban intersection
Abstract
Weather conditions increase crash risk due to decreased visibility, changing vehicle dynamics, and driving behaviour. It remains unclear how different weather conditions affect non-crash driving behaviour, whose understanding is essentially important for the genesis of crashes, and for the development of automated driving functions (ADFs). In this study the influence of 25 different weather conditions on driving behaviour at an urban intersection in Germany was quantified using selected surrogate measures of safety (SMoS). For this purpose, eight months of combined trajectory and weather data were used. For each interaction the most critical moments defined by the minimum time-to-collision, and the associated kinematic profiles in that moment were evaluated. The findings suggest measurable and significant differences in driving behaviour across all weather types, indicating that drivers adjust speed, acceleration, and spatio-temporal distances in response to weather, but particularly in response to their manoeuvres. Apparently, these responses have no negative effect on road safety. However, the results extend the current state of the art by quantifying weather- and manoeuvre-related behavioural adaptation in non-crash situations and by identifying potential implications for road infrastructure.
1. Introduction
The influence of weather on road safety has been analysed frequently. Adverse weather conditions (e.g. rain, snow/ice/hail, fog) are known to affect visibility (due to fog/smoke), vehicle stability (e.g. reduced friction due to slippery roads or severe crosswinds), driving behaviour (e.g. keeping spatial and temporal distances in vehicle-following), reduced traffic flow, and usually lead to higher crash rates, and thus influence road traffic safety (e.g. Gorzelanczyk, 2025; Hammit et al., 2019; Malin et al., 2019; NHTSA, 2022; Shangguan et al., 2020; Sullivan et al., 2025; SWOV, 2023; Wu et al., 2018).
Surrogate measures of safety (SMoS), see, for instance, Wang et al. (2021), Nikolaou et al. (2023), or Bonela et al. (2022) for an overview and detailed discussion about their use and application, are intended to complement and extend traditional ways of measuring safety by counting crashes (e.g. Hauer, 1997; Elvik, 2007) as they provide insights into the entire interaction process before the crash. This is one reason why SMoS may serve as measures of interactions among road users and may be used to avoid dangerous situations in real-time before they can actually lead to crashes (e.g. Wang et al., 2024; Junghans et al., 2024). This knowledge can help make road traffic safer by following the safe system approach (e.g. Belin et al., 2011; ITF, 2022) and, for instance, to develop safer automated driving functions (ADFs), and robust and resilient infrastructure.
However, the challenge of replacing human drivers with safe and efficient automated vehicles (e.g. Hancock et al., 2020; Gomes, 2014) has consequences for ADFs and their developers. To make an ADF work, it has to learn normal and critical driving behaviour and make it predictable under any circumstances. This requires knowledge on how external factors such as adverse weather affect human driving behaviour, reliable and accurate road user detection, and path prediction within the next seconds (e.g. Stockem Novo et al., 2023; Abdel Madjid et al., 2026; Mersch et al., 2021). This knowledge can be used to calibrate and validate ADFs in different real traffic scenarios to increase their validity and predictability.
Consequently, quantifying the influence of weather on road user behaviour in non-crash situations is needed. At intersections as one of the most conflict-rich parts of the transportation network (e.g. Federal Highway Administration, 2024), such knowledge can help ADF developers enable their algorithms to adapt to weather and driving manoeuvres. For instance, kinematic variables such as speed and acceleration describe, how road users decide to approach (e.g. brake) and leave (e.g. accelerate, keep the lane) the intersection by choosing speeds in dependence on their intended manoeuvres, and on weather. Spatio-temporal distances between leading and following vehicles can explain their proximity and riskiness of car-following (CF) interaction in terms of rear-end conflicts. However, it remains unclear, how road users adapt to weather in different manoeuvres in order to maintain safe interaction. Besides others, time-to-collision (TTC) is one measure to quantify spatio-temporal proximity and severity in CF. It represents the time that remains until a collision if at least one of the interacting road users does not change his/her behaviour (Hayward, 1972), is simple to measure and can be used as a warning criterion in collision avoidance systems (Bonela et al., 2022). If significant differences in these variables speed, acceleration, and TTC occur, these results can additionally help to identify possible deficits in infrastructure. Other SMoS adequate for this purpose are, for instance, DRAC (deceleration rate to avoid a crash), PICUD (potential index for collision with urgent deceleration), RECP (rear-end collision probability), RCRI (rear-end crash index) or MSTG (minimum safe time gap) Karim et al. (2013), see Bonela et al. (2022) and Shangguan et al. (2021) for a comprehensive overview.
In this work, the influence of 25 different weather conditions on driving behaviour at an urban intersection was quantified. Approximately eight months of road user trajectory and weather data were used, and TTC and kinematic road user profiles in the moment of the closest spatio-temporal proximity were computed.
The paper is structured as follows: in section 2, related literature about the influence of weather on road safety with regard to crashes, conflicts, and non-crash situations is presented. It closes with a research question and is followed by describing collected data and applied methods in section 3. Then, in section 4, results quantifying the influence of weather on driving behaviour are presented, which are discussed and concluded in section 5. An outlook on our future work is also presented.
2. Related literature
In this chapter findings of well-studied weather influence on road traffic safety are presented and some effective counter/compensation measures to mitigate its negative influence are described. However, in case of CF, not much literature about the influence of weather on non-crash data was found, which confirms that the results of this study extend the current state of the art and helps to quantify the influence of weather on different manoeuvres.
The influence of weather on road safety is well-studied as the following examples show. As an example, FARS data (NHTSA, 2022) showed that approximately 8.2 M (13.2%) of approximately 62 M crashes between 2013 and 2022 were weather-related leading to approximately 3 800 fatalities and 270 000 injured road users as five-year average. 77% of these crashes took place during rainfall or mist, 18% during freezing conditions and the remaining 5% occurred during low visibility conditions and crosswinds. Although these data were not corrected for exposure, they can be representative if the weather conditions are not related to the traffic state. It was found that rain, snow and adverse visibility decreased average speed by 3%–40%, free flow speed by 2%–64%, traffic volume by 5%–44% and capacity by 4%–30%. Many of these findings have been supported by other studies. For instance, snowfall, ice rain, heavy rainfall, slippery road conditions were found to contribute to higher accident risks (Malin et al., 2019; Eck et al., 2022), significant changes of traffic flow and driver behaviour leading to an increase in crash risk (Wu et al., 2018), and also on motorways and reduced traffic speed (Sullivan et al., 2025). Becker et al. (2022) concluded that weather conditions significantly changed crash risk in vehicle-type-specific ways. For instance, they found that snow mainly increased single-truck crashes, rain increased single-car crashes, sun glare raised multi-car rear-end crashes, and strong winds increased truck and debris-related crashes. Taking weather conditions into account crash prediction accuracy improved by up to 24%. Kilpeläinen et al. (2007) found that weather forecasts in Finland helped road users to plan their trips, but driving behaviour did not really change as road users primarily reacted on what they could see on the road. They found that in case of adverse weather, target speed reduced by 6-7 km/h. Further, Ghazan et al. (2008) found that weather-related crashes formed clear, weather-specific geographic clusters.
Theofilatos et al. (2014) provided a comprehensive overview of the effect of traffic and weather on road safety. Regarding weather, they found clear and consistent effects on road safety (e.g. poor visibility increases crash severity and injuries), but also contradictory inconsistent effects. For instance, rainfall and precipitation increased crash frequency due to reduced pavement friction, reduced visibility, longer stopping distances, but did not consistently increase crash severity as drivers slowed down. Snowfall was found to increase the number of accidents dramatically, but other studies found snow decreased number of fatal crashes from day to day because drivers compensated the crash outcomes by driving more cautiously. Yet, in the first day of snowfall more fatalities happened than on other snowy days. Having a specific focus on crash risk on mountainous freeways, Yu et al. (2014) found that higher speeds and seasonal and weather effects increased crash risk of single-vehicle crashes, while multi-vehicle crashes were more likely in congested traffic and dry seasons. Additionally, they found rear-end crashes to happen more frequently with better visibility while side-swipe crashes turned out to increase with decreasing visibility.
Although not corrected for exposure, Gorzelanczyk (2025) found that the road type had a larger influence on crash outcomes than weather, indicating that good weather appeared to be highly correlated with crashes, particularly on high-traffic roads, which is quite counter-intuitive. Fog as one of the most critical conditions was also found to be studied extensively. For instance, the risk of rear-end collisions was found to increase with a decrease of visibility (Shangguan et al., 2020), and foggy conditions led drivers to stay in visibility range and breaking NHTSA’s safe headway recommendation rule of 3 seconds (Broughton et al., 2007). Wu et al. (2017) found that dense fog dramatically increased rear-end crash risk, mainly because of delayed hazard detection in CF as the drivers could not react properly on what were not able to see. The authors suggested real-time-based visibility-aware speed management to be essential for road safety management. Chakrabarty et al. (2013) highlighted the importance to study driver behaviour and crash characteristics during adverse weather conditions, and Theofilatos et al. (2014) stated that crashes could be predicted from traffic conditions when using real-time weather and traffic data and emphasised the importance to understand the combined effect of traffic and weather using real-time data. The importance of using real-time weather data, particularly rain and fog, improved crash risk estimation/prediction, for instance, Zeng et al. (2020), or Xu et al. (2018).
Besides the quantification of the influence of weather (e.g. fog, rainfall) on road safety, it is very important to consider the type of manoeuvre, too (e.g. Gorzelanczyk, 2025). For instance, it is known that overtaking (e.g. Zhang et al., 2016), lane changing (e.g. Park et al., 2018; Shawky, 2020), and particularly turning left in oncoming traffic (e.g. EC, 2024; Azar, 2025) (i.e. all manoeuvres with changing directions) are some of the most critical traffic manoeuvres.
In contrast, not much literature could be identified with regard to measure non-crash driving and CF-behaviour in different weather conditions. For instance, Hammit et al. (2019) used naturalistic data to improve microscopic simulation models with accurate CF behaviour. Shangguan et al. (2021) developed an SMoS metric by addressing a more comprehensive way to capture CF dynamics, which are not simply the result of closeness of road users, but by the interaction of following distances, speed differences, and driver response behaviour, to compute the crash risk. The research supports the development of smarter collision-warning systems and more proactive traffic safety management approaches. However, as stated above, such knowledge is important as it quantifies CF behaviour dynamically over time, for instance by using TTC. TTC is represented by the net distance d of a vehicle following the leading vehicle divided by their speed difference ∆v, i.e. TTC = d / ∆v. It is a continuous function over time, which represents the whole CF-process as long as the vehicles follow each other with certain critical moments. For instance, if TTC decreases, crash risk increases since the distance between the vehicles decreases. The most critical moment is when TTC reaches a minimum. This moment characterises the closest spatio-temporal proximity and—if the speeds of the CF partners are not too low—severity of the CF interaction. Clearly, TTC = 0 corresponds to a crash, while TTC ≈ 0 can be very critical if the vehicles drive at higher speeds. In the literature different TTC thresholds can be found to quantify collision risk, but in case of rear-end collisions in urban areas, values below 1.5 s–2 s are accepted to be critical (e.g. Svensson, 1998; Deveaux et al., 2021).
Much has been done to avoid or mitigate crash risks due to adverse weather conditions. For instance, The Norwegian Traffic Safety Handbook (Høye et al., 2023) gives detailed insights on how different weather conditions affect road safety, reduced friction, visibility and driving conditions, reaching from vehicle modification (e.g. tires with more friction), snow clearing service (e.g. sanding, salting) to education and personal behavioural change (e.g. driving schools, reduced exposure and traffic avoidance, lower speeds, larger distances to the vehicle in front) to compensate these influences. In the project SafetyCube (SafetyCube DSS, 2020), a road safety decision support system was developed to help policymakers choose the best measures to reduce severities and casualties of all types of road users, mainly in Europe. It was dedicated to the influence of crash contributing factors regarding road user behaviour, infrastructure and vehicle. Adverse weather was one of the risk factors that was addressed by providing detailed insights of the influence of weather in several studies, but none of them was found to relate to rear-end collisions or rear-end conflicts. SWOV (2023) represents a summary of weather influences and actions to improve safety, too. Taking these findings into account, it seems counter-intuitive that although weather has an influence on road safety, the accident numbers are comparably small. This leads to the assumption that road users respond to adverse weather and already adapt to the weather conditions to mitigate collision risk.
Further ways of mitigating collisions risks are ADFs. Their idea is to assist drivers to maintain a certain comfort, and to drive safely, efficiently, for instance in case of lane-keeping, CF, overtaking, vehicle control/stability, and avoidance and mitigation of collision risks, for instance, as collision warning systems. Such systems require an autonomous and reliable detection of potentially dangerous situations and estimation of their possible outcomes and thus, must provide compensation strategies of their negative effects, for instance, due to adverse weather. For instance, Lee et al. (2018) and Zhang et al. (2023) suggested to fuse different sensor technologies on autonomous vehicles to operate in different weather conditions. Walker et al. (2020) argued that—besides dense urban traffic with occlusions, limited sensor ranges, and many interacting road users (e.g. Yu et al., 2019)—weather is one of the most significant remaining barriers to reliable, large-scale deployment of self-driving vehicles as they perform best under best conditions for humans (e.g. clear weather, good visibility, well-marked roads), but may suffer from a significant reduction of the reliability of vehicle perception systems, making it harder for vehicles to detect lanes, obstacles, pedestrians, traffic signs, and other vehicles. They stated further that advances in meteorology, environmental sensing, and weather-aware decision systems are essential for autonomous transportation as, besides powerful AI methods, environmental uncertainty is one of the key factors to hinder widespread penetration of autonomous vehicles, because they may face significant limitations in deployment, reliability, and public acceptance. Snow was mentioned as particular example as it may create particular difficult problems (e.g. snow can cover lane markings, alter road boundaries, obscure road signs, change vehicle dynamics through reduced traction). Consequently, such conditions challenge both perception systems and ADFs, thus autonomous vehicles requesting, for instance, high-resolution weather observations, short-term weather forecasts, road-weather information systems, real-time environmental intelligence. Obviously, ADFs have to consider the current weather conditions to work properly. As a consequence, the knowledge of the effect of the certain weather on road user behaviour is of particular importance for reliable performance of ADFs.
Going through the current state of the art, an open research question is, whether and how drivers adapt to specific weather conditions in CF in the moment of closest spatio-temporal proximity in case of non-crash situations. For this purpose, several months of road user trajectory data recorded at an urban intersection are merged with weather data, and significant differences in kinematic and TTC data for each of the possible and regular manoeuvre type are searched for.
3. Data & methods
This research makes use of recorded motorist trajectories at the AIM Research Intersection, merged with weather data collected at a near weather station in Braunschweig, Germany.
3.1 Trajectory data
AIM Research Intersection is a four-legged signalised urban crossing located at the north-eastern arm of the ring road in Braunschweig, Germany. It is equipped with stereo-cameras (Knake-Langhorst & Gimm, 2016). This intersection provides lanes for 19 traffic manoeuvres, i.e. four lanes from the north, and five lanes for each direction. All manoeuvres are protected, except an unprotected left-turn from west to north.
Between 20 000 and 40 000 road users pass this intersection every day (Schicktanz et al., 2025). For this research, data from approximately eight months of road user trajectories were collected between 21 January and 5 September 2019, excluding April, due to unavailable trajectory data. Note that the absence of April as a transition month between winter and summer with weather phenomena from both seasons raises questions about seasonal bias of this research. This point is discussed in Section 5. Trajectories were recorded at 25 fps. They provide GNSS-based time stamps, UTM positions, velocities, accelerations, headings, modes of transportation (e.g. car, truck, pedestrian, cyclist) and their sizes. Video data was anonymised in real-time to very low-resolution images to fulfil the European General Data Protection Regulation restrictions (GDPR, 2016).
3.2 Weather data
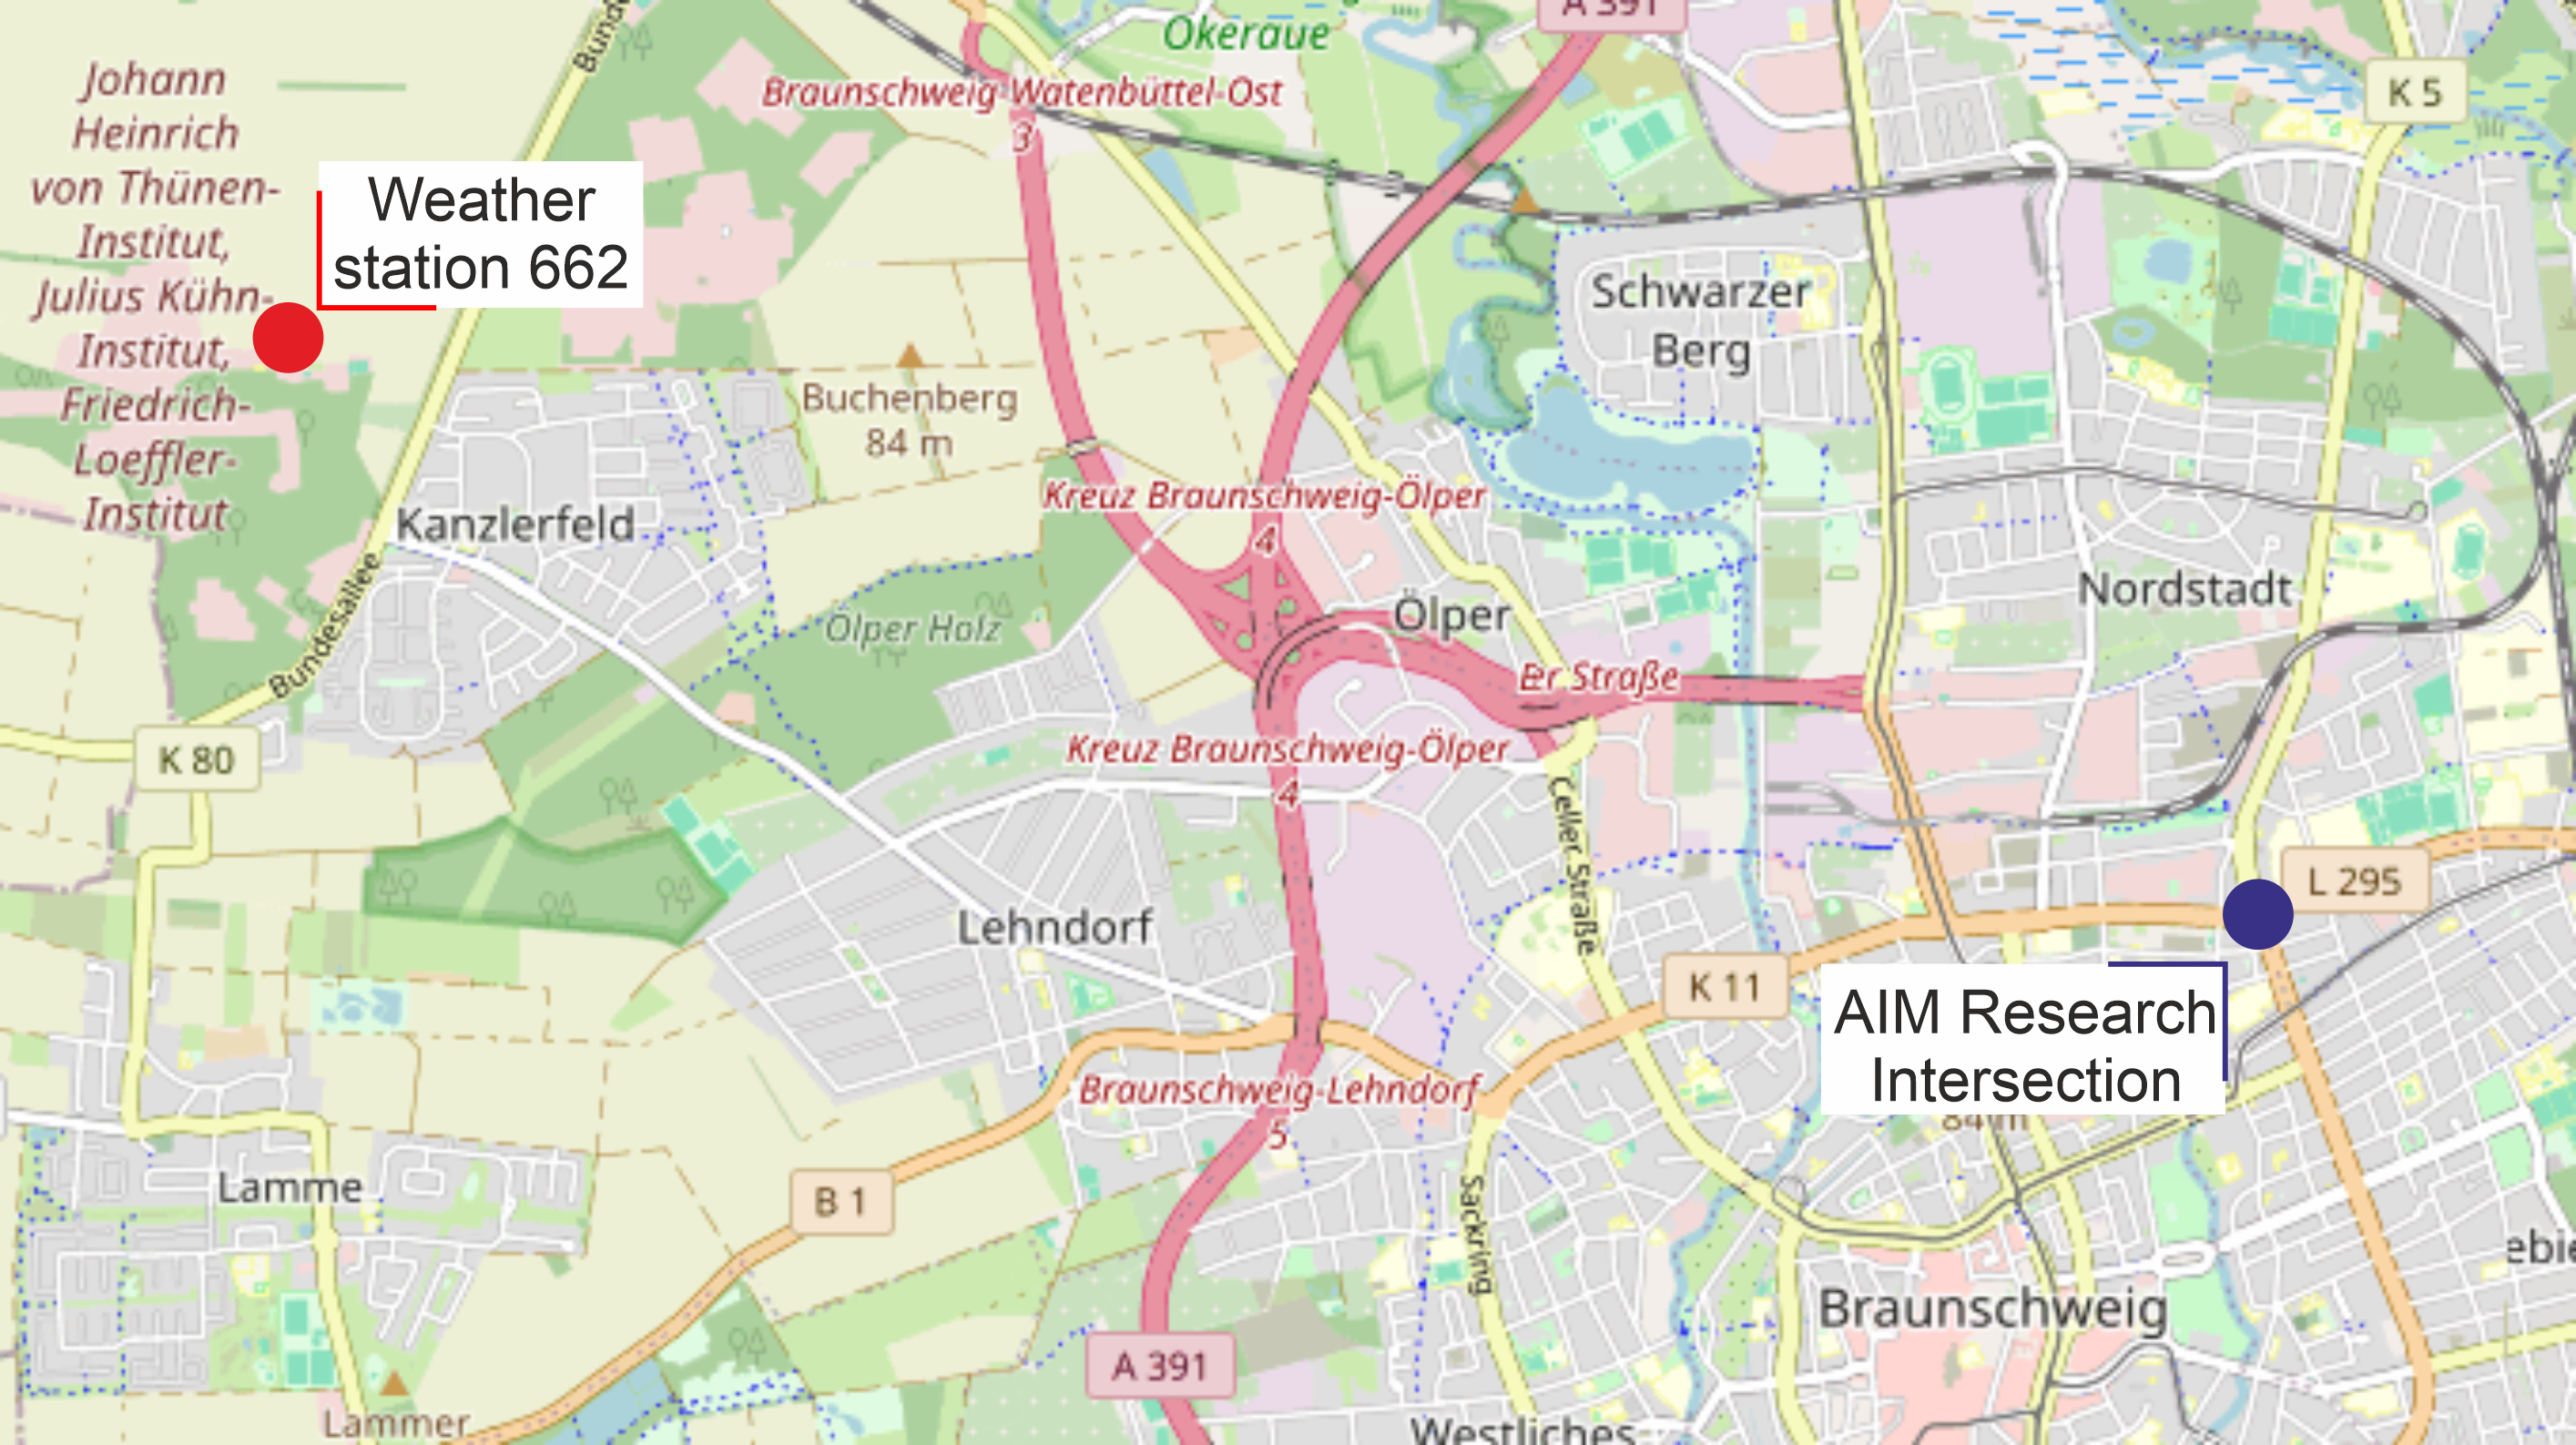
Weather station 662 (N 52.2915°, E 10.4464°; 81 m above sea level) is located 6.3 km west of the AIM Research Intersection (Figure 1). It provides hourly aggregated weather data in several different weather types, including normal weather, haze, different types of liquid rainfall, snowfall, and fog, which can be downloaded from DWD (2023). During trajectory data collection between January and September 2019, 25 different weather types were recorded, which will be introduced in Table 1.
| Weather symbol | Weather type |
|---|---|
 |
|
 |
|
 |
|
 |
|
 |
|
 |
|
 |
|
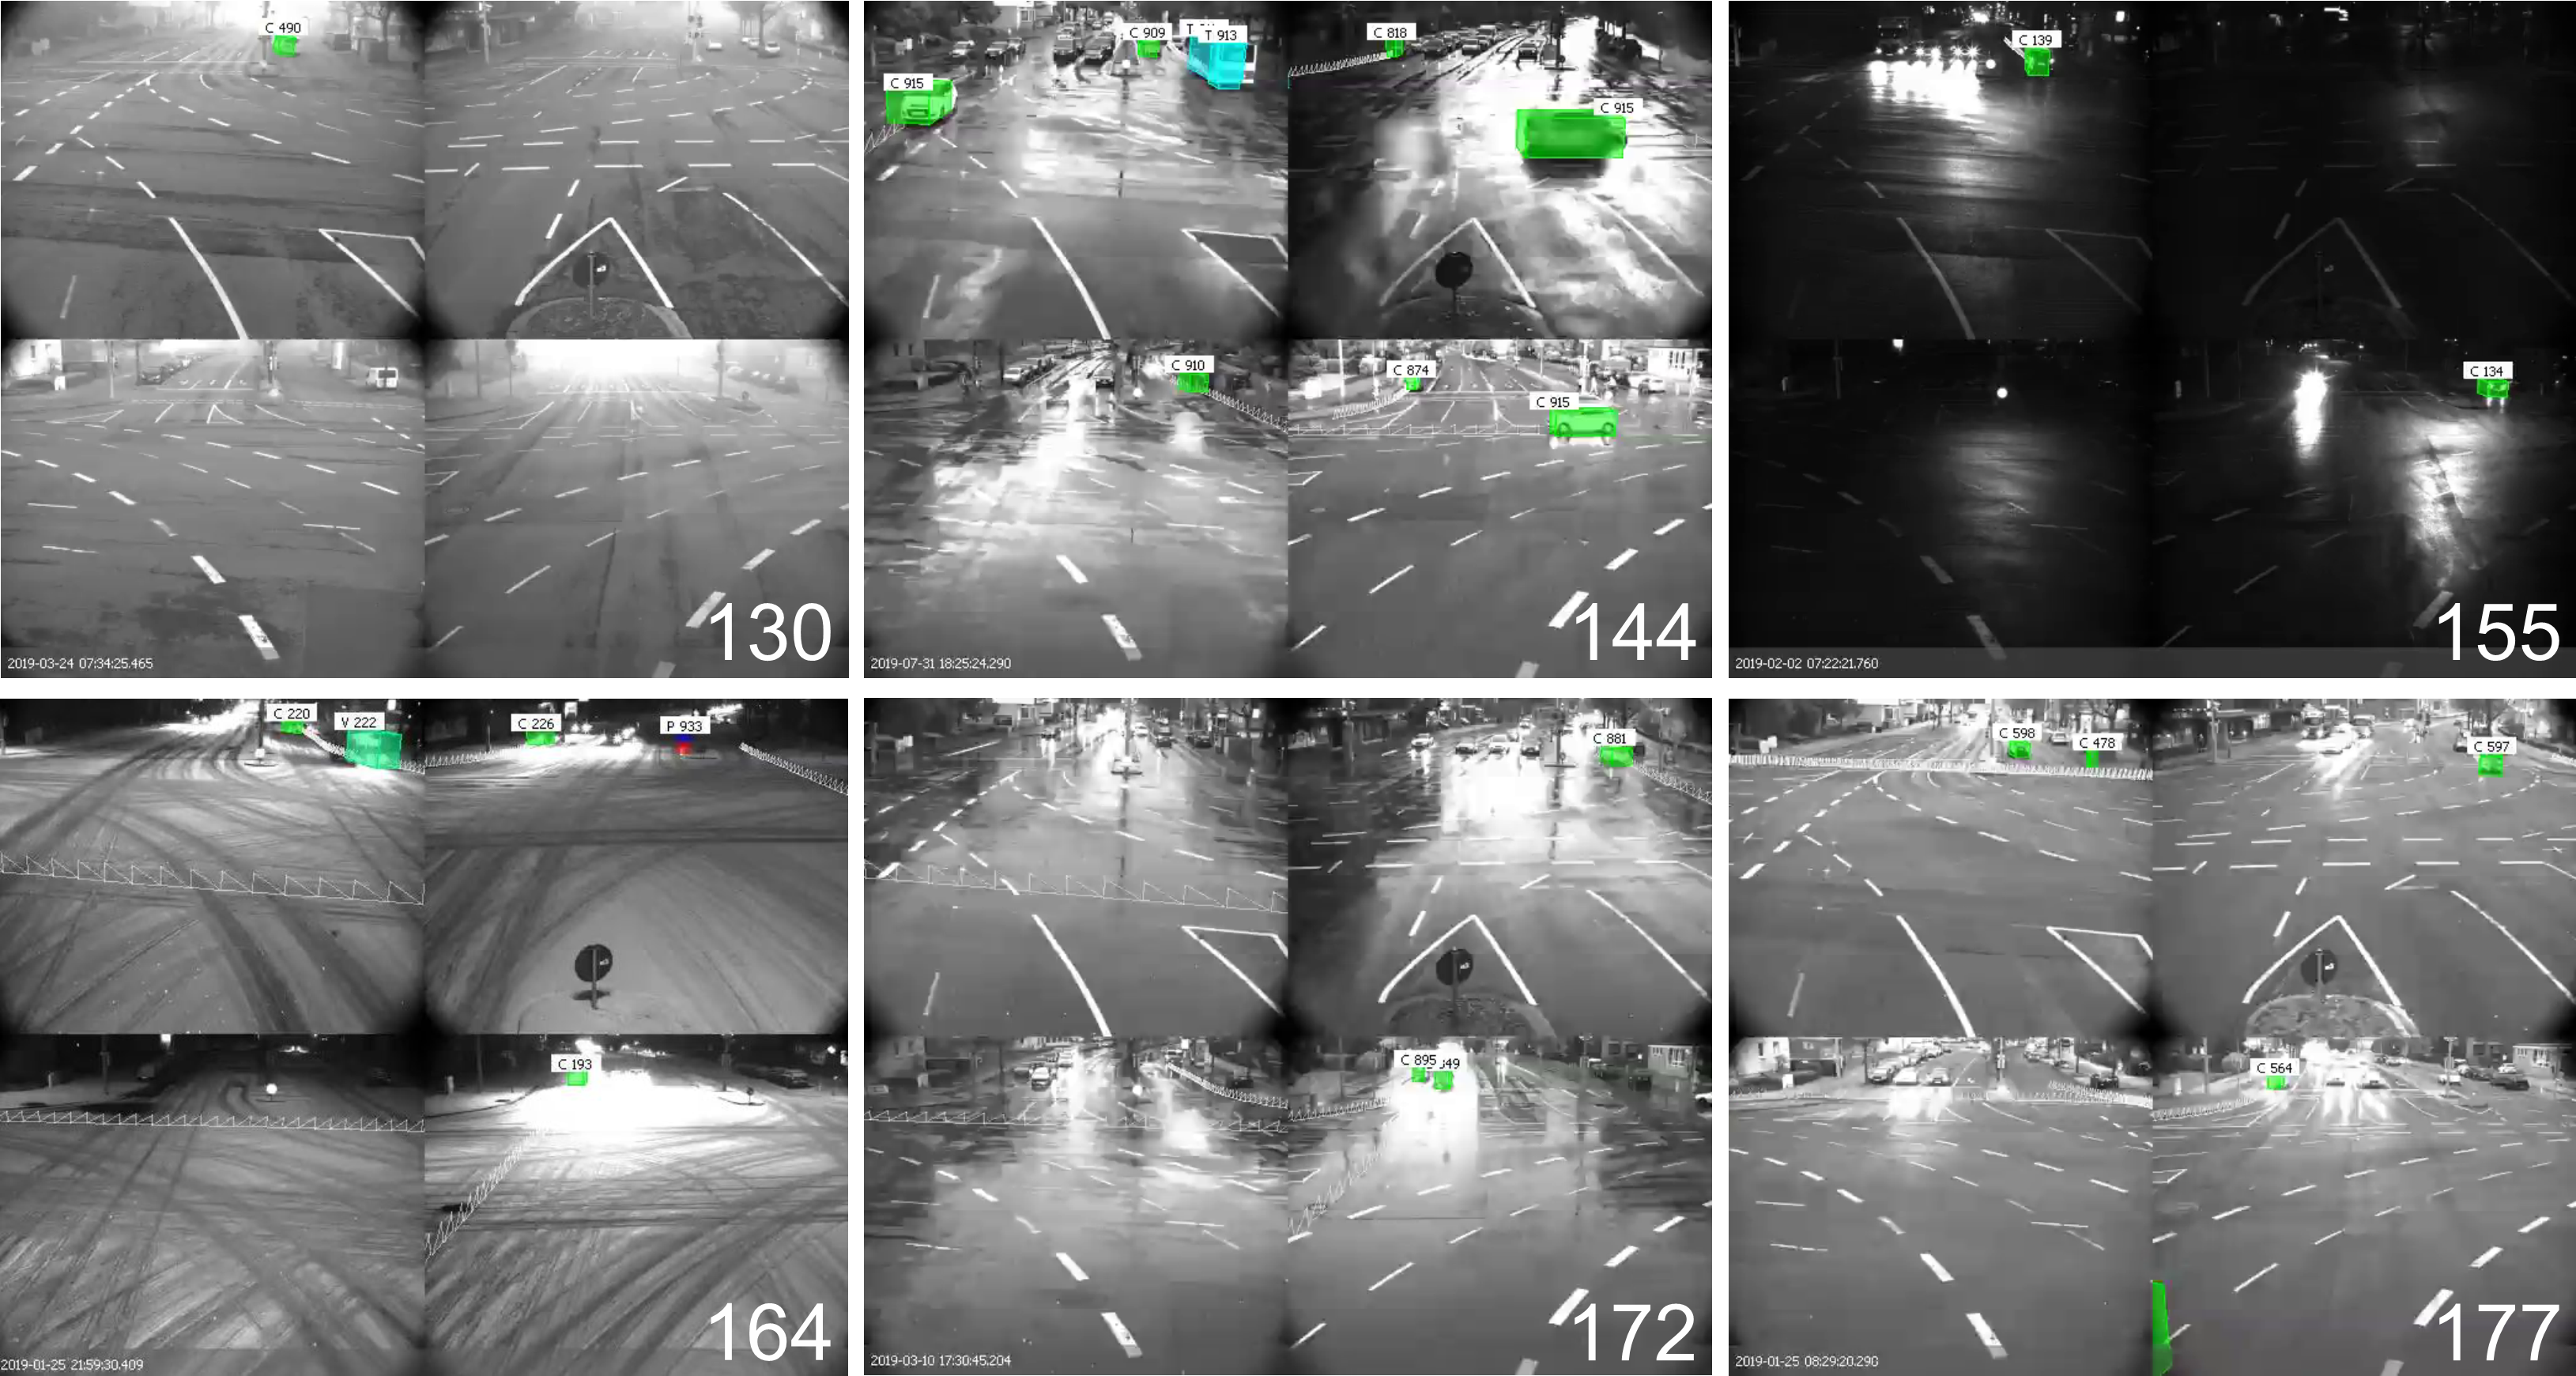
Figure 2 shows six sample video images that give some impressions of weather types 130 (fog), 144 (heavy liquid rainfall), 155 (moderate freezing spray rain), 164 (light freezing rain), 172 (moderate snowfall), and 177 (snow drizzle) at the AIM Research Intersection.
3.3 Data processing
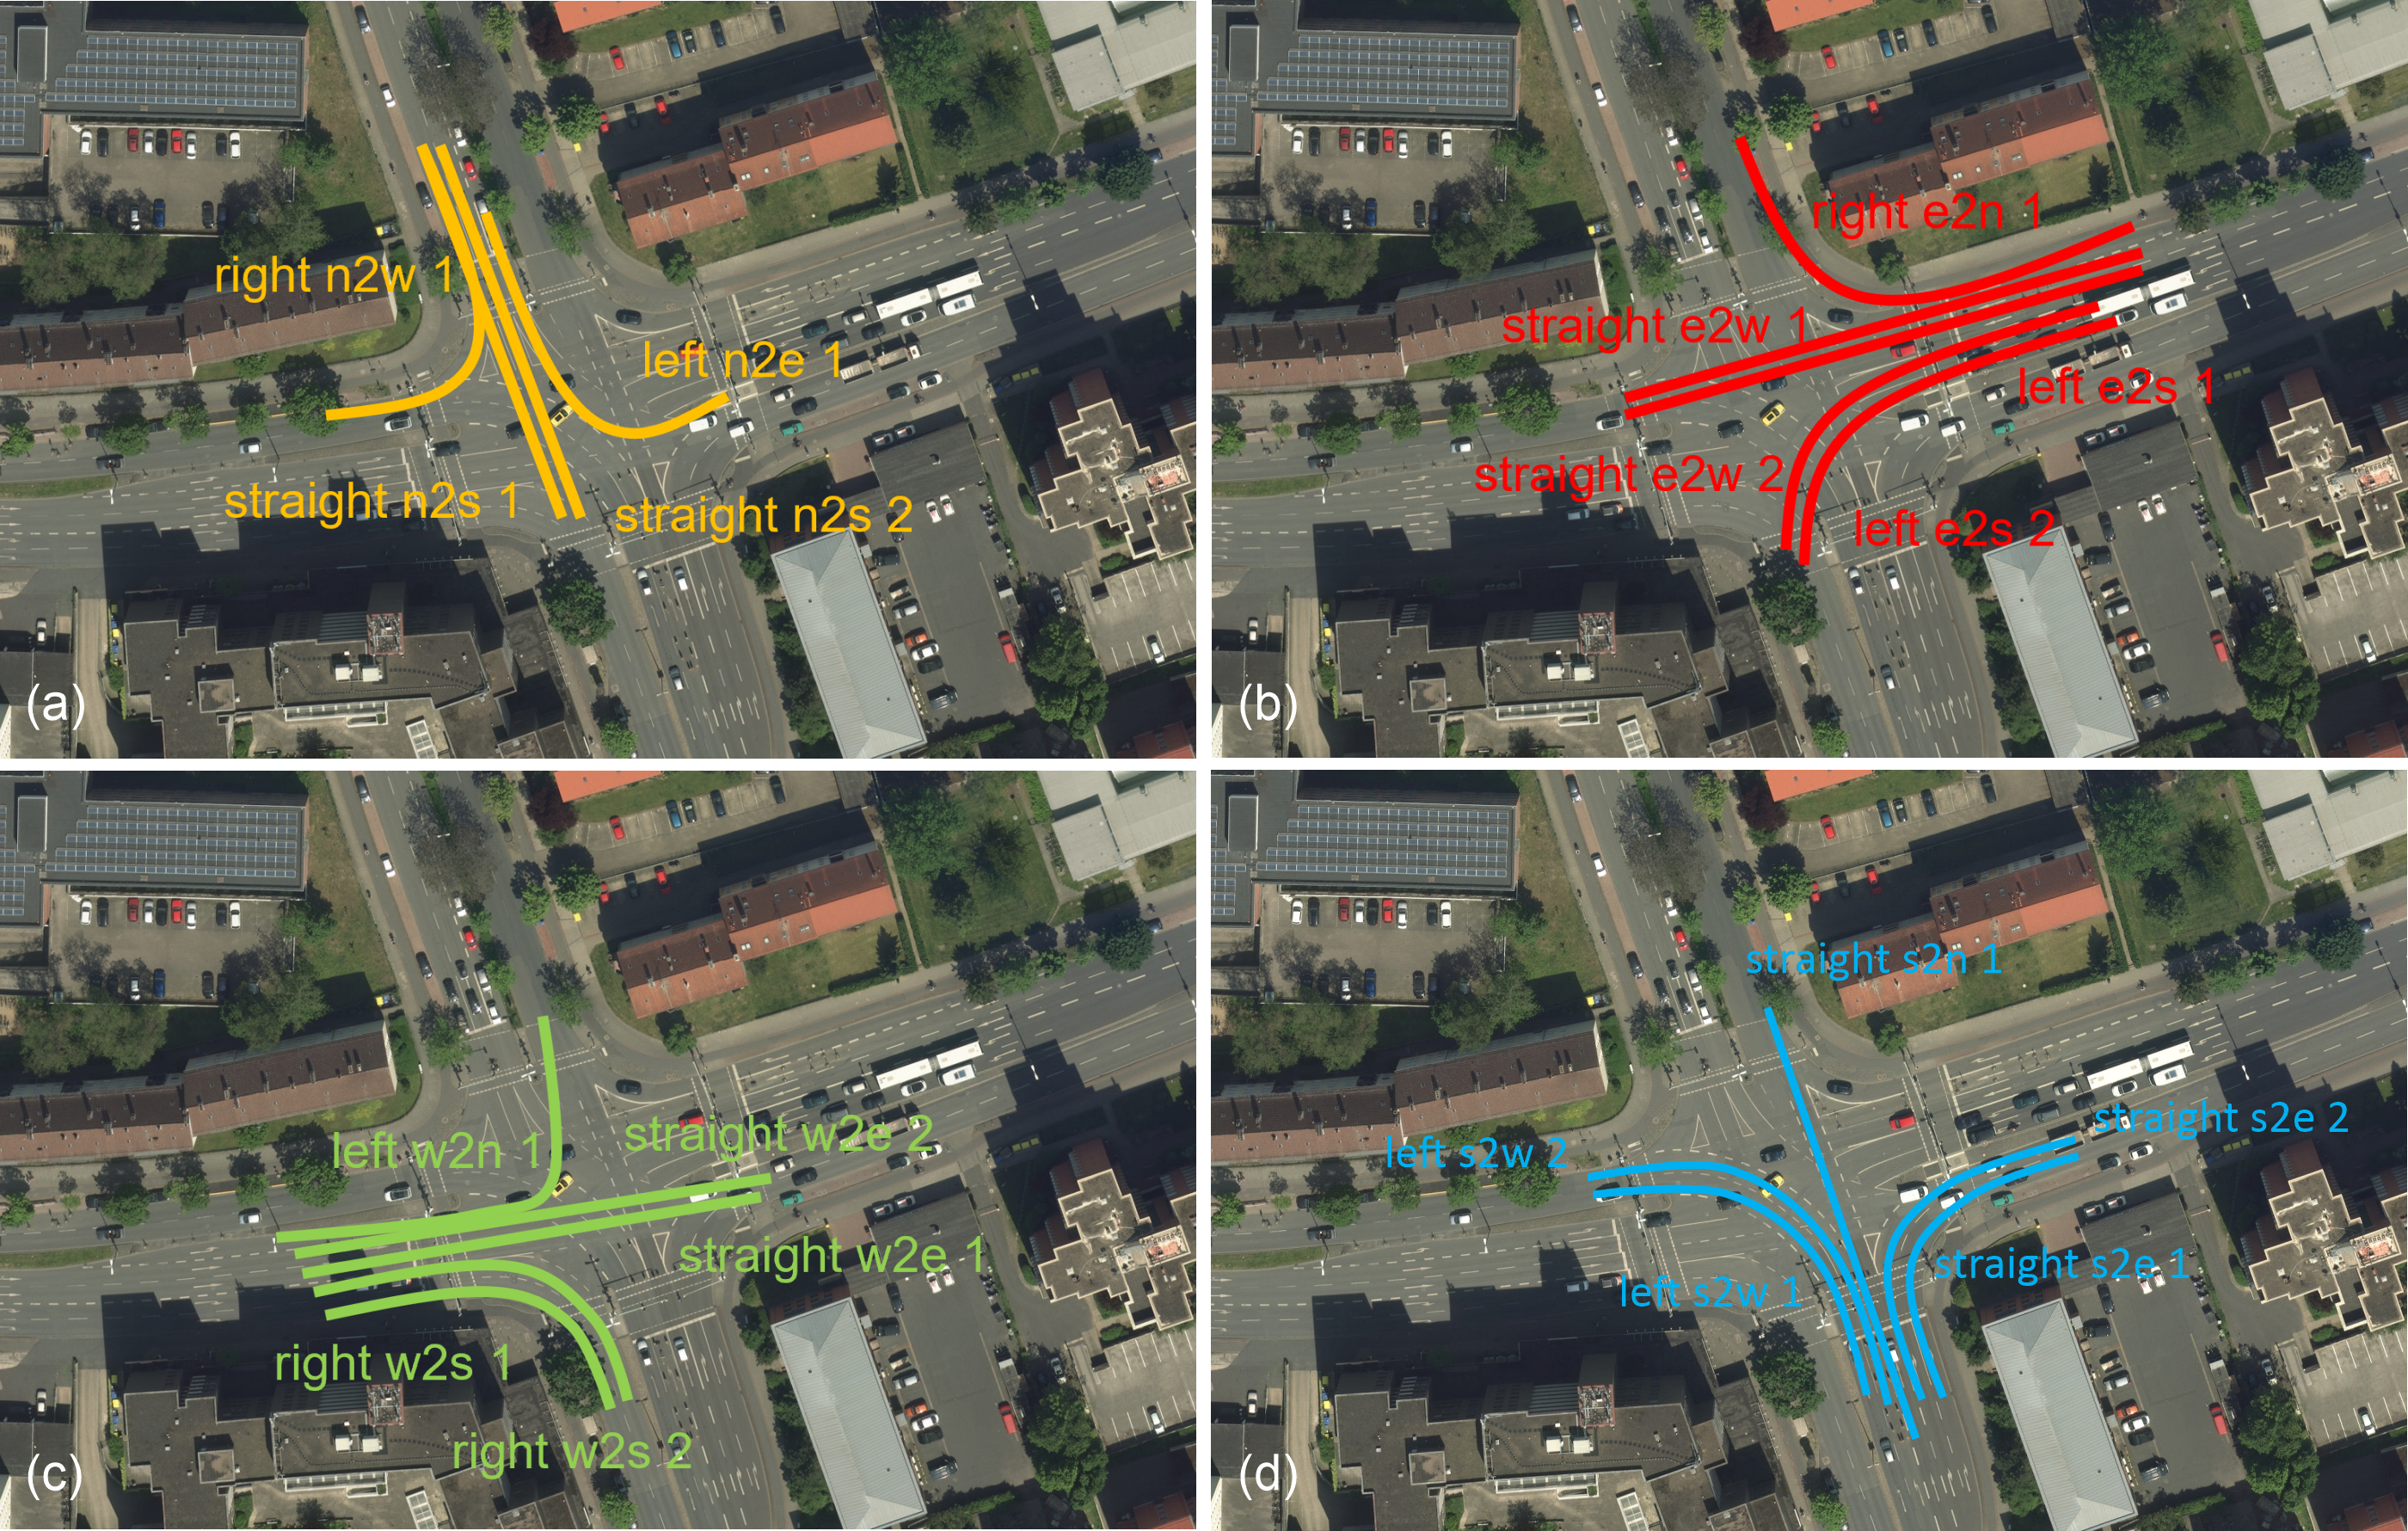
First, only valid road user trajectories were merged with valid hourly weather data. In a second step, all road user trajectories were filtered with regard to their origin, destination and lane using virtual loops placed accordingly on the digital orthophoto of the intersection. In Figure 3, all 19 traffic manoeuvres at the urban intersection are shown. The notation contains:
-
manoeuvre: turning right, turning left, and driving straight
-
manoeuvre/direction:
-
lane: first lane (i.e., far-most right lane of the manoeuvre, lane 1), and second lane (i.e., far-most left lane of the manoeuvre, lane 2)
For instance, the notation ‘left s2w 2’ indicates turning left from south to west on the second left lane.
In a third step, each vehicle trajectory was analysed with regard to its interaction with the vehicle directly in front to quantify CF interaction behaviour. TTC was chosen for this task, more precisely, the course of TTC as the vehicle crossed the intersection. From this, the minimum TTC value (i.e. TTCmin) for each interaction was determined. Additionally, the kinematic values of speed v and acceleration a were determined in this certain moment (i.e. v(TTCmin) and a(TTCmin), respectively).
Fourth, all the obtained values for TTCmin, speed and acceleration for each traffic manoeuvre and weather conditions were collected in a 19 x 25-matrix (19 traffic manoeuvres, 25 weather types) and underwent statistical evaluation (see section 3.4). In case of less than ten data samples (i.e. ten road interactions) the data was excluded from the analysis. To compare different situations, traffic-manoeuvre-related weather indices were computed against the baseline of normal weather (type 100) with wx,i,r as weather index for weather type i, traffic manoeuvre r, and interaction/kinematic parameter x = {TTCmin, v(TTCmin), a(TTCmin)}:
\begin{eqnarray} w_{x,i,r} = \frac{x_{i,r}}{x_{100,r}} - 1,\tag{1} \end{eqnarray}
Note, that x100,r characterises the average (i.e., mean or median) and is the baseline parameter for weather type 100 and traffic manoeuvre r.
After all, the coefficient wx,i,r is marginalised by computing a traffic manoeuvre-independent weather index Wx,i to quantify the weather-based influence of every weather type against the baseline. Here, Wx,i considers the different numbers of data samples nx,i,r for each weather type i and relation r:
\begin{eqnarray} W_{x,i} = \frac{\sum_{r}^{}{n_{x,i,r\ } \cdot \ }w_{x,i,r\ }}{\sum_{r}^{}n_{x,i,r\ }}.\tag{2} \end{eqnarray}
3.4 Applied statistics
Due to the different number of data samples for each traffic manoeuvre and weather type, KS-test (Kolmogorov-Smirnov-test) was applied to test the baseline probability distribution (i.e. the kinematic/interaction parameter x in equation (1) against weather type 100) against all 24 remaining ‘weather-distributions’ for each traffic manoeuvre r.
4. Results
Although significant weather influences were observed, they turned out to be weak and not consistent between TTC, speed, and acceleration. For that reason, the results of traffic manoeuvre-independent weather indices according to equations (1) and (2) are presented in section 4.2.
4.1 Driving behaviour
The results of TTCmin, v(TTCmin), and a(TTCmin), are presented for each weather type and traffic manoeuvre, respectively.
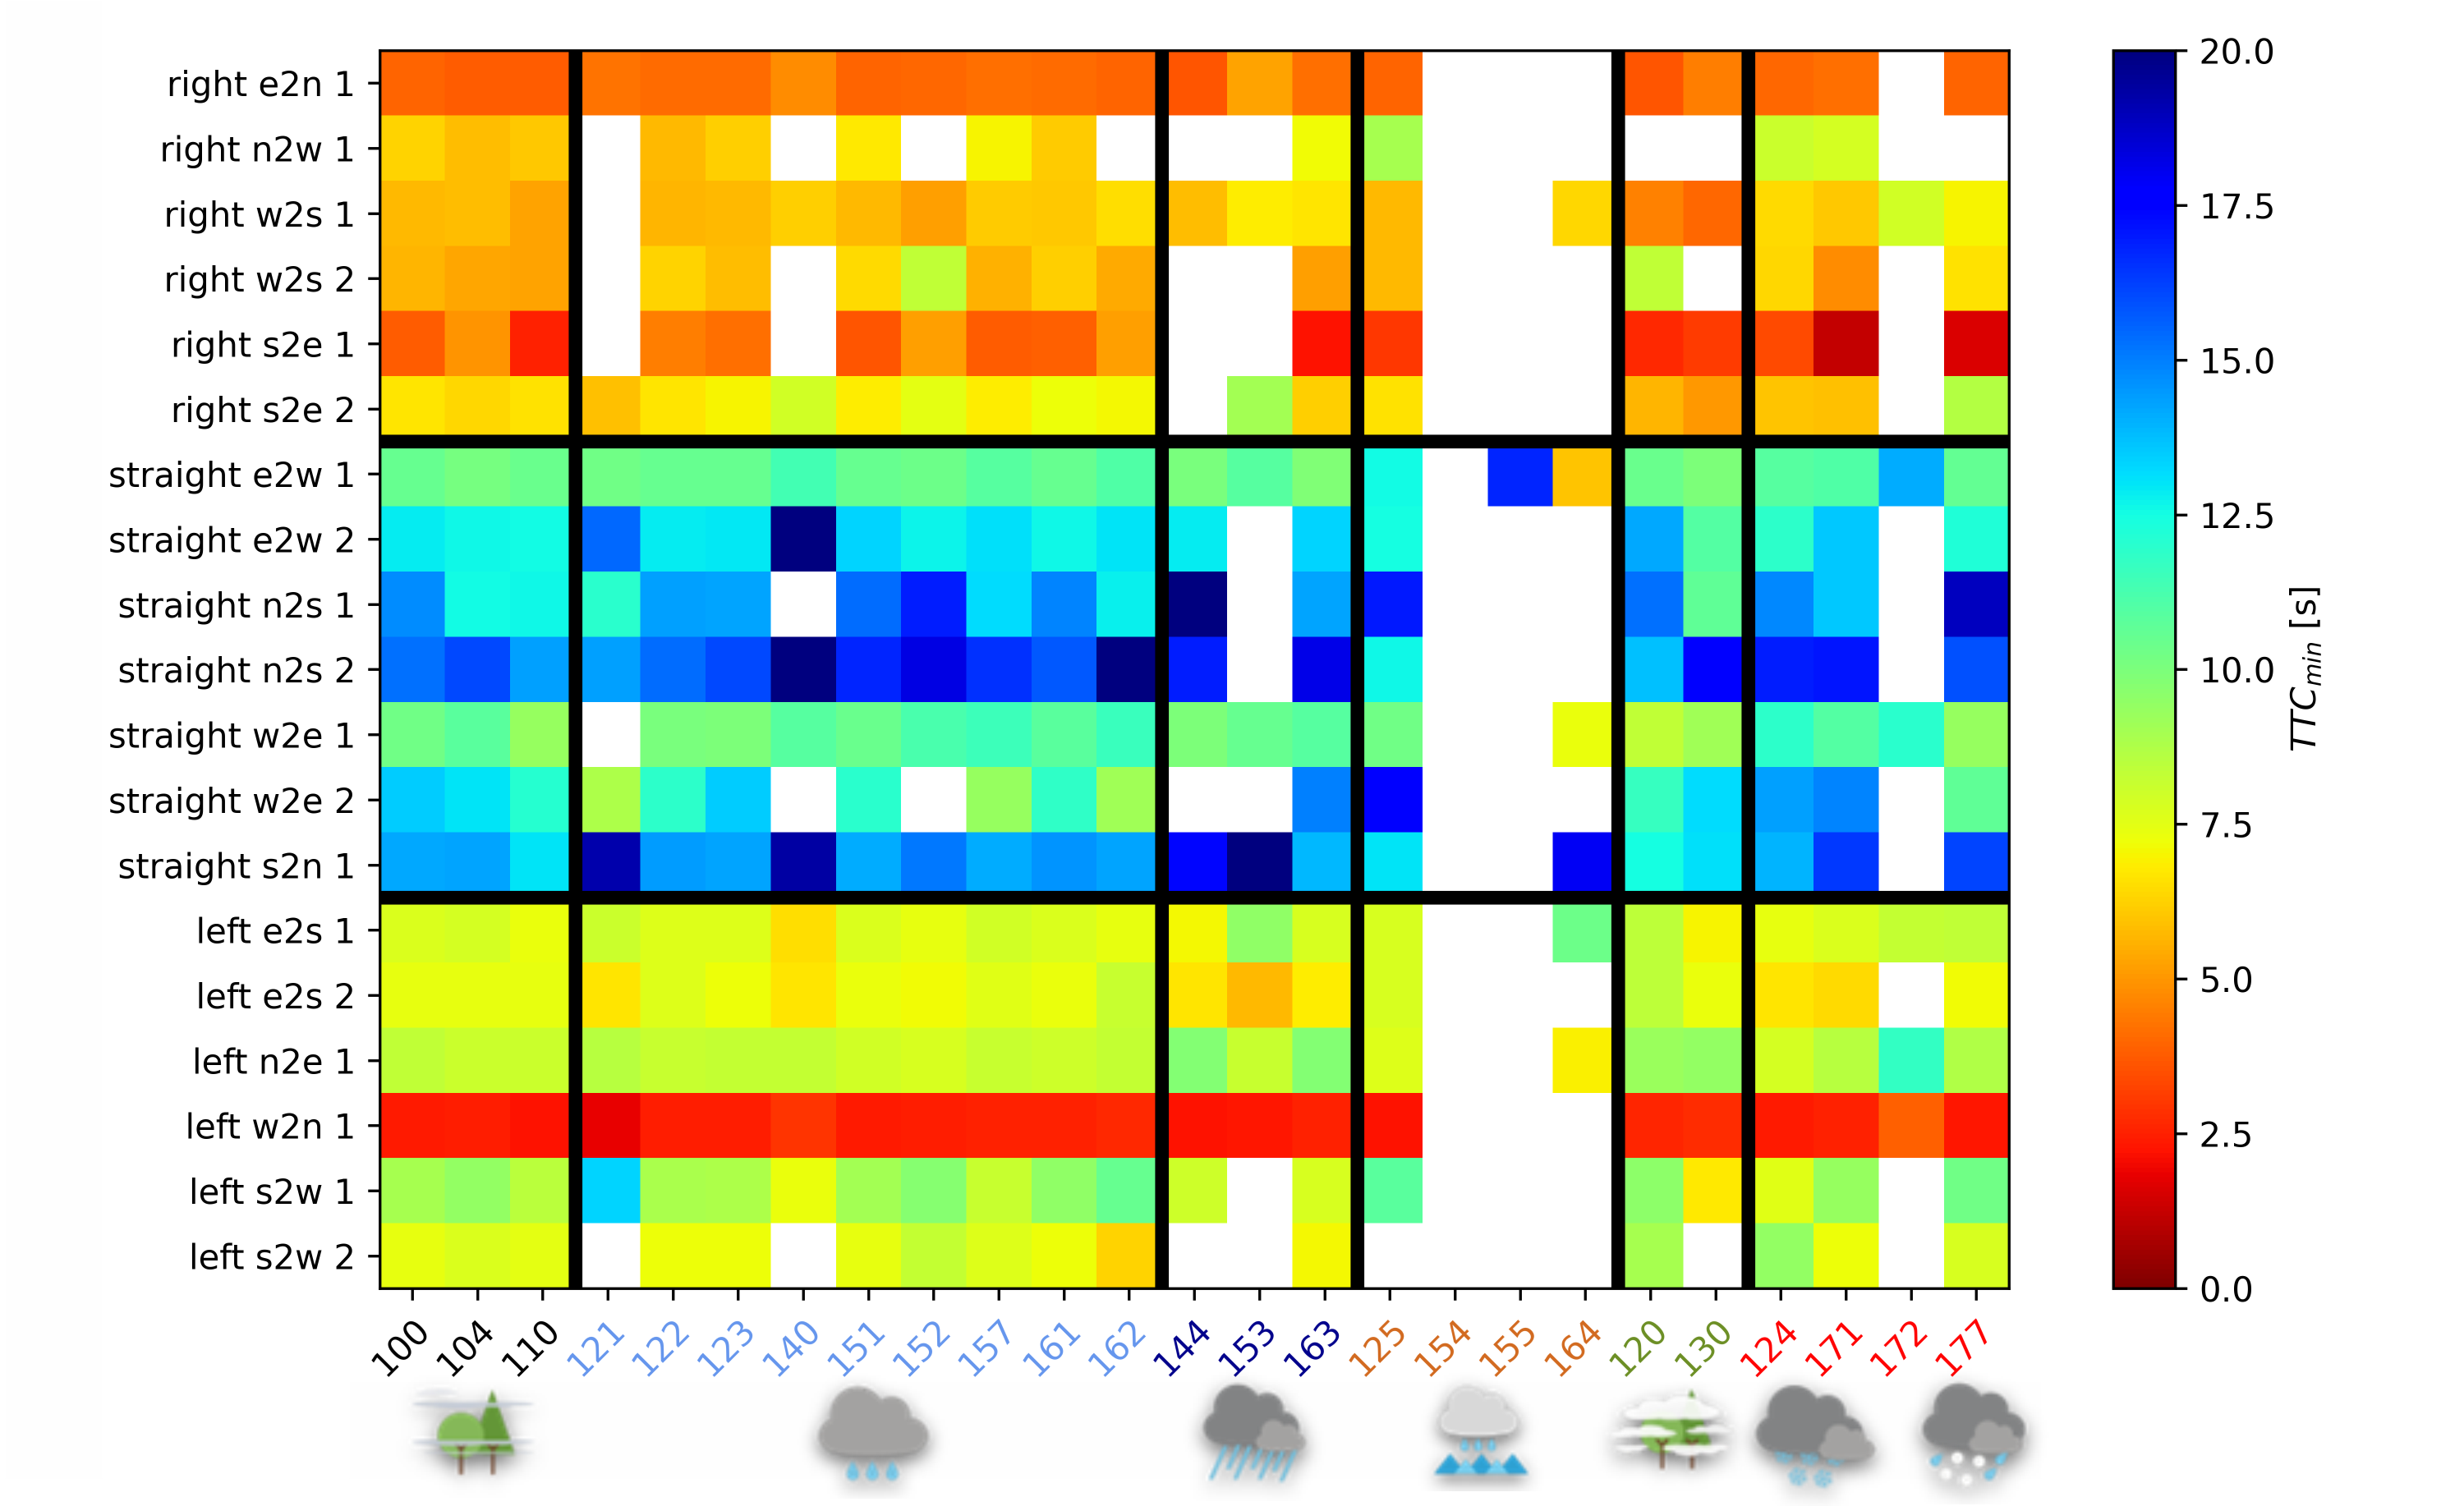
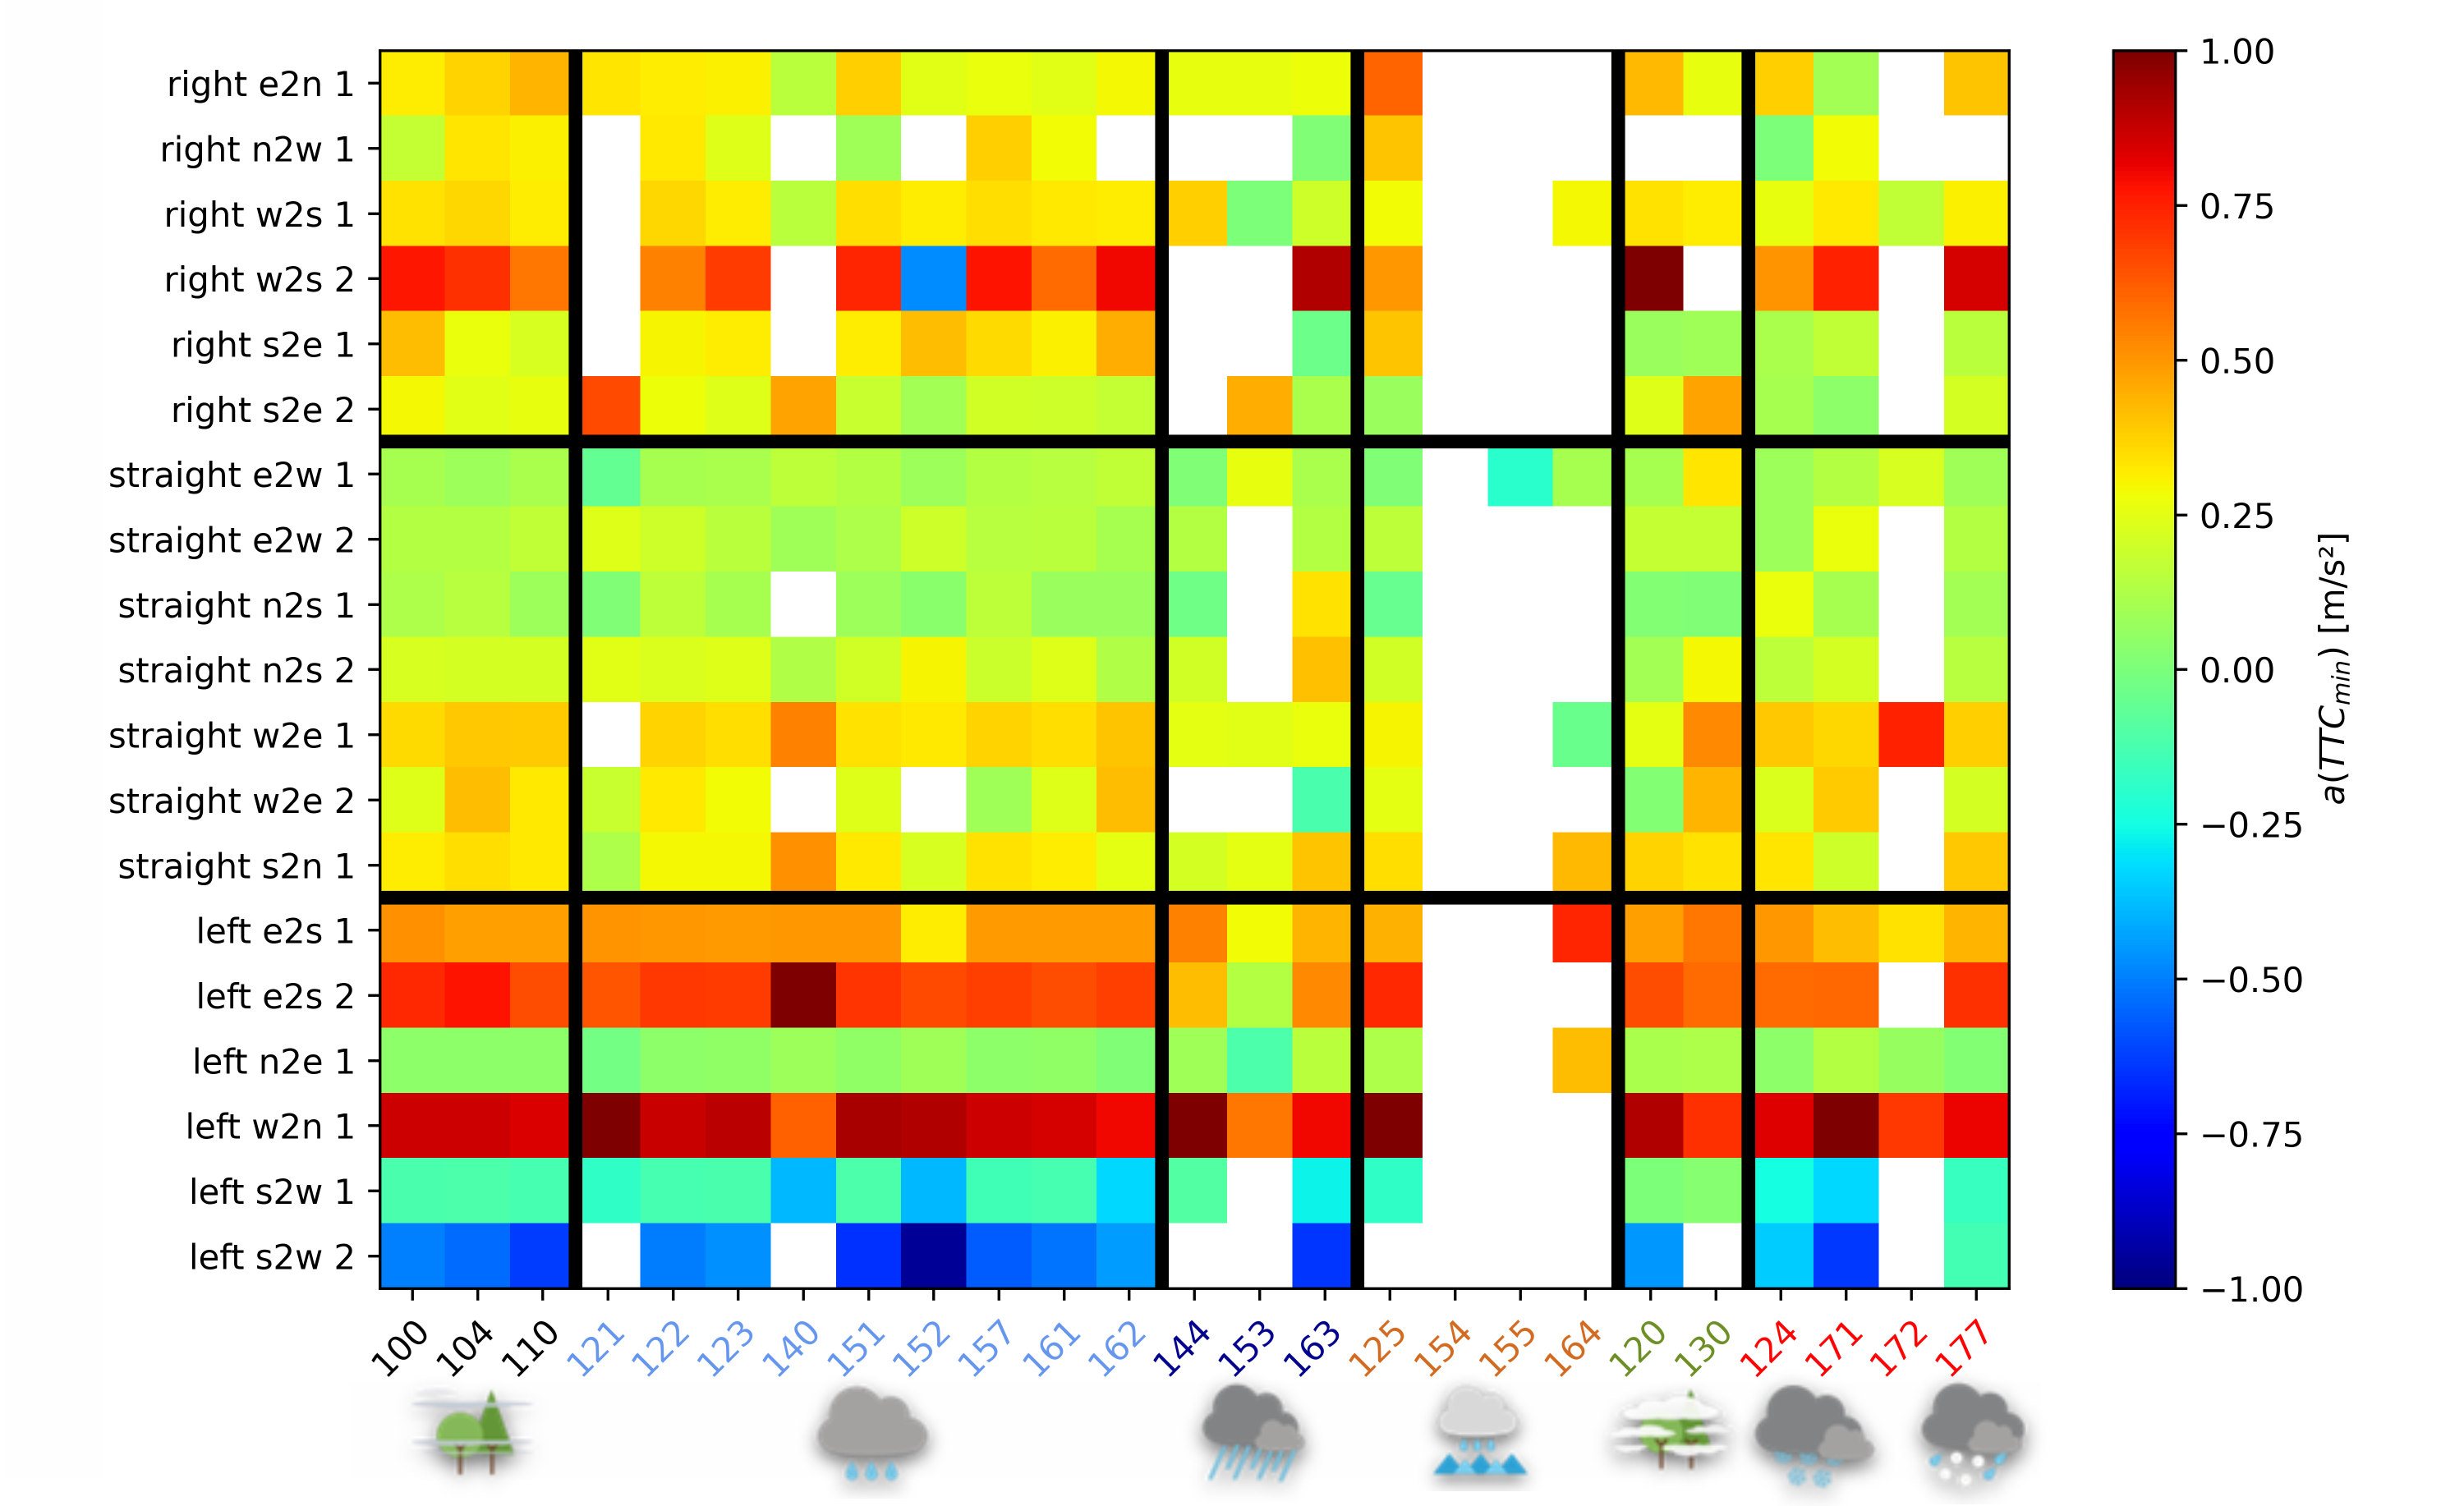
Note that in the following matrix-plots the results are presented for all 25 weather types (abscissa) and 19 traffic manoeuvres (ordinate), in which the results are shown as coloured cells. In case of blank cells, not enough data was available.
In Figure 4, the median values for TTCmin are shown. The analysis shows clear differences in TTCmin across different traffic manoeuvres. While right-turns were characterised by the smallest (i.e. most critical) TTCmin values (i.e. TTCmin = 1.6 s–9.0 s), left-turns appeared with higher values (TTCmin = 5.7 s–13.3 s) except the unprotected left-turn ‘left w2n 1’ with TTCmin = 1.8 s–3.9 s; and straight movements generally exhibited the largest values (TTCmin = 6.0 s–51.7 s) with largest variance. Interestingly, contradictory results were obtained in case of some of the adverse but not ‘normal’ weather conditions, which led either to the largest or smallest TTCmin values. Some of those findings occurred for specific weather types only such as 163 (heavy rain), 164 (light freezing rain), 120 (‘after fog’) and 130 (fog). Additionally, the results also indicated that TTC values varied strongly within the same traffic manoeuvre, but in different directions. The reasons for this are not clear yet. In general, it can be seen that—although exceptions occurred—rainfall/snowfall conditions increased TTCmin for all manoeuvres.
In Figure 5 the medians of speed in the moment of TTCmin are shown. In contrast to the TTC values in Figure 4, clear patterns for each traffic manoeuvre (i.e. straight vs turning right vs turning left) occurred, indicating that the influence of weather on speed is weak.
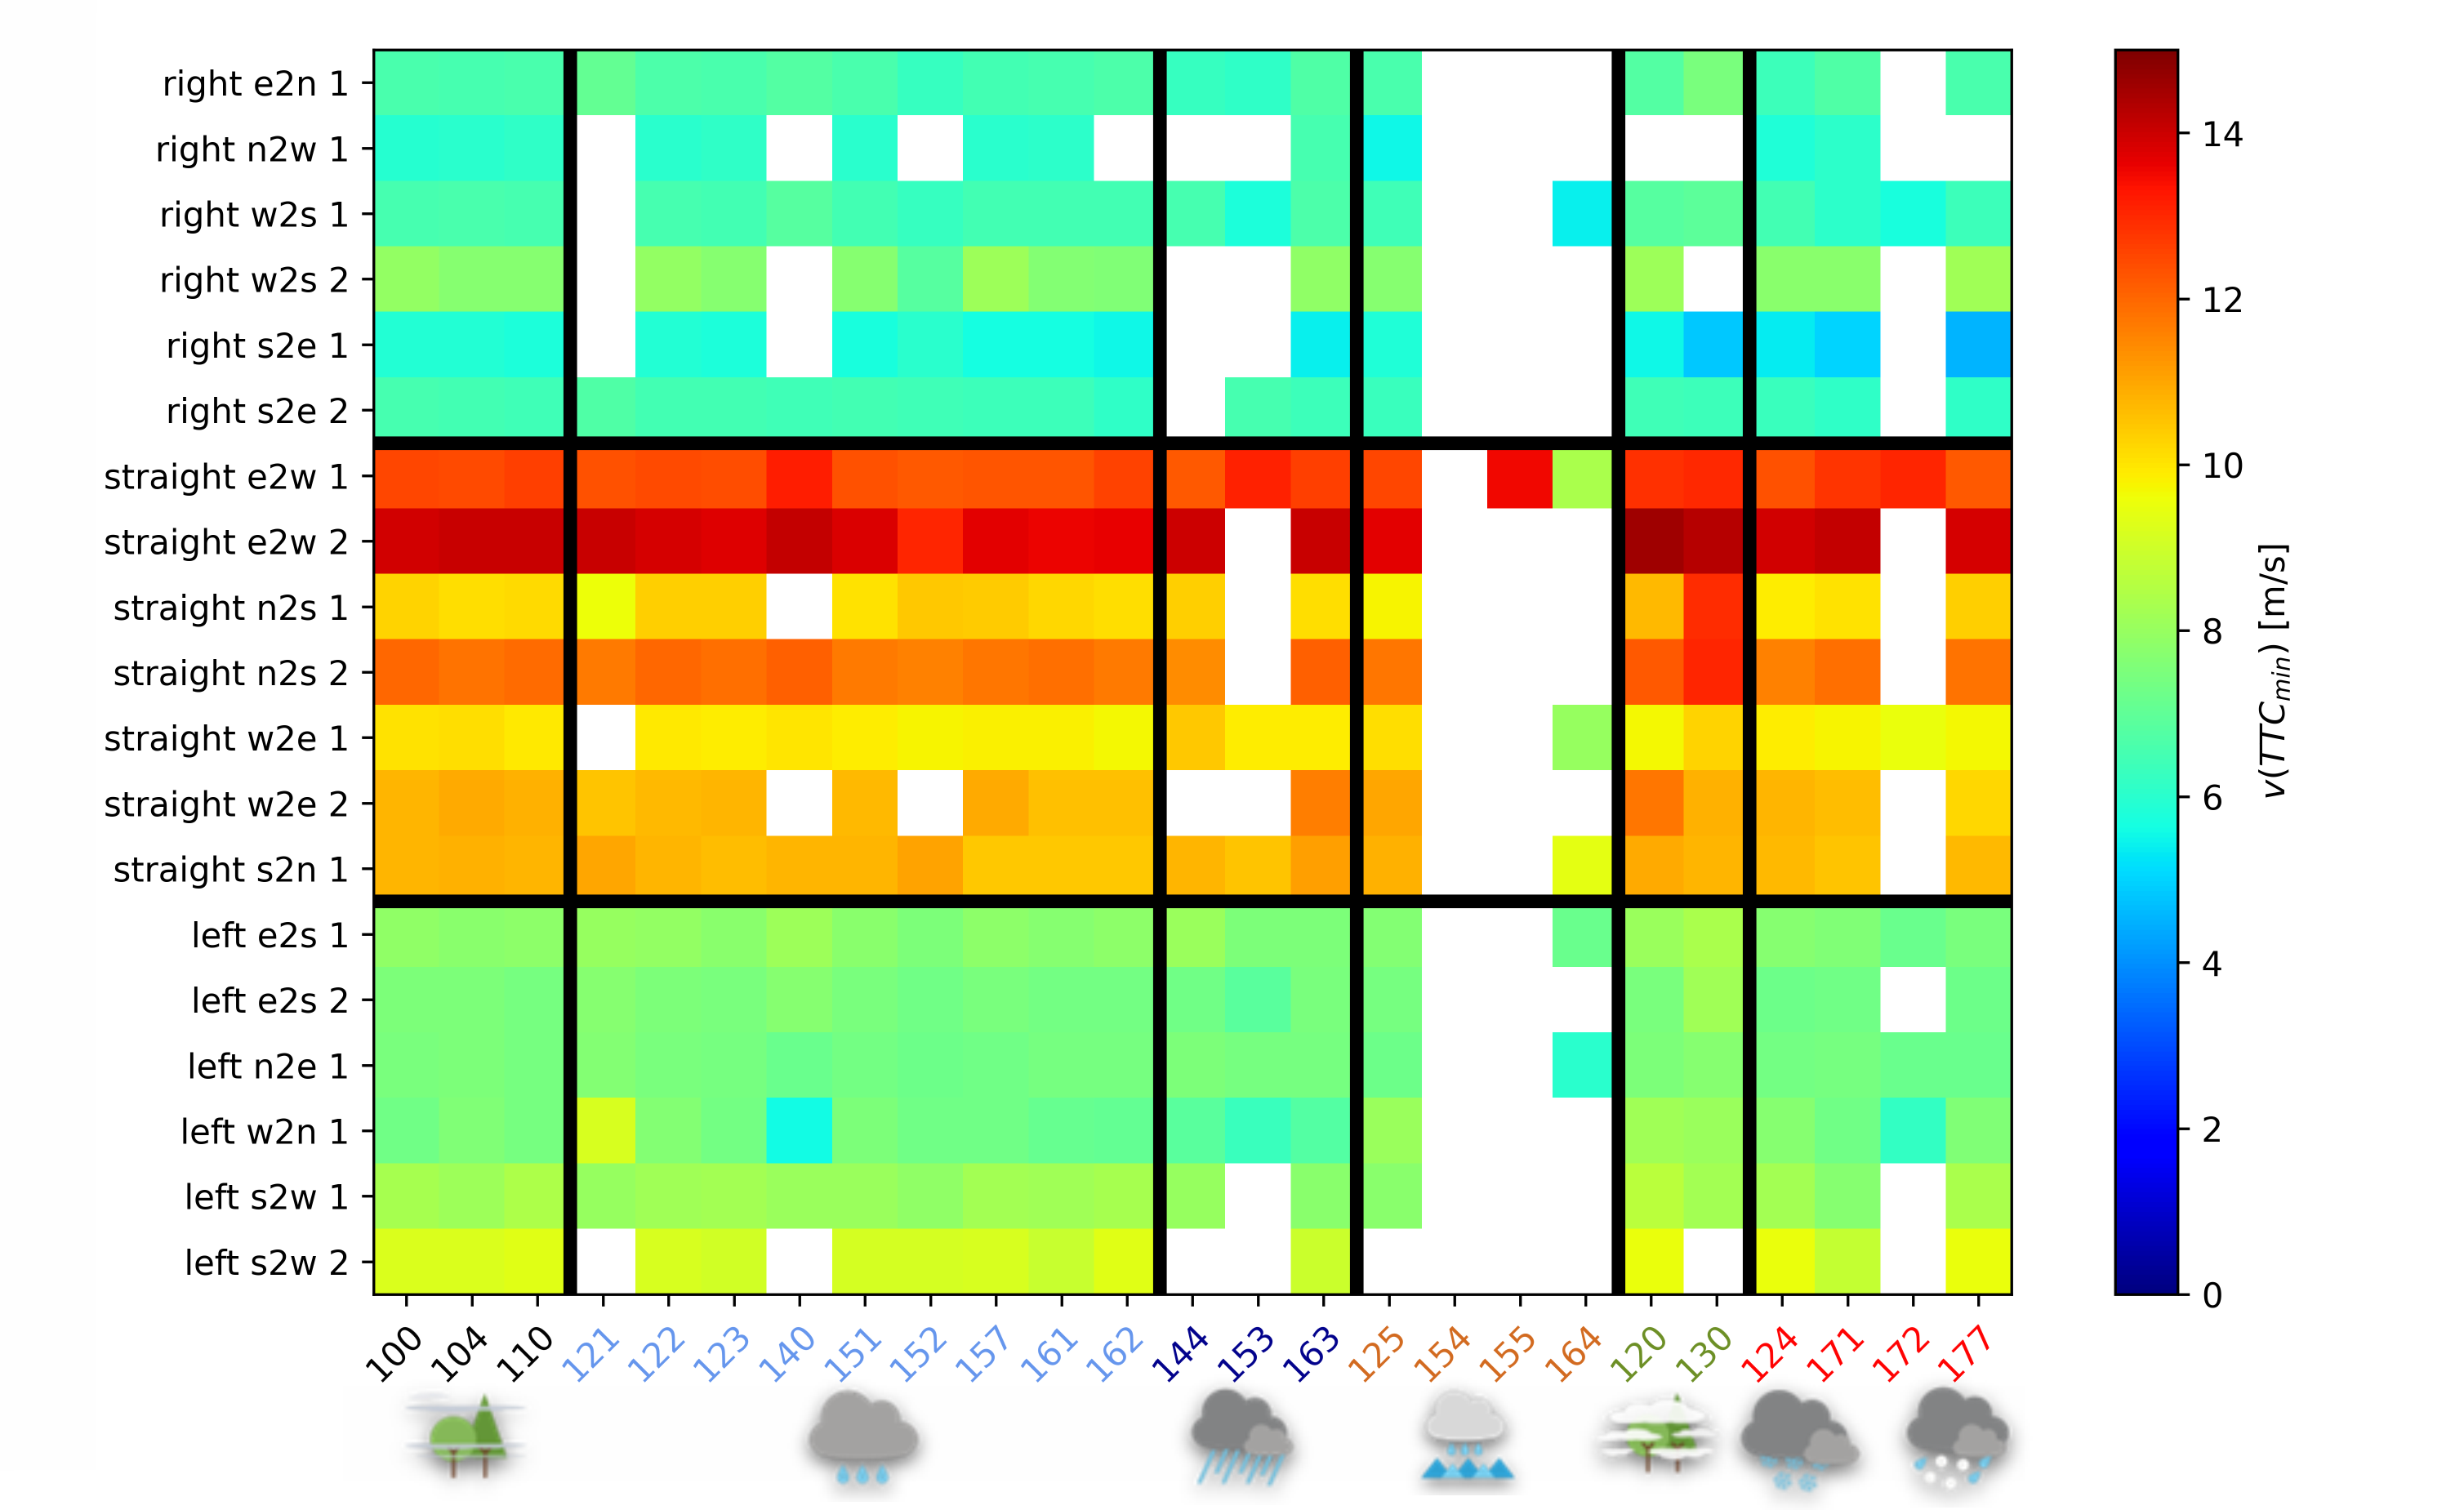
The highest speeds appeared for driving straight (i.e. v(TTCmin) = 8.0 m/s–13.5 m/s)—particularly from east to west, whereas in right-turns and left-turns, systematically lower speeds could be found (i.e. v(TTCmin) = 4.6 m/s–8.2 m/s and v(TTCmin) = 5.6 m/s–9.5 m/s, respectively). Geometric characteristics of the road design also led to differences in speed, for instance, driving in the outer lanes (larger curve radii) was usually faster than in the inner ones (smaller curve radii) except in case of the left-turn from south to west. Weather, however, influenced speed. Particularly foggy and ‘after fog’ conditions (types 130 and 120, respectively) led to higher speeds when driving straight or turning left, which can be explained by fog present in the early morning hours at low traffic volumes. However, specific weather such as moderate or heavy rainfall (type 144), light freezing rain (164), and light snowfall (171) led to the lowest speeds. Eventually, it can be stated that rainfall in general led to a slight decrease of speed, although exceptions occurred.
In Figure 6 the medians of acceleration in the moment of closest proximity (TTCmin) are shown. The analysis of acceleration in this moment appeared to be comparable for all 19 traffic manoeuvres, but noisier. However, in terms of lowest acceleration, differences appeared. In case of right-turns the smallest median values were amin(TTCmin) = −0.5 m/s², while for left-turns an amin(TTCmin) = −1.0 m/s² was found indicating stronger decelerations. In case of the unprotected left-turn, indications for accelerations occurred with median values amin(TTCmin) = 0.6 m/s². For straight manoeuvres minimum median acceleration values were slightly larger than for right- or left-turns with amin(TTCmin) = −0.2 m/s². All in all, it can be stated that accelerations were fluctuating mostly independently on weather—although exceptions existed, and drivers either tended to increase or decrease speeds. The results appeared to be inconsistent in specific weather such as rainfall (type 140), heavy rain (types 144, 163), and ‘after fog’ (type 120).
KS-test
The results for kinematic profiles and TTCmin obtained were KS-tested to find significant differences against ‘normal’ weather (type 100). Significant differences in the moment of closest spatio-temporal proximity mainly appeared for speed in case of rainfall, ‘after rainfall’, snowfall, fog and ‘after fog’ conditions over mostly all manoeuvres. The results of the KS-tests for the distributions of TTCmin, v(TTCmin), and a(TTCmin) mostly did not show similarities, which had not been expected, and—as a consequence—led to the assumption that the facets of driving behaviour are very dynamic and have to be taken into account to quantify CF behaviour. To unveil the influence of weather independently of the traffic manoeuvre, the data was integrated over the manoeuvre type according to equation (2), which is presented in section 4.2. Since the KS-test results did not substantially contribute to the findings, they are not shown in this paper.
4.2 Overall weather influence on CF
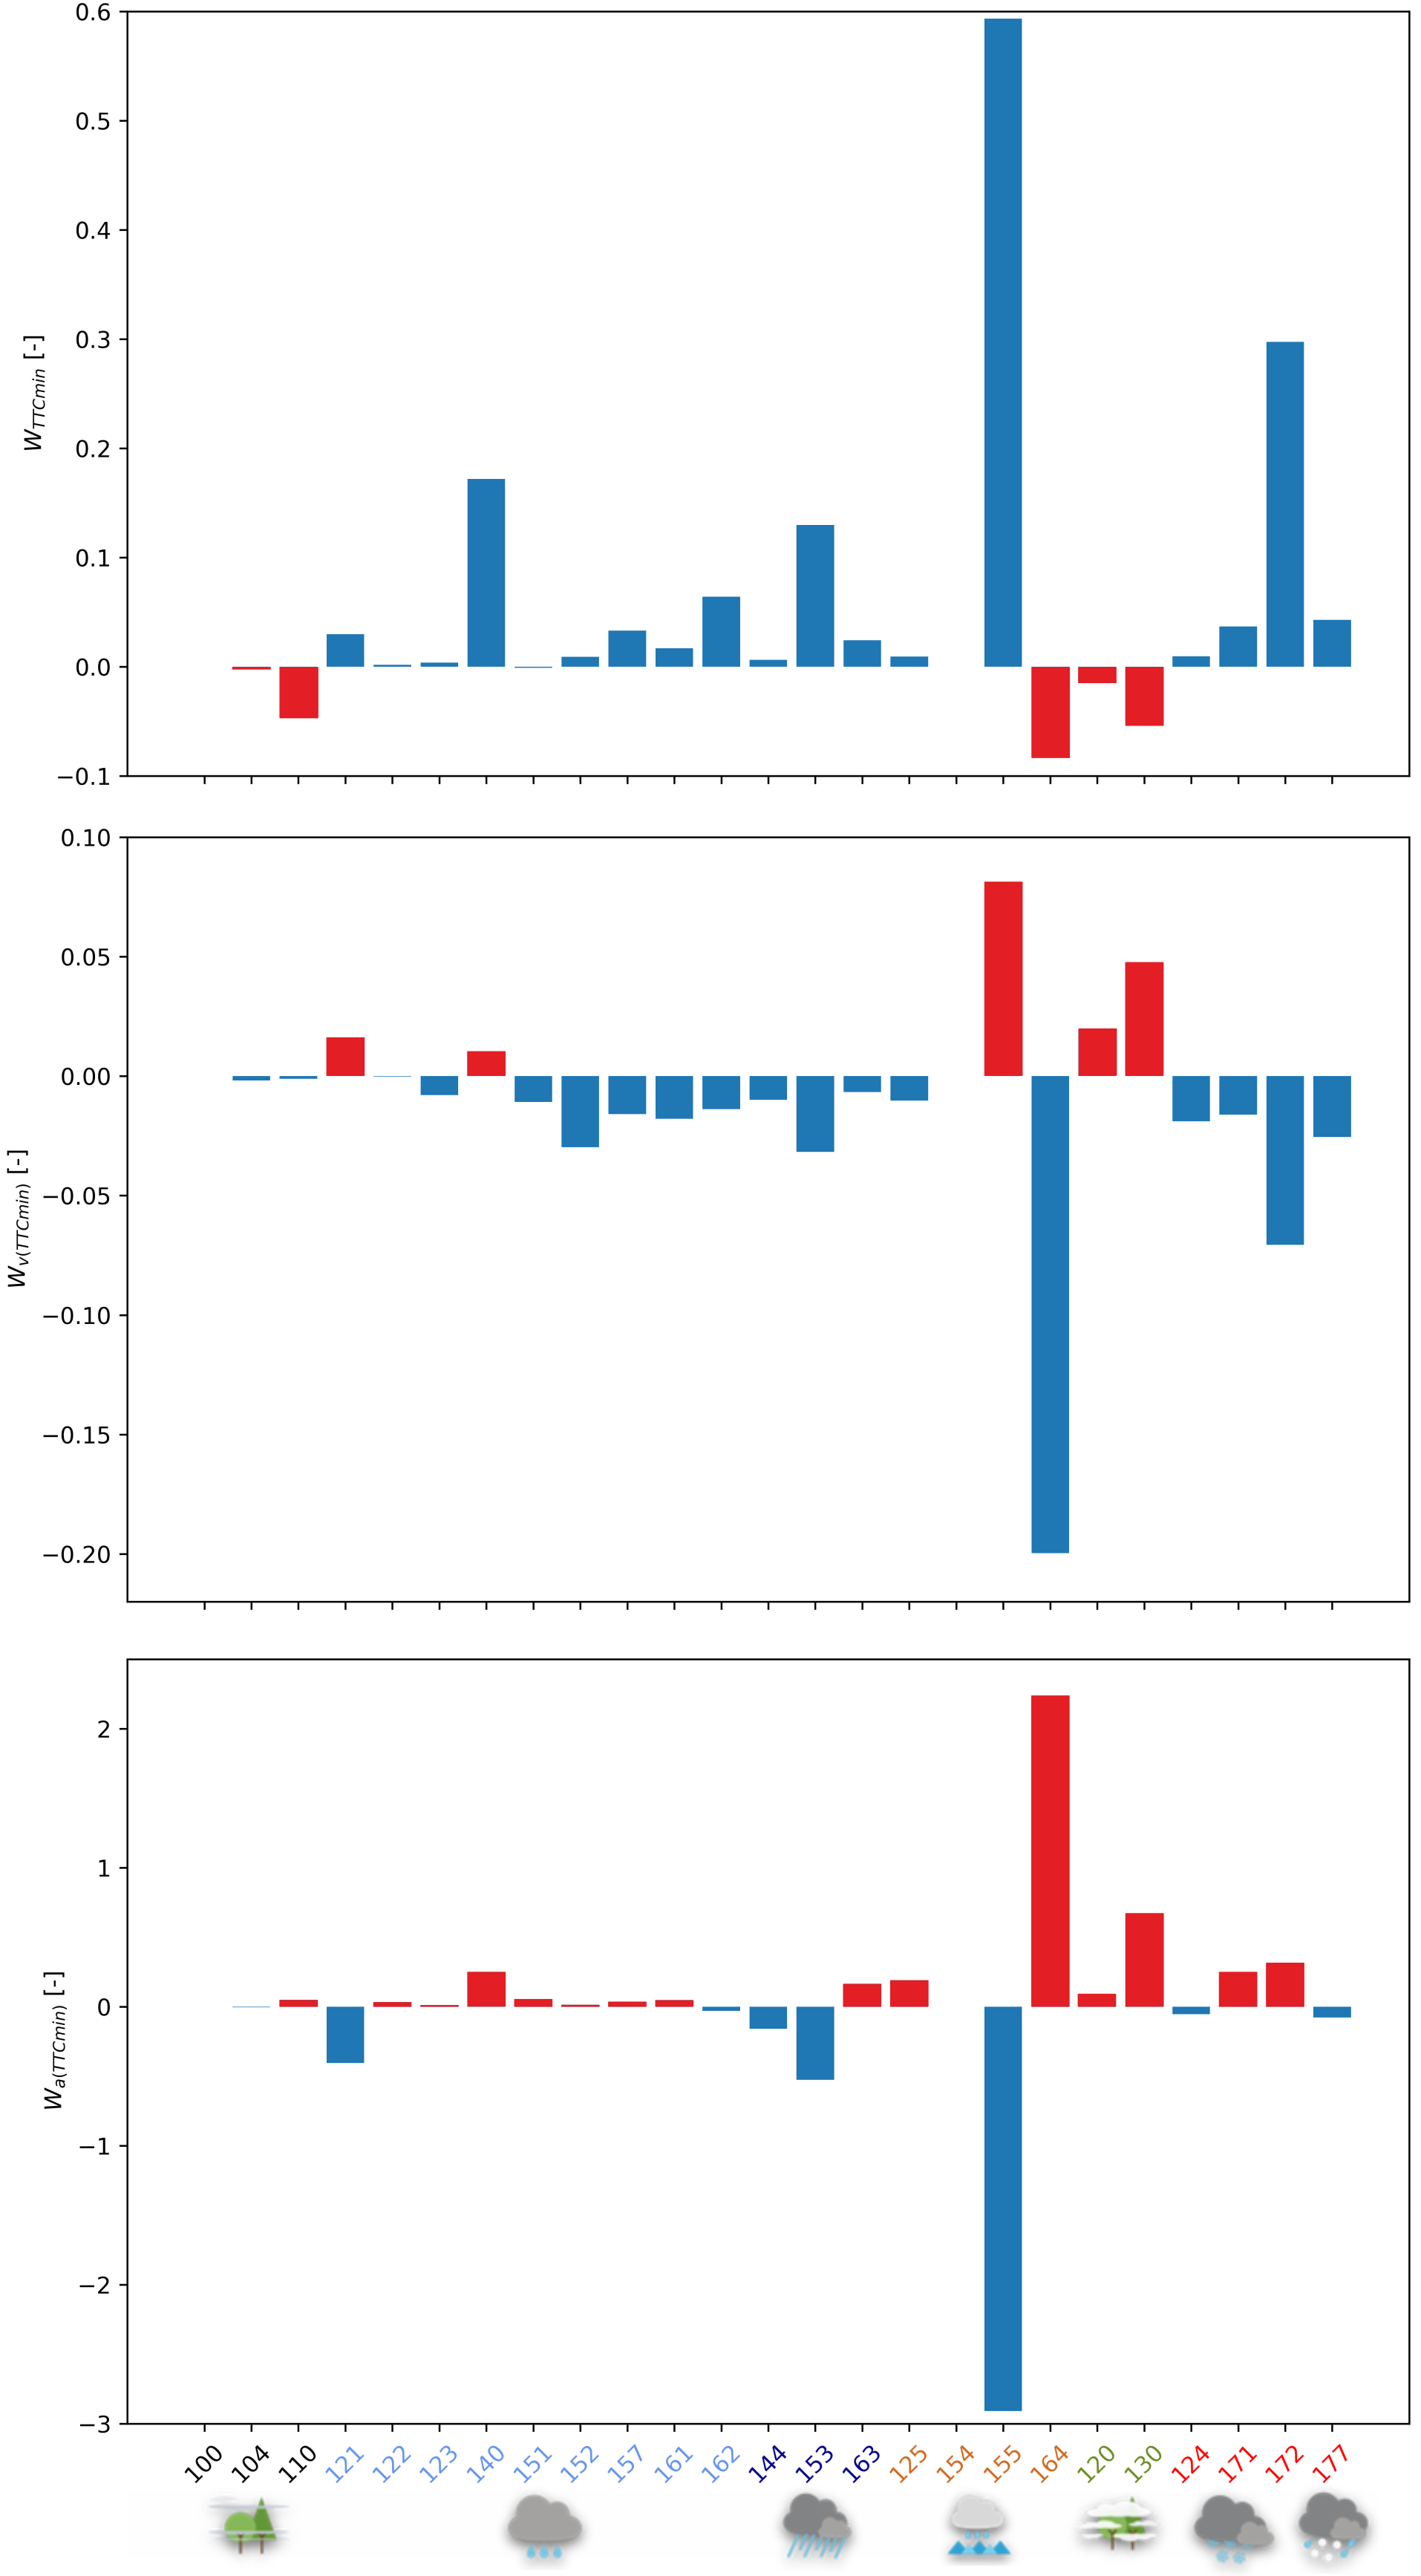
Although significant influences of certain weather conditions were identified, the overall weather influence regardless of the traffic manoeuvres was quantified. Applying equation (1) and marginalising the traffic manoeuvres according to equation (2) led to the results shown in Figure 7. There, the increase in safety is shown by blue bars, while the decrease in red bars.
In Figure 7 (top row), the influence on TTCmin, represented by its weight WTTCmin, is shown. Note that an increase of WTTCmin indicates an increase of safety (i.e. higher TTC), while a decrease of WTTCmin indicates a decrease in safety (i.e. lower TTC). In all rainfall and snowfall situations, WTTCmin increased resulting in ‘safer’ driving behaviour (note that the peak for type 155 (moderate freezing spray rain) is due to the fact that only traffic manoeuvre ‘straight e2w 1’ contributed). Apparently, in most weather conditions the drivers adapted to the weather by increasing their spatio-temporal distances and speeds, although exceptions occurred. Consequently, but not visualised, the weights WTTCmin affected TTCmin values for the whole intersection if compared against the baseline (type 100). For instance, in case of rainfall (type 140), heavy spray rain (type 153), moderate snowfall (type 172), TTCmin values increased by approximately 2.5 s, 0.9 s, and again 0.9 s, respectively. In contrast, a decrease of TTCmin occurred for instance for weather types 110 (wet haze), 164 (light freezing rain), and 130 (fog) by 0.5 s, 0.8 s, and 0.3 s, respectively.
Supporting results are shown in Figure 7 (middle row), in which the influence of weather is presented for speed in the moment of TTCmin, characterised by weight Wv(TTCmin). Note that its scale (ordinate) is much lower than in case of TTCmin. Almost all rainfall, snowfall, and freezing rain conditions, except rainfall (type 140), ‘after rainfall’ (type 121) and moderate freezing spray rain (type 155) resulted in a decrease of Wv(TTCmin) leading to ‘safer’ CF behaviour. Particularly, fog (type 130) and ‘after fog’ (type 120) contributed to higher speeds, which could be explained as fog occurred in the morning hours at low traffic volumes. Note that in case of type 155 only one traffic manoeuvre contributed to the results. The consequence of applying the weights Wv(TTCmin) led to changes of speeds of the entire intersection (not visualised). For instance, in case of weather types 130 (fog), and 120 (‘after fog’) speeds increased by approximately 0.6 m/s and 0.3 m/s, respectively. In case of weather types 152 (moderate spray rain), 164 (light freezing rain), and 172 (moderate snowfall), speeds decreased by 0.6 m/s, 2.2 m/s, and 1.1 m/s, respectively.
Mostly inconsistent with the previous results are the results of acceleration in the moment of TTCmin, which are shown in Figure 7 (bottom row). Although it cannot clearly be stated whether an increase or decrease of acceleration contributed to safer or less safe driving behaviour, it was decided that an increase of Wa(TTCmin) (red bars) led to less safe CF as increasing accelerations increase speeds; a decrease of Wa(TTCmin) (blue bars) contributed to safer CF. Only a few weather types led to a decrease of acceleration, while the remaining ones led to increased accelerations. For instance, fog (type 130) and ‘after fog’ (type 120) as well as rainfall (type 140) appeared to be consistent as these acceleration values changed with the change of speed. Particular contradictory results were obtained for light freezing rain (type 164), which led to a strong increase of acceleration although speeds were lower. In contrast, moderate freezing rain (type 155) resulted in a strong decrease of acceleration, although speeds were higher. The reason for this might be that the drivers with lower speeds tended to accelerate in the moment of TTCmin and vice-versa. However, the results must be considered carefully as for weather type 155 sufficient data for just one traffic manoeuvre was available, while for the remaining manoeuvres were not. Consequently, the weights Wa(TTCmin) changed acceleration values in the moment of TTCmin of all traffic manoeuvres (not visualised). For instance, they decreased for weather types 121 (‘after rain’), and 153 (heavy spray rain) by approximately 0.05 m/s² and 0.11 m/s², respectively, while the values increased in for types 130 (fog), and 172 (moderate snowfall) by 0.07 m/s² and 0.12 m/s², respectively.
5. Discussion, conclusions & future prospects
The objective of this study was to quantify the influence of different weather conditions on aspects on driving behaviour. In this section the results presented in the previous section with regard to the research question, whether and how drivers adapt to specific weather conditions in CF are discussed. For this purpose, almost eight months (January – September 2019 excluding April) of road user trajectories of 19 traffic manoeuvres at an urban intersection and 25 different types of weather were analysed. From the road user trajectories, TTCmin was computed to characterise the closest spatio-temporal proximity in CF and the kinematic variables speed and acceleration to characterise how road users adapted in this certain moment. Additionally, to quantify on how much weather affects driving behaviour without taking into account the traffic manoeuvres at this intersection, the traffic manoeuvre-independent weather influence was computed.
The missing April 2019 may raise questions regarding seasonal bias as it is known in Germany to be a transition from cold and winter to dry and hot summer characterised by changing weather conditions. Typically, April is characterised by lower but rising temperatures and more precipitation. Therefore, road users should expect almost the whole spectrum of weather types presented in this research. However, road users might be surprised in case of changing weather, which can lead to an increase of the number and severity of accidents and critical situations. Precipitation in Braunschweig averaged around 26.8 l/m² (9 days rainfall with 2 days > 5.0 l/m², 3 frost days) in April 2019 (Wetterkontor, 2019b), which was similar to May 2019 with 25.1 l/m² (12 days rainfall with 3 days > 5.0 l/m², no frost days) (Wetterkontor, 2019c) and less than half of the rainfall compared to March 2019 with 57.6 l/m² (20 days rainfall with 2 days > 5.0 l/m² and 1 day > 10.0 l/m², 2 frost days) (Wetterkontor, 2019a). These values show that March, in comparison to April 2019, was characterised by far more rainfall, but with similar numbers of rainy days and frost days. Compared to other years, April 2019 was somewhat drier. Although the quantification of the transition from winter to summer should provide input relevant for such an investigation, March 2019 is expected to be representative, and missing April should not lead to seasonal bias.
The results presented in section 4 showed that weather did influence driving behaviour at this urban intersection quite differently, and some of these effects appeared to be significant. Actual critical road user behaviour could not be observed due to weather except the fact that specific weather affected specific traffic manoeuvres at specific locations of the intersection. The reasons for this might be specific infrastructure a/o geometric designs (e.g. curve radii) or even deficits (e.g. puddles filled with water). However, it was observed that in most cases adverse weather such as rain- and snowfall led to an increase of spatio-temporal distances as well as to a decrease in speed, although exceptions and inconsistencies occurred (e.g. freezing rain, fog). This indicates that drivers adapted to the weather conditions by increasing their TTC margin and decreasing their speeds leading to safe driving behaviour in certain weather conditions maintaining safe road user interaction. Note, that this adaptation does not mean that they actually drove safer, as they still may fall victim to the ‘speed not appropriate’ verdict—it cannot be judged from these data what a truly safe behaviour would have been. But it was also found that driving behaviour depended much more on the traffic manoeuvre than on weather, which led to characteristic patterns of TTC, speed, and acceleration for straight driving, turning right or left. When driving straight, drivers adapted to the speed limits leading to the highest speeds and TTC values, and in case of turning right or left, drivers adapted to their comfort and curve radii, resulting in lower speeds and TTC values. One exception was the unprotected left-turn from west to north, which significantly differed from all remaining protected left-turns (and also from right-turns and straight driving) with lowest TTC values—sometimes the average was below the accepted threshold of 1.5 s–2 s—and largest acceleration values—mostly independently on weather—, which made it the most critical manoeuvre at this intersection. Due to the riskiness of this manoeuvre (e.g. NHTSA, 2010; EC, 2024), lower TTC values were expected, but not on this scale. Interestingly, speed values remained similar to protected left-turns. But these low TTC values could indicate drivers’ response to adapting to oncoming traffic from east to west by following leading vehicles with small distances and leaving the conflict area quickly.
But what do these results mean regarding the riskiness of driving behaviour in specific weather, traffic manoeuvres, road infrastructure, and the development and maturing of ADFs? It can be stated that this non-crash data showed that road users adapted to (adverse) weather to maintain safe driving (e.g. larger TTC values, lower speeds) in CF. Additionally, road users adapted to the geometric design of the road infrastructure (e.g. they chose their speeds taking into account the curve radii), driving comfort, and speed limit. Consequently, the geometry of the junctions had a larger influence on driving behaviour than weather. However, due to the obtained differences for specific manoeuvres at certain arms of the intersection, the results may point to deficits in the infrastructure (e.g. puddles that may have ‘forced’ road users to drive around them) or to other influencing factors such as visibility and initiate safety reviews of this intersection. Although the results did not show a significant negative effect on road safety, they can be relevant for the development of ADF, particularly in terms of maturing, as it was shown that TTCmin values could increase/decrease by a few seconds depending on weather. As stated at the beginning of this article, such systems must work perfectly under any circumstances and avoid crashes or mitigate their outcomes. The results clearly emphasise the need of the detection of such conditions. For instance, an ADF should be aware of the vehicle’s manoeuvre, and its surrounding conditions to either intervene or assist the driver to slow down, or maintain larger distance to the vehicle ahead as human drivers do, if necessary, or to switch to the safe state (e.g. by stopping the car close to the pavement). This could mean that ADF algorithms should consider safe human driving behaviour taking into account the surrounding conditions, and traffic manoeuvres and provide safe and efficient driving. This could require an adaption of safety thresholds (e.g. an extension of NHTSA’s safe headway recommendation rule of 3 s to some larger value, an increase of TTC threshold from 1.5 s–2 s by approximately 1 s up to 3 s or even higher) in case of, for instance, freezing rain, or fog; foggy weather appeared to increase speeds in the morning hours, which can contribute to less safe driving, etc. This could lead to speed limit adaption in adverse weather, as it was shown that, for instance, speed decreased by 2.2 m/s in case of light freezing rain. The adaption of speed limits or TTC thresholds could also mean that automated vehicles could be restricted, for instance, to turn left in certain adverse conditions, which follows the example of UPS drivers who were encouraged to avoid left-turns due to its riskiness and the increased waiting time to cross incoming traffic (e.g. Kendall, 2017; Prisco, 2017).
The results obtained have to be considered with caution (particularly for some of the rare weather types) due to challenging data processing during unfavourable lighting and weather conditions. Although no explicit detection problems could be identified, the authors are aware of such effects that occurred in preceding investigations. In addition, due to the fact that the weather station was located 6.3 km away from the urban intersection, some observed weather phenomena could not be found in the recorded video data as they may not match the intersection’s microclimate. The possible misclassification of weather could have led to misinterpreted road user behaviour, and thus to underestimated or overestimated weather effects. Also, some of the weather types in Table 1 appeared to be redundant, and their differencing meaning was not really clear (e.g. several types for different types of rain, rainfall, freezing rain, spray rain, freezing spray rain). As a consequence, the results could have led to wrong conclusions about how weather affected CF and road user kinematics, particularly for the rare weather conditions. Additionally, the use of TTCmin for quantifying the minimum spatio-temporal closeness in CF led to rather noisy results with large variance, which was also due to the fact that TTC’s codomain may spread from zero to theoretically infinity (if the following vehicle drives with the same speed the leading one). Additionally, the outcomes for TTCmin appeared to support the opposite effect for some weather types when using the mean operator instead of the median. Also, very large TTC values may have had a substantial influence on TTC’s probability distribution leading to misinterpreted influences of weather. For that reason, the authors suggest to repeat such non-crash studies with more suitable SMoS with a limited codomain such as, for instance, probability-based a/o crash severity-based metrics (e.g. RECP proposed by Behbahani et al. (2014), or RCRI proposed by Shangguan et al. (2021)) or Gipps-Krauss metric proposed by Wagner et al. (2020).
This work led to some open questions, which will be addressed in our future work. Besides the obvious differences between protected and unprotected left-turns, which should be analysed at intersections with other crossing characteristics (e.g. different geometries and topographies), it is not yet clear why the results for acceleration and speed contradicted to some extent. This also includes to unveil the reasons for some of the specific differences of weather influences at certain areas of this intersection, although happening in the same traffic manoeuvres. Furthermore, the analysis should incorporate more data for a longer period—a whole year should cover all weather types—to have enough data available for rare weather types with a sound basis of road user trajectories. To compare the results, the analysis should also be repeated at other traffic areas with more suitable SMoS.
CRediT contribution
Marek Junghans: Conceptualization, Data curation, Formal analysis, Investigation, Methodology, Software, Visualization, Writing – original draft, Writing – review & editing. Claudia Leschik: Conceptualization, Data curation, Methodology, Resources, Visualization, Writing – review & editing. Clemens Schicktanz: Writing – review & editing. Peter Wagner: Conceptualization, Formal analysis, Methodology, Supervision, Writing – review & editing.
Declaration of competing interests
The authors report no competing interests.
Declaration of generative AI use
During the preparation of this work the authors used ChatGPT-4o (link) to revise individual sentences of the manuscript to British English. The output was reviewed and revised by the authors who take full responsibility for the content of the publication. The literature search was conducted on Web of Science databases and supported by Perplexity v3.2 (link). The use of Perplexity with similar key words led to references that could not easily nor not at all be found with Web of Science databases (e.g. Gorzelanczyk, 2025; Sullivan et al., 2025; Abdel Madjid et al., 2026).
Prior dissemination declaration
An earlier version of this work was presented at the 37th ICTCT conference, held in Berlin, Germany, on 23–24 October 2025.
Ethics statement
This study did not require formal ethical approval, as it utilised GDPR-compliant data, which did not include any personally identifiable information or sensitive content. All research activities adhered to ethical standards for the use of this data. DLR in general is committed to the ‘Guidelines for Safeguarding Good Research Practice’ of the DFG, Deutsche Forschungsgemeinschaft (German Research Foundation).
Funding statement
No external funding was used in this research.
Data availability statement
The data are available on request to the authors.
Code availability statement
The code is available on request to the authors.
Editorial information
Handling editor: Aliaksei Laureshyn, Lund University, Sweden.
Reviewer: Dimitrios Nikolaou, National Technical University of Athens, Greece.
Submitted: 31 March 2026; Accepted: 26 June 2026; Published: 3 July 2026.