Dangerous ground or peaceful coexistence? Analysing cycling behaviour adaption on shared paths using crowdsourced GPS cycling data
Abstract
Walking and cycling are increasingly promoted as sustainable and health-enhancing modes, yet rising volumes in shared urban spaces intensify interactions and perceived conflict potential. While numerous studies show that pedestrian–cyclist interactions rarely result in safety-critical incidents, behavioural adaptations, such as speed reduction and crash avoiding manoeuvres, plays a key role in mitigating risk and increasing perceived safety. As most existing research relies on data-intensive methods such as video observations or simulations, this paper explores the potential of large-scale GPS cycling data to analyse conflict potential and behavioural adaptation in areas shared spaces used by pedestrians and cyclists. Considering the pedestrian zone ‘Prague Street’ in Dresden, Germany, as a case study, we combine GPS trajectories from the 2024th CITY CYCLING campaign with a time-based proxy data for pedestrian density. The results show clear behavioural adaptation: during periods of high pedestrian activity, cyclist do not only use other routes, but cycling volumes decrease and average speeds are reduced by approximately 5–8 km/h. The findings confirm established relationships between density, speed, and conflict mitigation, while highlighting both the opportunities and limitations of GPS based approaches. The study demonstrates that such data can serve as a scalable screening tool for assessing behavioural adaptation and potential risk in shared spaces. We further propose a model considering most relevant data to comprehensively analyse risk potential in near future.
1. Introduction
The transport sector is associated with significant negative impacts on people and the environment. In addition to greenhouse gas emissions, air pollutants, and noise exposure, transport also affects quality of life, public health, and social participation in urban areas. Against this background, active modes of mobility are gaining increasing importance, as they have the potential to make a substantial contribution to reducing these negative effects. Promoting active mobility has therefore become a central pillar of transport policy (Hynes & Gelbart 2025).
Active mobility primarily includes walking and cycling. Compared to motorized modes, they are considered health-promoting, cost-efficient, space-saving, and socially inclusive (Cavill et al. 2008, Mueller et al. 2015). Accordingly, many countries, including Germany, have seen a growing relevance of these modes in recent years and launched funding programs to promote cycling (Küster 2025). Current trends indicate an increasing importance of cycling in the modal split, particularly in urban areas. From a transport, environmental, and public health perspective, this development is highly desirable (Oja et al. 2011).
At the same time, the growing volume of walking and cycling presents new challenges for transport planning. In particular, where different modes interact within limited space, the potential for conflicts may increase. This is especially true for shared pedestrian and cycling facilities, where pedestrians and cyclists use the same space (Beitel et al. 2018, Gkekas et al. 2020). As usage intensity increases, both the frequency of interactions and the probability of conflicts may rise. From a planning perspective, spatial separation of traffic flows is an effective measure to reduce conflicts. However, complete separation is not feasible everywhere.
This tension becomes particularly evident in pedestrian zones, which are often heavily used by pedestrians while simultaneously being open to cyclists, especially when they are part of attractive route-alternatives in city centres (Liang et al. 2021). Reliable, scientific data on the opening of pedestrian zones for cycling in Germany is scarce, but available evidence points to widespread municipal practices. Furthermore, such areas frequently function as central corridors and key connections within the urban cycling network, making detours or restrictions for cyclists impractical. Practical experience (reports from city authorities corresponding to complaints from citizens) suggests that these zones are perceived as having elevated conflict potential. Studies also consistently show that pedestrians on shared paths often feel unsafe when cyclists pass them at high speeds and with little lateral distance, as these interactions increase perceived risk and discomfort. This effect is particularly pronounced in crowded or narrow environments, where close and fast overtaking manoeuvres reduce overall perceived safety and can discourage walking (see e.g., Kang & Fricker 2016, Hatfield & Prabhakharan 2016, or Gkekas et al. 2020). To implement appropriate measures, cities therefore require reliable information on where conflicts occur and how significant they are.
A substantial body of scientific literature now addresses the analysis and quantification of interactions between pedestrians and cyclists. Most studies examine interactions in shared environments such as shared spaces, encounter zones, or shared paths, using a variety of methodological approaches including video-based observations, computer simulations, surveys, and analyses of crashes and near-crashes.
Several studies consistently show that interactions between pedestrians and cyclists are generally low in conflict and rarely result in safety-critical situations or crashes (e.g., Beitel et al. 2018, Medicus et al. 2023, Marsch 2018). It is important to distinguish between mere interactions and actual conflicts: while many encounters occur without or with only minimal behavioural adjustment, conflicts are characterized by observable reactions such as braking, changing direction, or evasive manoeuvres.
At the microscopic level, Alsaleh & Sayed (2020) demonstrate that cyclists’ behaviour differs systematically depending on whether they are following or overtaking pedestrians. Overtaking manoeuvres are associated with higher speeds, greater speed differentials, stronger acceleration, and larger lateral but smaller longitudinal distances. Collision avoidance is highly context-dependent, with traffic density and available space playing a decisive role. Li et al. (2015) identify different interaction types depending on the Level of Service (LOS): at low service levels, conflicts are more prevalent, whereas at high LOS levels, interactions more often result in delays rather than safety-critical situations. This suggests that although more interactions may occur when space is abundant and densities are lower, they tend to be less critical.
A central finding across many studies is the predominance of evasive manoeuvres as the primary conflict response. Liang et al. (2021) show that more than half of all conflicts are resolved simply by swerving, while accelerating to avoid conflicts is rarely observed. As conflict severity increases, more complex manoeuvres (e.g., combinations of braking and swerving) become more common. The direction of evasion follows consistent patterns, indicating implicit social norms and anticipatory behaviour in shared spaces. Beitel et al. (2018) further demonstrate that cyclists tend to ride more slowly in conflict situations than on average, suggesting that speed regulation contributes to conflict risk reduction.
Overall, the relationship between speed, density, and conflicts is complex but consistent across studies. As pedestrian density increases, cyclists’ speeds decrease (Beitel et al. 2018, Boufous et al. 2018, Dahak et al. 2025), while conflict frequency rises with increasing traffic volumes (Liang et al. 2021). However, high speeds and high conflict densities rarely occur simultaneously. High speeds are mainly observed at low densities, whereas at high densities more conflicts occur but at lower speeds, making them generally less severe. Boufous et al. (2018) show that around 80% of cyclists on shared paths travel at 20 km/h or less and adjust their speed according to pedestrian volumes and environmental conditions. Similar speed reductions depending on situational factors are reported by McNeil et al. (2025).
Furthermore, several experimental and simulation-based studies point to pronounced self-organization in mixed traffic. Guo et al. (2020) observe the spontaneous formation of “functional lanes” in both experiments and simulations, which become more stable as density increases. Traffic management, available space, and infrastructural design influence speeds, flow rates, and comfort levels. Survey-based studies complement these objective findings with user perspectives, showing that both pedestrians and cyclists often feel less safe in shared environments than in segregated facilities (even when objectively few safety-critical situations occur (Marsch 2018, Medicus et al. 2023, Mesimäki & Luoma 2021).
Accident analyses further demonstrate that actual pedestrian–cyclist crashes are rare compared to the number of interactions but structurally resemble observed conflict situations (Schreiber 2013, Medicus et al. 2023). Near-crashes occur much more frequently than crashes and represent an important indicator of potential risk and perceived safety (Mesimäki & Luoma 2021).
In summary, extensive knowledge exists regarding influencing factors, behavioural patterns, and conflict dynamics in pedestrian and cycling traffic. However, established methods of data collection and analysis are associated with considerable effort. Video-based analyses require either time-consuming manual coding or computer vision and AI-based approaches, which may reach their limits at high traffic densities. In addition, significant organizational effort is required for the installation, operation, and approval of data collection infrastructure.
By contrast, GPS data on cycling are now widely available, for example from smartphone- or sensor-based datasets, and can often be accessed without additional data collection costs (Lee & Sener 2020, Lißner & Huber 2021). In Germany, for instance, nationwide GPS cycling data are available from the CITY CYCLING campaign (CITY CYCLING 2025), which could potentially be used to analyse conflict potential and behavioural adaptations. However, it remains largely unclear to what extent such data are suitable for analysing interactions, behavioural adjustments, and potential conflict risks, and which conclusions can reliably be drawn from them.
Against this background, the present paper addresses the research question of how GPS data, in combination with additional data sources, can be used to analyse conflict potential and behavioural adaptations in pedestrian and cycling traffic. To answer this question, we examine these possibilities using a selected case study area. The following chapter presents the study area, the data used, and the applied methods. The results are presented in Section 3 and subsequently discussed in Section 4 in the context of existing research, highlighting perspectives for future developments.
2. Methods
2.1 Study area
Dresden, the capital of the German state of Saxony, is located in eastern Germany along the picturesque Elbe River. The city has a population of approximately 560,000 residents, making it Germany's 12th biggest city. Dresden covers an area of around 328 square kilometres and boasts a well-balanced traffic modal split. Public transport, including trams and buses, plays a key role, complemented by an increasing share of cycling and pedestrian traffic. Cycling accounts for around 16 % of all trips and walking for around 34 % (Hubrich et al. 2025).
The pedestrian zone “Prager Straße” (Prague Street) is located near the Dresden’s city centre. It is marked with a red line on the map (see Figure 1), while the city centre itself is highlighted with a black dashed line.
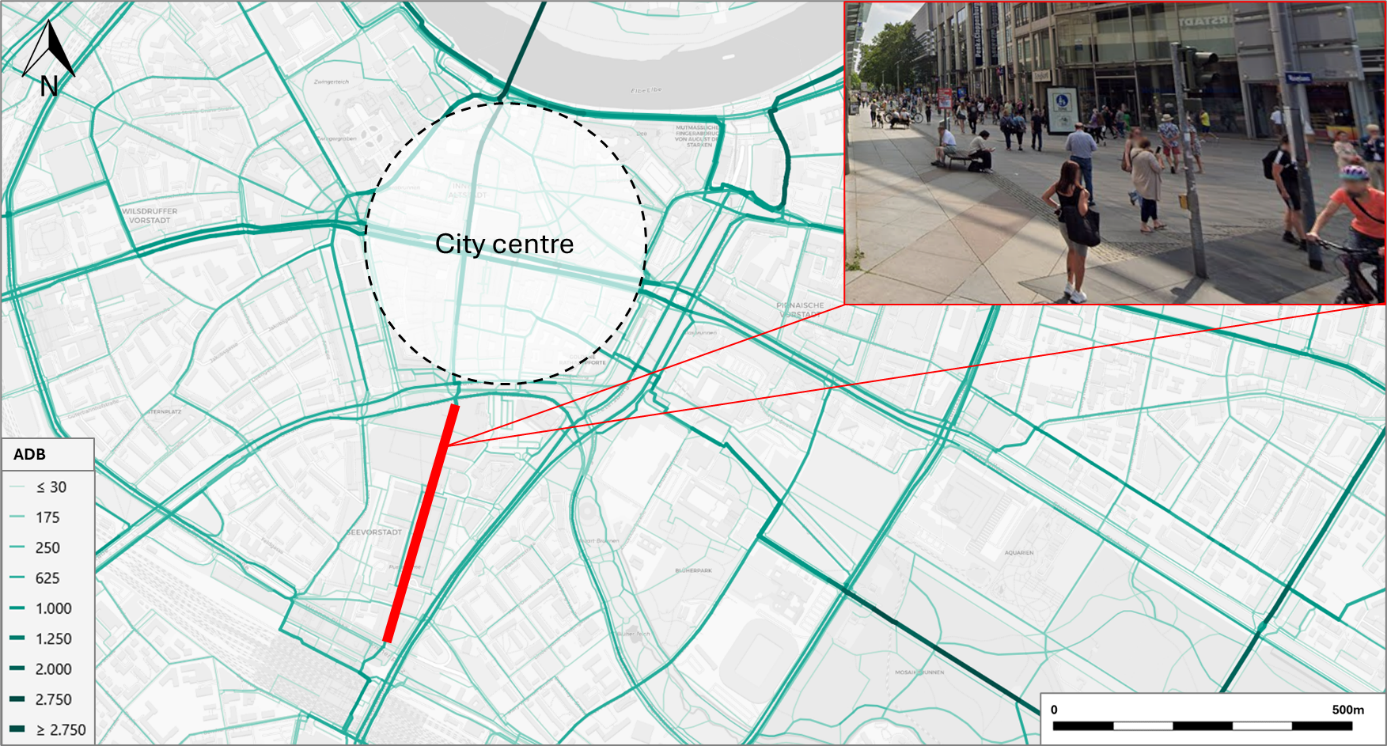
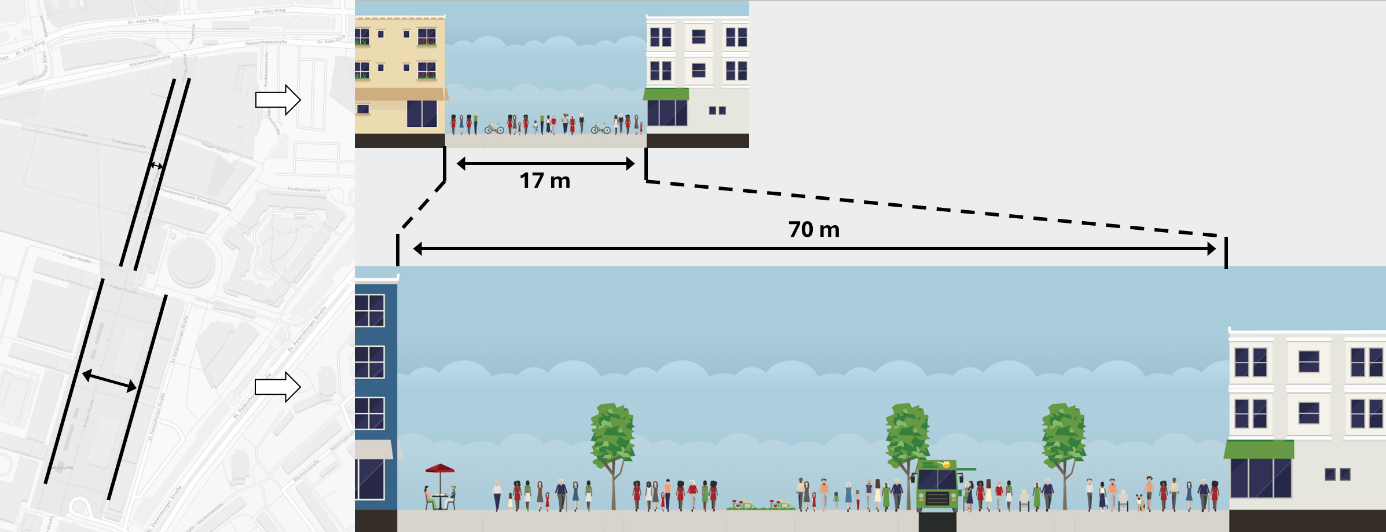
With a width of approximately 70 metres the Prague Street provides generous space for pedestrian movement and urban activity in the southern parts of the pedestrian zone (see schematic illustration of the section in Figure 2). However, the width narrows down to approximately 17 metres in the northern parts. During peak hours, pedestrian volumes reach up to 7,000 persons per hour, underlining its importance as a highly frequented public space. The pedestrian area is designated as a so-called “cycling permitted” zone, which means that cyclists are generally permitted to use the pedestrian zone with walking speeds <10km/h. In practice, this opportunity is widely taken up.
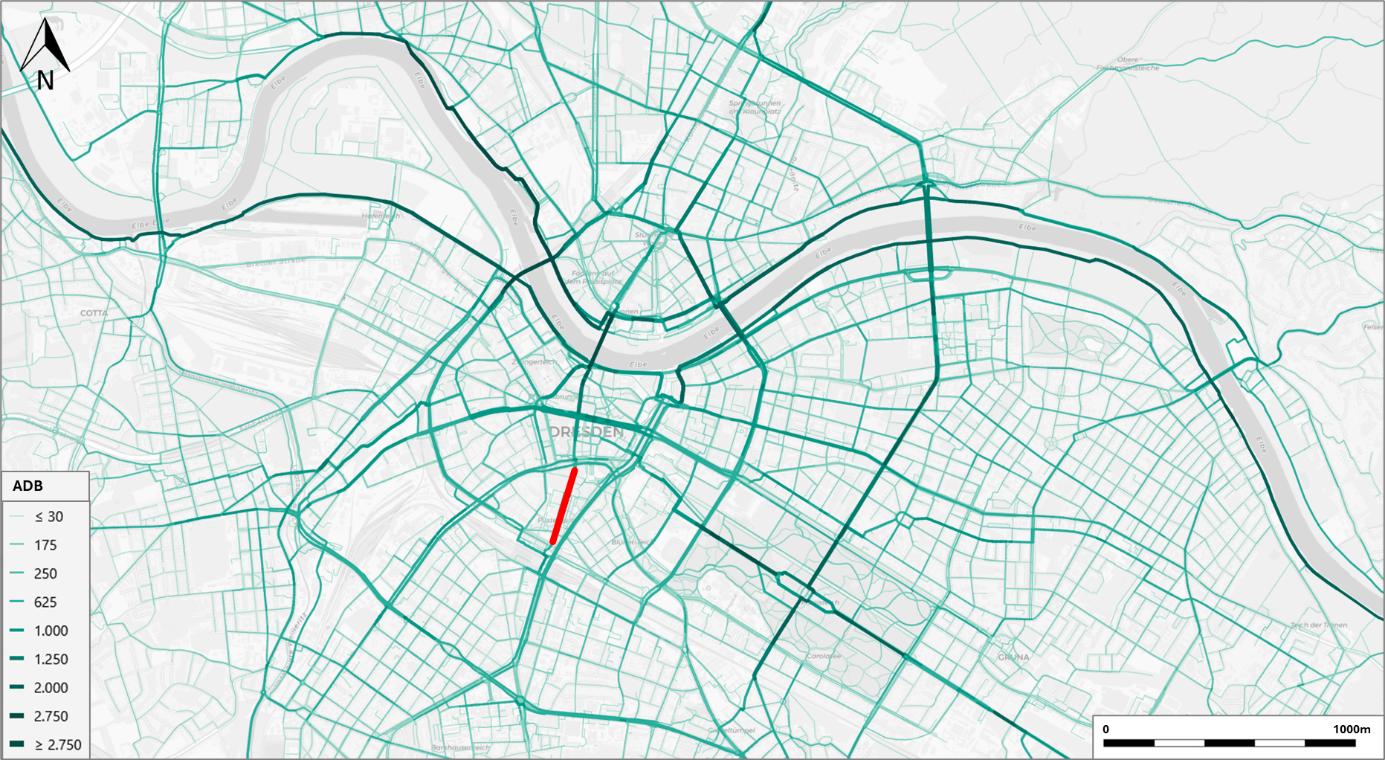
In the broader context of Dresden’s transport network, the pedestrian zone is of particular relevance. The city features major cycling corridors running in both east-west and north-south directions (see the dark green lines in Figure 3). Prague Street serves as an important and frequently used inner-city connection between the northern and southern parts of the city. It represents the southern continuation of the Augustusbrücke (Augustus Bridge), located north of the city centre, which plays a crucial role in the north-south crossing of the Elbe River, which separates the city into two main areas (Old Town and New Town).
Approximately 7,000 cyclists cross this bridge daily, making it the second most heavily used of Dresden’s four inner-city bridges. A substantial share of these cyclists continues their journey through the adjacent pedestrian zone of Prague Street. The average daily cycling volume (ADB) within the pedestrian zone itself amounts to roughly 1,200 cyclists.
Notably, there have been hardly any recorded crashes between pedestrians and cyclists in this area over the past seven years. From an objective road safety perspective, the situation therefore appears largely unproblematic. However, the city has reported concerns regarding perceived safety within the zone. In particular, the combination of very high pedestrian densities and permitted cycling seems to generate subjective feelings of insecurity, even though actual conflict incidents and crashes remain rare.
2.2 Study data
The aim of this study is to identify spatial and temporal changes in cycling behaviour in response to varying pedestrian density. In particular, we analyse whether cyclists adapt their speed, route choice, or movement patterns when pedestrian activity is expected to be high, and how this may relate to potential crashes risk or perceived safety.
To investigate these dynamics, we use data from the nationwide German cycling campaign CITY CYCLING (CITY CYCLING 2025). The empirical basis of this study is the data from the 2024 campaign in Dresden, which took place from 1 May to 30 September 2024. During this period, 3,075 cyclists recorded approximately 66,000 daily trips (GPS tracks) using the CITY CYCLING smartphone application. Previous research has shown that the campaign data can be considered broadly representative for everyday cycling behaviour (Lißner et al. 2026).
As direct data on pedestrian volumes are generally not available, we use shop opening hours on Prague Street as a proxy for pedestrian density. Retail stores in this area are generally open from 10:00 a.m. to 7:00 p.m., which is assumed to correspond to periods of high pedestrian activity. Shops are generally closed on Sundays, but open on Saturdays (which actually is a major day for shopping). Lower pedestrian density is assumed between 8:00 p.m. and 9:00 a.m., when most shops are closed and foot traffic is expected to be reduced.
The cycling data and the time-based proxy for pedestrian density are subsequently combined and analysed to assess behavioural changes and potential implications for perceived safety and risk exposure, as described in the following section.
2.3 Methods
The objective of the GPS data processing was to identify spatial and temporal changes in cycling behaviour as a reaction to varying pedestrian density. To achieve this, a multi-step data preparation and analysis procedure was implemented.
Step 1: Pre-processing and trip segmentation
In a first step, the raw GPS data were pre-processed following the methodology described by Lißner and Huber (2021). This included trip segmentation and mode detection to ensure that only bicycle trips were retained for further analysis. Trip segmentation is based on speed, distance and directional vector of GPS-Points in a 180s sliding window. Mode detection is based on a decision-tree heuristic using different speed percentiles, distances and detour-factors of the trips. Walking trips for example can easily be excluded, when v80 is under 8km/h. Non-cycling movements were excluded to guarantee consistency and validity of the dataset. This processing resulted in both aggregate and disaggregate datasets. At the aggregate level, traffic volumes were calculated. At the disaggregate level, each GPS point contains detailed information, including geographic coordinates (latitude and longitude), speed, heading, and state of movement (continuous movement, acceleration, deceleration, or waiting). Within the data pre-processing and the used sliding window of 180 seconds, a stop is characterized if the max speed is below 0.2m/s. On contrary acceleration is calculated for each GPS point, where acceleration needs ai > 0.2m/s² and deceleration needs ai < - 0.2m/s². For all points in between a constant movement is assumed. This level of detail allows for a fine-grained analysis of behavioural adaptations under different contextual conditions. More detailed information on data processing can be found in Lißner and Huber (2021).
Step 2: Spatial clipping
The processed trajectory data were then spatially clipped to the defined research areas using QGIS. This ensured that only cycling activity within the relevant pedestrian-sensitive zones was considered.
Step 3: Specific data processing in R
Further processing was conducted in RStudio to prepare the dataset for behavioural analysis. Several derived variables and filters were introduced:
-
A categorical variable “day_type” distinguishing between weekdays and weekends.
-
A categorical variable “daytime_type”, differentiating between periods when shops are open (10 a.m. to 7 p.m.) and when shops are closed. This serves as a proxy for pedestrian density.
-
Filtering of movement states to include only observations classified as braking, accelerating, or moving at constant speed.
-
Speed filtering to exclude outliers by removing observations exceeding 35 km/h.
To generate trip-level statistics, trajectories were grouped by trajectory_id, weekday, hour, and daytime_type. Using only observations classified as constant-speed movement, mean speed, median speed, and the 85th percentile speed (p85) were calculated with the summarize function in R. This approach ensures that speed indicators reflect stable riding behaviour rather than transitional acceleration or deceleration phases.
Step 4: Descriptive analysis and contextualization
In the final step, a descriptive statistical analysis was conducted to identify temporal and spatial patterns in cycling behaviour. The results were contextualized using pedestrian density estimates derived from video-based studies conducted in the respective pedestrian areas. This comparison enables an interpretation of cycling behaviour in relation to observed pedestrian activity levels and supports conclusions regarding behavioural adaptation and perceived safety.
3. Results
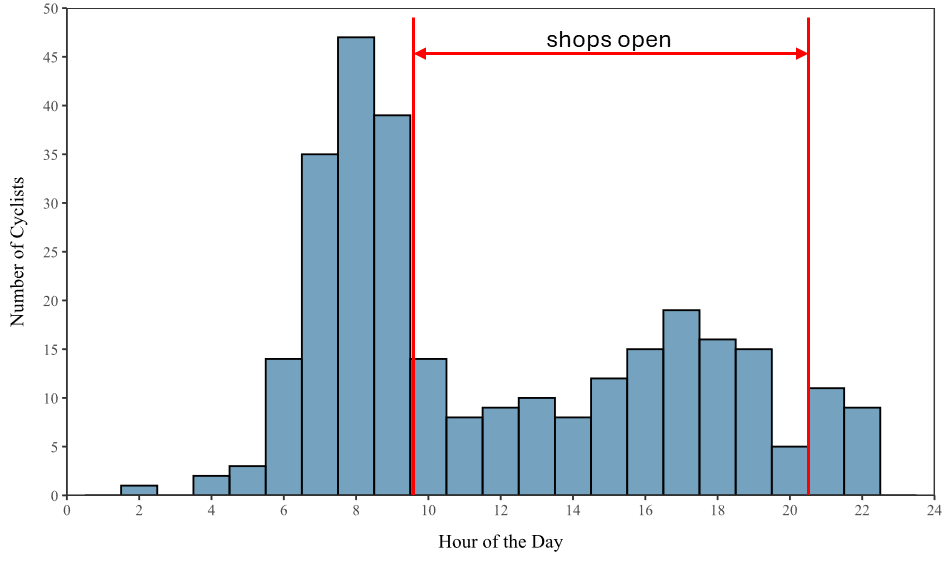
The analysis of the trip data initially yields the following picture. The histogram in Figure 4 illustrates the distribution of 294 bicycle trips recorded within the Prague Street pedestrian zone. A typical daily pattern with a morning peak and a smaller afternoon/evening peak can be observed. Notably, substantially more trips occur in the morning than in the afternoon or evening. Although this general pattern corresponds to the citywide daily distribution of trips, the difference between morning and afternoon volumes is much more pronounced on Prague Street.
While there is a broad distribution of trips throughout the day, this variation is not the reason for fewer trips occurring in the afternoon time slots. The comparison of the numbers indicates that there is less demand in the afternoon (~ 60 % of trips occur before noon, while 40 % occur after noon until midnight). The lower number of afternoon trips along Prague Street cannot be explained by typical end-of-day commuting patterns, where the ratio of outbound and return trips would be expected to balance out (i.e., 50-50). Instead, cyclists appear to use different routes for their return trips from work. Analysis of parallel axes confirms that cyclists frequently divert to the alternative routes of Carola Bridge (east of Prague Street) and Reitbahn Street (west of Prague Street) instead of using Prague Street. The data shows that overall, the cycling flows between north and south are balanced, with nearly identical numbers of trips from north to south and vice versa. Additionally, the distribution between morning and afternoon trips on these alternative routes is balanced (46.6 % of total trips before noon and 53.4 % of trips after noon).
Cyclists clearly prefer alternative routes such as Carola Bridge and Reitbahn Street for their return trips from work, bypassing Prague Street in the afternoon. This behaviour explains the observed discrepancies in trip distribution and provides evidence of a shift in route choice. This suggests an adaptation of traffic flows that might be related to the pedestrian zone and varying pedestrian volumes. Field observations support this interpretation: in the morning hours, pedestrian activity on Prague Street is still low, allowing cyclists to pass through largely unhindered. In contrast, the area becomes very busy in the afternoon. This temporal variation is closely linked to shop opening hours, as most shops on Prague Street are open between 10:00 a.m. and 8:00 p.m.
This hypothesis is further supported by the analysis of cycling speeds. The average cycling speeds on Prague Street are displayed separately for periods when shops are open and when they are closed (see Figure 5). White cells indicate hours without recorded trips, while coloured cells represent the average speed for each hour. Dark blue tones indicate particularly low speeds.
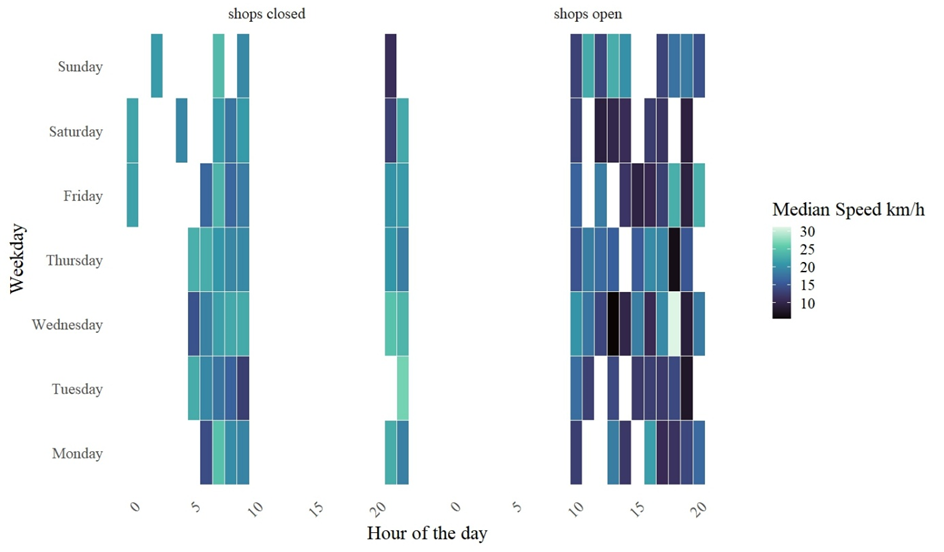
Although there is no data on pedestrian volumes, we assume higher volumes when shops are open. Retail opening hours are a crucial factor in activating pedestrian flows in shopping zones, with robust evidence showing that open shops attract more foot traffic, while closed shops diminish this effect. The relationship, though indirect and context-dependent, is consistently supported across multiple studies (see e.g., Wozniak 2024, Lee et al. 2020, and Schneider & Pande 2012)
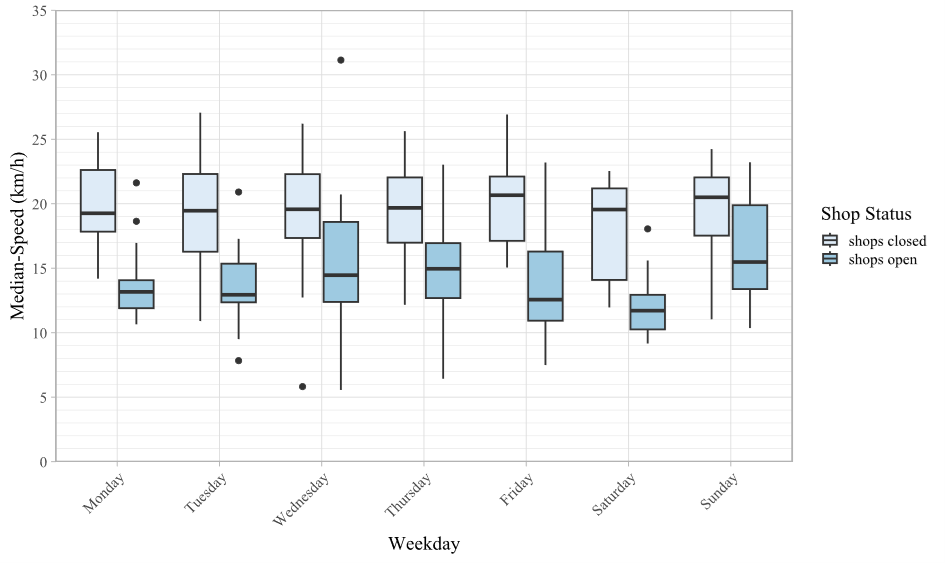
The results show a significant reduction in cycling speeds during shop opening hours. On weekdays, this reduction is especially visible during the afternoon and evening hours. On Saturdays (weekend), low speeds can be observed throughout the entire day. In contrast, during shop closing hours, cyclists travel significantly faster.
Figure 6 visualizes the distribution of average cycling speeds during shop opening and closing times across weekdays. The pattern is clear: cyclists generally ride faster when shops are closed. During opening hours, average speeds decrease substantially – by approximately 5-8 km/h. To reason speed reduction further data and analysis is needed. However, we do not assume that cyclists lower their traveling speed to an average of 12-15 km/h, for instance, to look into shop windows while riding, as doing so would increase crash risks, especially with pedestrians around. Even pushing their bikes while looking into shops can be excluded due to the specific methodology (pre-processing of GPS data) used (see Lißner & Huber 2021).
As the reduction in speed lowers the differential speed between cyclists and pedestrians, which likely reduces conflict potential and increases perceived safety, the findings may indicate a behavioural adaptation of cyclists in response to higher pedestrian volumes on Prague Street.
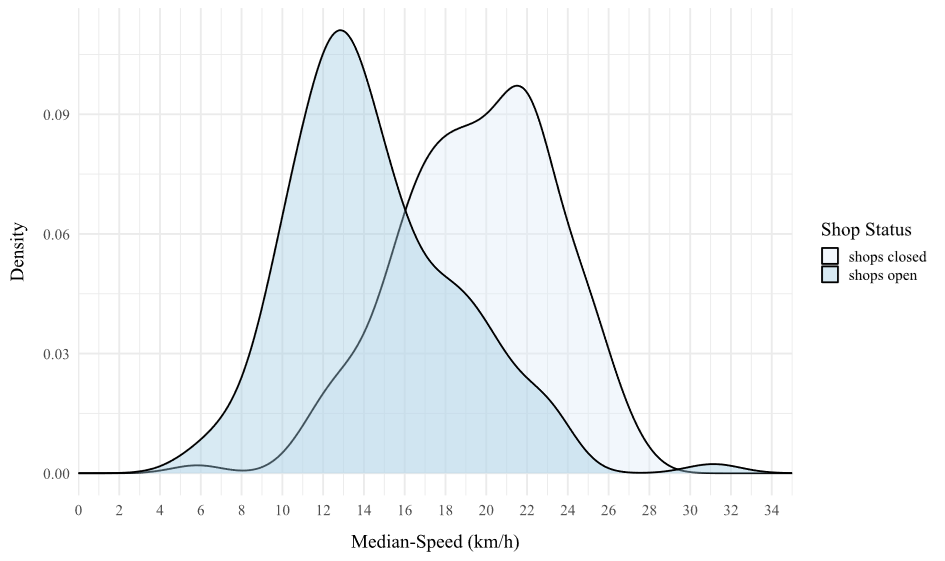
The previously described relationships are further illustrated in comparative speed-density plots for the zone (see Figure 7). These plots clearly show higher speeds during shop closing hours. They also highlight the differences between time periods, making the behavioural adjustments visually evident.
The data analysis reveals two central results:
-
Cycling volumes vary depending on retail opening hours or rather pedestrian volumes. When pedestrian density is high (during shop opening hours), cycling volumes decrease. While cyclists frequently use the pedestrian zone in the morning, they appear to choose alternative routes in the afternoon. This behavioural adaptation reduces potential conflicts between cyclists and pedestrians.
-
Cycling speeds vary depending on retail opening hours or rather pedestrian volumes. When pedestrian density is high, cyclists significantly reduce their speeds. Whereas cyclists travel faster in the morning, average speeds drop markedly in the afternoon. Cyclists therefore adapt not only their route choice but also their riding behaviour. This speed adjustment further reduces conflict potential.
In summary, during periods of high pedestrian activity, fewer cyclists use the pedestrian zone, and those who do use it reduce their speeds considerably. The results clearly demonstrate a pronounced behavioural adaptation of cyclists in response to increased pedestrian presence.
4. Discussion
The findings of this study can be meaningfully interpreted in light of the existing body of research on pedestrian-cyclist interactions in shared spaces. Overall, our results align closely with prior empirical evidence, while also revealing several aspects that need further investigated.
The findings of this study can be interpreted in light of existing research on pedestrian–cyclist interactions in shared spaces. Overall, our results align closely with prior empirical evidence while also highlighting aspects that require further investigation. A consistent conclusion in the literature is that such interactions are generally low in conflict intensity and rarely lead to safety-critical situations or accidents (e.g., Beitel et al., 2018; Medicus et al., 2023; Marsch, 2018). Our analysis confirms this pattern, as no crashes were observed in the case study area. Nevertheless, the space remains conflict-prone due to high volumes of both cyclists and pedestrians. In this context, perceived safety plays an important role, as frequent interactions and the need for continuous adaptation may influence user behavior and route choice.
Our findings also reflect behavioral patterns identified in previous studies. As shown by Alsaleh and Sayed (2020), cyclists behave differently when following or overtaking pedestrians, with overtaking associated with higher speeds and greater lateral distances, while conflict situations typically involve deceleration. We observe similar tendencies, with cyclists more often reducing speed than accelerating (e.g., to resolve conflicts), which is in line with Liang et al. (2021), who attribute this to anticipatory behavior and implicit social norms. This is further supported by our observation that cyclists may adjust not only speed but also route choice, for example by avoiding shared spaces during peak pedestrian periods.
In terms of speed adaptation, our results confirm that cyclists reduce their speed times of (assumed) increased pedestrian density, which is consistent with earlier studies such as Beitel et al. (2018), Boufous et al. (2018), and Dahak et al. (2025). High speeds and high conflict densities rarely coincide; instead, higher speeds occur at low densities, while higher densities are associated with more frequent but less severe conflicts. This pattern is reinforced by route choice behavior, as cyclists appear to shift to alternative routes when densities rise. Regarding absolute speed levels, our findings are comparable to previous research, although observed speeds in our study are often even lower, frequently below 15 km/h.
Due to differences in data and methods, several findings of previous studies could not be confirmed. Guo et al. (2020) observe the spontaneous formation of “functional lanes” in bidirectional shared spaces. We did not find clear evidence of such lane formation in our case study area due to lack of data or constraints in resolution. Similarly, we were unable to identify near-crashes in the data, despite their documented relevance as indicators of potential risk and perceived safety (Mesimäki & Luoma 2021). This absence may be related to data resolution, contextual factors, or the characteristics of the user sample. It underlines the need for further and more detailed analyses.
A key strength of our approach lies in the use of CITY CYCLING GPS data, which offer substantial analytical potential due to their spatial coverage and availability across Germany. However, these data must be interpreted critically. The dataset predominantly includes everyday cyclists who voluntarily participate in the CITY CYCLING campaign; arguably a group of relatively experienced and motivated riders. This raises the question of who is not represented in the dataset and whose behavior is therefore not implicitly included in the analysis. Occasional cyclists, less confident users, children, or tourists may be underrepresented. Additionally, the “perceived surveillance” associated with data recording (tracking via smartphone app) may have been influential to behavior: cyclists may be aware that their trips are tracked might ride in a more rule-compliant or cautious manner.
There are also data-systemic challenges to consider, particularly GPS accuracy and its implications for measuring lateral movements or small-scale evasive maneuvers. For these reasons, we do not consider this approach a full substitute for traditional survey or observational methods. Rather, it provides a highly useful first-level screening tool that can generate spatially comprehensive insights into potential problem areas. Its major advantage lies in its scalability and transferability, given that CITY CYCLING data are available nationwide (in Germany), which provides data for more than 3,000 cities and municipalities. Nevertheless, the approach should be tested in additional case study areas to assess its robustness and generalizability.
This approach is subject to several limitations, primarily related to data availability and quality. The analysis relies on aggregated and partially indirect indicators, which may not fully capture the complexity of pedestrian behavior or the nuanced effects of retail dynamics. In particular, limitations in temporal resolution and spatial coverage constrain the ability to establish causal relationships with high precision. Therefore, the results should be interpreted with caution.
At this stage, the work should be understood as a proof of concept. Its primary objective is to demonstrate the feasibility of the methodological approach and to provide initial evidence of the underlying relationships, rather than to deliver definitive or generalizable conclusions. Future research with more comprehensive data will be necessary to validate and refine the findings.
5. The road ahead
Looking ahead, future research should aim to integrate the wide range of influencing factors identified across the literature into a more comprehensive analytical and potentially predictive framework than the one we present here, while maintaining scalability.
Across studies, at least six robust core drivers of pedestrian-cyclist interactions emerge: (1) traffic density and composition, (2) available space and geometry, (3) speed levels and speed differences, (4) movement direction and traffic organization, (5) type of interaction and avoiding behavior, and (6) traffic complexity and user heterogeneity. To date, no single study has fully integrated all of these dimensions, and our own work also leaves some of them only partially addressed.
A next step would be the systematic integration of traffic density and composition (1), consistently identified as the strongest influencing factor. While cycling volumes can be derived from GPS data, pedestrian flows are more difficult to capture at scale. Instead of relying on opening hours as a proxy, future analyses should aim to incorporate actual pedestrian counts where available. In their absence, pedestrian densities could be estimated using a point-of-interest (POI) approach, deriving expected pedestrian volumes from the number and type of nearby destinations. Such estimates could be calibrated against observed counts and temporal variation patterns.
The role of available space and geometry (2) should also be strengthened. The width and cross-sectional layout of shared spaces influence both safety and behavioral strategies. Data from land-use and traffic surface layers (e.g., OpenStreetMap) could be used to calculate available space and integrate it as a variable in explanatory or predictive models. Combined with flow data, this would enable more precise density calculations.
Regarding speed levels and speed differentials (3), our study already incorporates cyclist speeds, but these represent only one part of the interaction. Literature suggests that speed differences, rather than absolute speeds, are decisive. Directly measuring these differences at scale is challenging, particularly within a transferable framework. However, acceleration and deceleration patterns derived from 1 Hz GPS data could provide valuable indicators of spontaneous reactions and behavioral adaptation. Braking events, in particular, may serve as proxies for perceived risk.
Movement direction and traffic organization (4) represent another important dimension. Bidirectional flows may produce more evenly distributed spatial patterns but also more complex interactions, as suggested by Guo (2020). Where direct data on pedestrian flow directions are unavailable, GIS-based modeling of likely movement regimes could offer a feasible alternative. This area requires further methodological development.
The type of interaction and evasive behavior (5) could also be operationalized using GPS trajectories. Evasive maneuvers – especially lateral deviations – are the dominant reaction in conflict situations, with Liang et al. (2021) reporting that more than 50% of responses involve side-stepping. By calculating directional vectors for each second of a cyclist’s trip, changes in trajectory could be identified and quantified. Importantly, the focus would not be on detecting near-crashes but rather on measuring subtle adjustments in riding style, such as straight-line riding versus meandering in crowded conditions.
Finally, traffic complexity and user heterogeneity (6) deserve greater attention. Not only the quantity but also the composition of users matters. Studies suggest that conflict frequency increases with higher user diversity (e.g., children, e-bikes, pedestrian groups) and in complex spatial situations such as intersections or crossings. Future analyses could integrate demographic information (e.g., age and gender) where available in the cycling sample, as well as bicycle type (e.g., e-bike versus conventional bicycle). In addition, POI data from OpenStreetMap (e.g., benches, fountains, or other amenities) could serve as indicators of stationary activities and mixed-use intensity, thereby approximating traffic complexity.
Ultimately, these elements could be combined into different types of models, ranging from relatively simple regression approaches to more advanced machine learning or AI-based frameworks. The appropriate modeling strategy remains to be defined and should depend on data availability, transferability requirements, and interpretability considerations. Crucially, any such model would require rigorous validation, both with independent datasets and through application to additional case study areas, in order to assess its predictive power and generalizability.
6. Conclusion
In conclusion, our study confirms many of the central findings in the existing literature regarding speed adaptation, density effects, and the generally low severity of pedestrian-cyclist conflicts in shared spaces. At the same time, it highlights methodological challenges and data limitations, particularly in relation to user representation and behavioral granularity. The proposed GPS-based approach offers a scalable and promising avenue for spatially comprehensive analysis of behavioral adaptation and potential risk. However, further methodological refinement, integration of additional influencing factors, and validation across diverse contexts are essential steps toward developing a robust and transferable modeling framework for assessing risk potential in shared urban spaces.
CRediT contribution
Stefan Huber: Conceptualization, Funding acquisition, Investigation, Methodology, Project administration, Resources, Supervision, Validation, Visualization, Writing–original draft, Writing–review & editing. Sven Lißner: Conceptualization, Formal analysis, Funding acquisition, Investigation, Methodology, Project administration, Supervision, Validation, Visualization, Writing–review & editing.
Acknowledgements
The authors gratefully acknowledge the willingness of all CITY CYCLING participants to donate to the campaign and, thus, to this research.
Declaration of competing interests
The authors report no competing interests.
Declaration of generative AI use
During the preparation of this work the authors used YOU.com in order to check the text for grammar and mistakes. The output was reviewed and revised by the authors who take full responsibility for the content of the publication.
Prior dissemination declaration
An earlier version of this work was presented at the 37th ICTCT conference, held in Berlin, Germany, on 23–24 October 2025.
Ethics statement
The methods for data collection and data processing applied in this study are in accordance with the guidelines of the ethics commission and the standards of good scientific practice at Dresden University of Technology.
Funding statement
This research was funded by the German Research Foundation ‘DFG’ (Deutsche Forschungsgesellschaft) within the project ‘Radverkehrsverhalten in Deutschland – RiD’ with the grant number 514587991.
Data availability statement
The data are available on request to the authors.
Editorial information
Handling editor: Aliaksei Laureshyn, Lund University, Sweden.
Reviewer: Rul von Stülpnagel, University of Freiburg, Germany.
Submitted: 27 February 2026; Accepted: 29 April 2026; Published: 8 May 2026.