Discourtesy: an anger evoking factor among Iranian drivers
Abstract
Driving anger is known to be associated with aggressive driving, which can lead to a higher probability of accidents. Since the Driving Anger Scale (DAS) was first introduced in the US, different versions of the scale have been used in many countries to measure anger evoked by different traffic situations. The first aim of this study was to test the validity and reliability of the UK-DAS in Iran. The second aim was to examine the relationship between demographic factors and the DAS factors found in Iran. A total of 409 questionnaires were completed by Iranian drivers, out of which, 205 were used for exploratory factor analysis and 204 were used for confirmatory factor analysis. The results revealed a reliable four-factor structure in Iran including 19 of the original 21 items from the UK-DAS. These four factors were interpreted as discourtesy, direct hostility, reckless driving and progress impeded. Further analyses showed that younger, compared to older, participants scored higher on driving anger evoked by other road users’ discourtesy and direct hostile behaviours. With the factor structure validated in Iran the DAS can now be used in further research, for example to examine how Iranian drivers express their anger in different traffic situations. Cross-culturally, the results can be compared with other countries.
1. Introduction
Anger in traffic has been in focus for researchers’ interest for more than thirty years now (Deffenbacher et al., 2016). This interest is motivated as anger can have a negative impact on an individual’s attention, perception, information processing, and motor performance and thereby increase the likelihood of an accident either directly or indirectly (Deffenbacher et al., 1994). For example, Deffenbacher et al. (2003) showed more frequent involvement of high-anger drivers in aggressive and risky behavior on the road and experiencing more of some crash-related outcomes than low-anger drivers. A crash involvement model showed that aggressive drivers (according to self-reports) were 2.79 times more likely to be involved in road crashes than cautious drivers (Adavikottu & Velaga, 2021). Other previous studies suggest that younger, men, and high-mileage drivers are more likely to engage in aggressive driving behaviors (Özkan et al., 2010; Stanojević et al., 2018; Zhang et al., 2018). These groups are also more likely to commit traffic violations and be involved in accidents (Özkan, et al., 2010; Villieux & Delhomme 2010). One of the most common ways to measure driving anger is by the means of the Driving Anger Scale (DAS). The DAS was first introduced by Deffenbacher et al. (1994). This original 33-item scale distinguished between six factors, or subscales, named i. hostile gestures (e.g., someone yells at you about your driving), ii. illegal driving (e.g., someone is driving well above the speed limit), iii. police presence (e.g., a police officer pulls you over), iv. slow driving (e.g., someone is driving slower than is reasonable for the traffic flow), v. discourtesy (e.g., someone speeds up when you try to pass them), and vi. traffic obstruction (e.g., you are stuck in a traffic jam). When constructing the 33-item DAS, Deffenbacher et al. (1994) also developed a 14-item short form by selecting items from each of the six subscales in the long form. They concluded that when a total score for driving anger is needed, either the short or the long form may be used. But when subscale differences between groups of drivers are of importance, the long scale should be used.
Since the introduction of the DAS in the US, slightly different versions of the scale have been validated in many countries including China (Li et al., 2014), France (Delhomme & Villieux, 2005; Villieux & Delhomme, 2007; Villieux & Delhomme, 2010; Sullman et al., 2017), Finland (Parker et al., 2002), Germany (Brandenburg & Oehl, 2021), Japan (McLinton & Dollard, 2010), Malaysia (Sullman et al., 2014), New Zealand (Sullman, 2006), Serbia (Matović et al., 2020; Matović et al., 2020), Spain (Sullman et al., 2007), Sweden (Björklund, 2008), the Netherlands (Parker et al., 2002), Turkey (Yasak & Esiyok, 2009), UK (Lajunen et al., 1998; Parker et al. 2002), and Ukraine (Deffenbacher et al., 2016).
In the UK, Lajunen et al. (1998) developed a 21-item version called the UK DAS. The factor structure revealed three factors namely i. progress impeded (e.g., someone is driving more slowly than is reasonable for the traffic flow), ii. reckless driving (e.g., someone is driving well above the speed limit), and iii. direct hostility (e.g., someone shouts at you about your driving). The Chronbach’s alpha coefficients for the three factors were .87, .88, and .87, respectively. Further examination showed no systematic gender differences in the DAS scores while drivers’ age and annual mileage were negatively related to the DAS scores. The main difference between the UK DAS and the original version of the DAS is that the British version only contains interpersonal elements where driving anger is evoked by another individual road user, while the original versions also include more non-personal situations (e.g., you are stuck in a traffic jam).
Using the definitions developed by Shinar (2017), the term 'anger' can be linked to both concepts: (1) driving aggression: an instrumental behavior which tries to increase a driver's own benefits by inconsiderateness toward or annoyance of other drivers or deliberate dangerous driving to save time at the expense of others; and (2) road rage: a hostile behavior which tries to increase the deliberate harm and loss to others. In the current study, and in the literature conducted on the concept of DAS, driving aggression is the prevailing context in portraying the links in interpersonal driving anger.
Even though gender differences are rarely found on the DAS scores - regardless of version of the DAS used (Deffenbacher et al., 2016; Lajunen et al., 1998; Li et al., 2014) some studies have found differences in some of the factors. In Germany and Spain women scored higher on discourtesy and illegal driving (Brandenburg & Oehl, 2021; Sullman et al., 2007). While, in Malaysia, women scored higher on traffic obstructions and hostile gestures (Sullman et al., 2014), which are consistent with findings in New Zealand (Sullman, 2006). In terms of age, the relationship with the DAS scores is less clear which might be explained by the fact that the samples in most DAS studies have a very small age range.
In 2016, Deffenbacher, Stephens and Sullman called for more research on driving anger (with or without using DAS) outside Western countries. Despite the shortage of non-Western studies at least three studies have been conducted in Iran. Kazemeini et al., (2013), investigated driving anger in 20 male taxi drivers in Iran using the total score of the short form (14-items) DAS. Before the main study, the authors examined the validity and reliability of the Farsi version of the short form DAS in a pilot study with one hundred taxi drivers. In addition, Barahmand et al. (2016) investigated driving anger among 120 male taxi drivers using the 33-item DAS with the original six subscales. Finally, Karimi et al. (2022) investigated driver anger among 254 male intercity bus drivers in Iran using the short form DAS but with three subscales – illegal driving, hostile gestures, and traffic obstruction – which were tested and confirmed using confirmatory factor analysis.
In this study, we are interested in investigating the factor structure of the 21-item UK DAS in Iran. We think this version of the DAS is the most appropriate aswe want to i. study the relationships between demographic factors and the DAS factors (therefore the short form is not appropriate), and ii. focus on the interpersonal factors where there is another road user to blame. In contrast to the previous Iranian studies focusing on male professional drivers, we will investigate driving anger among both women and men irrespective of their profession. The first aim of this study is therefore to test the factor structure of the 21-item UK DAS in Iran. The second aim is to examine the relationship between demographic factors and the DAS factors found in Iran.
2. Methods
2.1 Participants
A research team, consisting of two women and one man with master’s degrees, distributed 484 questionnaires to people in three public parks, three shopping malls, and one medical center in the city center and other more populated areas of Karaj city in Iran, between August and November 2022. People of different ages who looked ready and enthusiastic to participate in the survey was approached. The participants filled in the questionnaire by themselves where they were approached. In some rare cases, if their vision or literacy problems prevented them from doing so, the research team interviewed the participants orally and entered their answers instead of the participants.
A total of 409 questionnaires were completed. Of these, 205 questionnaires were randomly chosen for exploratory factor analysis while the remaining 204 questionnaires were used for confirmatory factor analysis. The 409 participants were between 18 and 93 years old (M = 40.70 years, SD = 16.01 years). Among these 409 participants, 177 were women and 232 were men. The mean annual mileage driven by the participants was 14 548 km (SD = 30 559 km). The participants in the exploratory factor analysis were between 18 and 93 years old (M = 40.55 years, SD = 15.90 years). Among these 205 participants, 84 were women and 121 were men. The mean annual mileage driven by the participants in the exploratory factor analysis was 15 162 km (SD = 22 550 km). The participants in the confirmatory factor analysis were between 18 and 92 years old (M = 40.85 years, SD = 16.16 years). Among these 204 participants, 93 were women and 111 were men and the mean annual mileage driven by the participants was 13 931 km (SD = 36 947 km).
2.2 Questionnaire
The UK DAS (Lajunen et al., 1998) was translated to Persian and the translated version was evaluated to ensure the comprehensibility. This evaluation was done by distributing the questionnaire to five people, without academic education, asking them about the comprehension of the items. The instruction Imagine that each situation described below was happening to you and rate the amount of anger that would be provoked was followed by 21 different situations (items). The response scale to these items constituted a 5-point Likert scale (5 = very much; 4 = much; 3 = some; 2 = a little; and 1 = not at all). All 21 items measuring driving anger evoked by another individual road user can be found in Table 1. In addition to these items, the questionnaire also included some background questions about gender, age, and annual milage driven.
2.3 Statistical analysis
Missing values were excluded from the study listwise. The distribution of the DAS, gender, age and annual mileage driven were within the allowed range (skewness and kurtosis < 2). Using the whole sample (n = 409), descriptive statistical analysis was performed in order to have a better view of the participants and the driving anger experienced by different gender and age groups.
Using the first subset of the data (n = 205), exploratory factor analysis was used to discover the factors evoking driving anger. Principal Component Analysis (PCA) was performed to explore and extract the factors. As the factors were correlated, an inclined or correlated rotation method is recommended, of which the Promax method is a good alternative (Ledesma et al., 2021) and therefore used. The Kaiser-Meyer-Olkin value (Kaiser, 1970) of KMO = 0.86, p < .001 suggests that the data was suitable for sampling while a statistically significant (p < .001) value regarding Bartlett’s test of sphericity (Bartlett, 1954) suggests that the items were appropriate for extracting meaningful factors. In general, KMO values between 0.8 and 1 indicate the sampling is adequate (Dziuban & Shirkey, 1974). Using the second subset of data (n = 204), confirmatory factor analysis, with the maximum likelihood method, was then performed to confirm the Iranian factor structure.
Finally, the full sample (n = 409) was used to examine the relationship between the demographic variables and the DAS factors in Iran. The Pearson correlation as well as a second confirmatory factor analysis using the Maximum Likelihood (ML) approach was performed including the demographic variables and the DAS factors. An index for each factor was calculated by taking the mean for the including items in each factor. Age and annual mileage are continuous variables and gender is a dummy variable with men coded as 0 and women as 1. Regarding the items measured on a Likert scale, we assume there is a continuous scale underlying the ordinal scales and thereby treat this as parametric data.
The model fit of each of the two confirmatory factor analyses was examined by means of chi-square (χ2), χ2/df and root mean square error of estimation (RMSEA). A proper fit of the model is suggested by the value of the normal chi-square parameter (χ2/df), between 2 and 5 (Hooper et al., 2008). Regarding the RMSEA parameter, if this value is between 0.05 and 0.08, it indicates a good fit of the model, and if it is between 0.08 and 0.10, it indicates an average fit of the model, and above 0.10 indicates a poor fit of the model (Hooper et al., 2008). Also, the 90 per cent confidence interval for the root mean square of estimation errors (90% CI) was calculated, where the upper limit of the interval should be 0.08 and the lower limit should be zero (Hooper et al., 2008). The internal consistency reliability for each of the DAS factors in Iran was measured by Chronbach’s alpha.
SPSS 22.0.0 software was used for all analyses except the confirmatory factor analysis where LISREL 10.20 software was used.
3. Results
3.1 Descriptive statistics
Means and standard deviations of the DAS items for all 409 participants are shown in Table 1. The two situations evoking most anger among the Iranian drivers are Someone cuts in right in front of you on the motorway (M = 3.57, SD = 1.14), and Someone cuts in and takes the parking spot you have been waiting for (M = 3.50, SD = 1.12). The two situations evoking least anger are Someone in front of you does not move off straight away when the light turns to green (M = 2.31, SD = 1.06) and Someone is driving well above the speed limit (M = 2.46, SD = 1.15).
| Items | M | SD |
|---|---|---|
| 7. Someone cuts in right in front of you on the motorway | 3.57 | 1.14 |
| 8. Someone cuts in and takes the parking spot you have been waiting for | 3.50 | 1.12 |
| 10. A slow vehicle on a winding road will not pull over and let people pass | 3.46 | 3.46 |
| 11. Someone backs out right in front of you without looking | 3.44 | 1.15 |
| 4. Someone is driving too slowly in the outside lane, and holding up traffic | 3.22 | 1.03 |
| 14. At night someone is driving right behind you with bright lights on | 3.18 | 1.12 |
| 13. Someone coming towards you does not dim their headlights at night | 3.16 | 1.11 |
| 5. Someone is driving very close to your rear bumper | 3.16 | 1.14 |
| 20. Someone shouts at you about your driving | 3.00 | 1.24 |
| 6. Someone is weaving in and out of traffic | 2.98 | 1.11 |
| 17. Someone makes an obscene gesture towards you about your driving | 2.95 | 1.29 |
| 15. Someone speeds up when you try to pass them | 2.84 | 1.17 |
| 16. Someone pulls out right in front of you when there is no-one behind you | 2.84 | 1.20 |
| 9. Someone is driving more slowly than is reasonable for the traffic flow | 2.74 | 1.09 |
| 3. A pedestrian walks slowly across the middle of the street, slowing you down | 2.70 | 1.15 |
| 21. A cyclist is riding in the middle of the lane and slowing traffic | 2.59 | 1.12 |
| 2. Someone is driving too fast for the road conditions | 2.55 | 1.01 |
| 12. Someone runs a red light or stop sign | 2.55 | 1.17 |
| 18. Someone beeps at you about your driving | 2.51 | 1.06 |
| 19. Someone is driving well above the speed limit | 2.46 | 1.15 |
| 1. Someone in front of you does not move off straight away when the light turns to green | 2.31 | 1.06 |
| Total DAS (the mean of all items) | 2.94 | 1.13 |
3.2 Exploratory factor analysis
An exploratory factor analysis was performed on the first subset of the data (n = 205). The principal component analysis, with Promax rotation, of the 21 items extracted five factors whose eigenvalues were greater than 1.00 (Table 2).
One item, Someone speeds up when you try to pass them, had a factor loading less than .40 while another item, A cyclist is riding in the middle of the lane and slowing traffic, formed a factor on its own. These two items were therefore excluded, resulting in a four-factor solution with 19 items explaining 54.63 percent of the total variance.
The first DAS factor in Iran consists of eight items which loaded either into the factor progress impeded or the factor reckless driving in the UK DAS (Lajunen et al., 1998). Comparing the first factor to the original version of the DAS (Deffenbacher et al., 1994), these eight items loaded into the factor discourtesy. The first DAS factor in Iran was therefore interpreted as discourtesy. The second DAS factor in Iran consists of four items where three loaded into the factor direct hostility in the UK DAS (Lajunen et al., 1998). This factor was therefore interpreted as direct hostility. The third DAS factor in Iran consists of four items which all loaded into the factor reckless driving in the UK DAS (Lajunen et al., 1998) and this factor was therefore interpreted as reckless driving. Finally, the fourth DAS factor in Iran consists of three items which all loaded into the factor progress impeded in the UK DAS (Lajunen et al., 1998), and this factor was also interpreted as progress impeded.
| No. | Items | Factor | |||
|---|---|---|---|---|---|
| 1 | 2 | 3 | 4 | ||
| 4 | Someone is driving too slowly in the outside lane, and holding up traffic | 0.85 | |||
| 11 | Someone backs out right in front of you without looking | 0.79 | |||
| 10 | A slow vehicle on a winding road will not pull over and let people pass | 0.78 | |||
| 8 | Someone cuts in and takes the parking spot you have been waiting for | 0.74 | |||
| 7 | Someone cuts in right in front of you on the motorway | 0.62 | |||
| 13 | Someone coming towards you does not dim their headlights at night | 0.59 | |||
| 5 | Someone is driving very close to your rear bumper | 0.51 | |||
| 14 | At night someone is driving right behind you with bright lights on | 0.43 | |||
| 18 | Someone beeps at you about your driving | 0.90 | |||
| 20 | Someone shouts at you about your driving | 0.72 | |||
| 16 | Someone pulls out right in front of you when there is no-one behind you | 0.68 | |||
| 17 | Someone makes an obscene gesture towards you about your driving | 0.52 | |||
| 19 | Someone is driving well above the speed limit | 0.78 | |||
| 2 | Someone is driving too fast for the road conditions | 0.66 | |||
| 12 | Someone runs a red light or stop sign | 0.64 | |||
| 6 | Someone is weaving in and out of traffic | 0.45 | |||
| 9 | Someone is driving more slowly than is reasonable for the traffic flow | 0.78 | |||
| 3 | A pedestrian walks slowly across the middle of the street, slowing you down | 0.74 | |||
| 1 | Someone in front of you does not move off straight away when the light turns to green | 0.57 | |||
| Eigenvalue | 6.90 | 2.04 | 1.37 | 1.24 | |
| Percent of variance | 31.39 | 9.29 | 6.24 | 5.67 | |
3.3 Confirmatory factor analysis
A confirmatory factor analysis (see Figure 1) was then performed on the second subset of the data (n = 204) to confirm the Iranian four-factor structure found in the exploratory factor analysis above (Table 2). According to the model fit coefficients in Table 3, the model has a good fit with the data and the factor structure was confirmed. All standardized path coefficients shown in Figure 1 are statistically significant (p < .001) and all of them have positive values above 0.5.
| χ2 * | df | χ2/df | RMSEA | 90% CI | |
|---|---|---|---|---|---|
| DAS model without demographic variables | 310.02 | 146 | 2.12 | 0.07 | 0.06 - 0.09 |
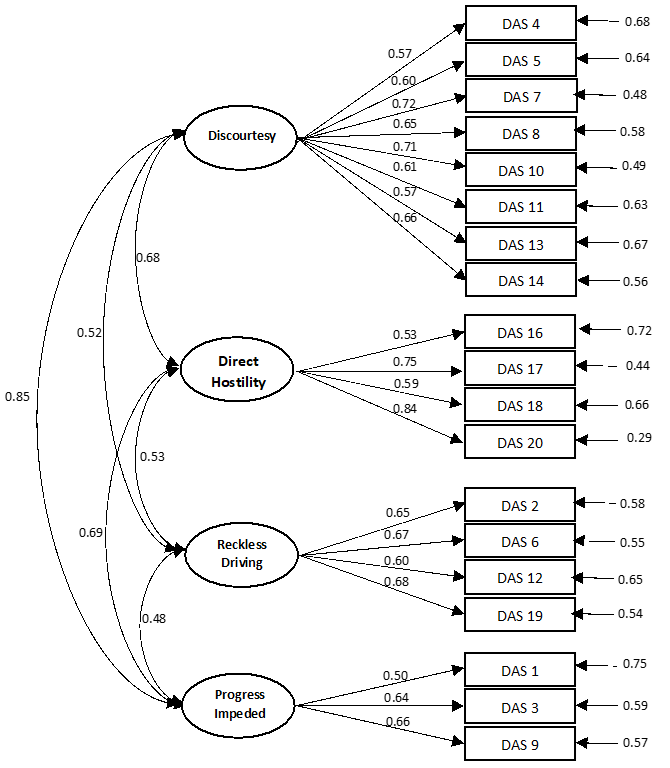
3.4 The relationship between demographic variables and DAS factors in Iran
Using the full sample (n = 409), the Chronbach’s alpha coefficients for each of the DAS factors in Iran were .85 (discourtesy, mean = 3.33), .77 (direct hostility, mean = 2.82), .71 (reckless driving, mean = 2.61) and .63 (progress impeded, mean = 2.58), respectively. Means and standard deviations of the four DAS factors in Iran are shown in Table 4.
| DAS factors in Iran | M | SD |
|---|---|---|
| Discourtesy | 3.33 | 1.12 |
| Direct Hostility | 2.82 | 1.20 |
| Reckless Driving | 2.63 | 1.11 |
| Progress Impeded | 2.58 | 1.10 |
Correlation coefficients between gender, age, annual mileage driven and the DAS factors in Iran are shown in Table 5. As men were coded as 0 and women as 1, the negative correlation between gender and age (r = -.24), as well as between gender and annual milage driven (r = -.20), indicate that the men were generally older and drove longer distances than women. The positive correlation found between age and annual milage driven (r = .11), indicates that older participants drove longer distances than younger participants. Furthermore, a negative correlation was found between age and discourtesy (r = -.16) and between age and direct hostility (r = -.11) indicating that younger participants scored higher, than older participants, on driving anger evoked by discourtesy and direct hostility.
The four DAS factors in Iran were all significant positively correlated, ranging from .36 between reckless driving and progress impeded to .58 between discourtesy and direct hostility. This indicates that although the factors represent different dimensions of driving anger, they are still related.
| 1 | 2 | 3 | 4 | 5 | 6 | 7 | |
|---|---|---|---|---|---|---|---|
| 1. Gender | 1 | ||||||
| 2. Age | -.24** | 1 | |||||
| 3. Annual mileage | -.20** | .11* | 1 | ||||
| 4. Discourtesy | -.08 | -.16** | .04 | 1 | |||
| 5. Direct hostility | .00 | -.11* | -.02 | .58** | 1 | ||
| 6. Reckless driving | .04 | .05 | -.05 | .41** | .47** | 1 | |
| 7. Progress impeded | -.10 | -.06 | .05 | .56** | .45** | .36** | 1 |
Using the full sample (n = 409), Figure 2 shows the Iranian four-factor structure, confirmed in the previous section, together with the three demographic variables. In this figure, the path coefficients between the demographic variables and the DAS factors in Iran, as well as the path coefficients between the DAS factors in Iran and their indicator items are shown. The path coefficients between the three demographic variables and the DAS factors in Iran have values less than 0.3, which indicates a weak and, in most cases, insignificant relationship between these three variables and the factors. In line with the results of the correlation analysis shown in Table 4, the standardized path coefficients between age and discourtesy as well as between age and direct hostility were negatively statistically significant. This indicates that younger participants scored higher, than older participants, on driving anger evoked by discourtesy and direct hostility.
According to the model fit coefficients in Table 6, the model has an average fit with the data.
| χ2 * | df | χ2/df | RMSEA | 90% CI | |
|---|---|---|---|---|---|
| DAS model with demographic variables | 820.17 | 197 | 4.16 | 0.088 | 0.08-0.09 |
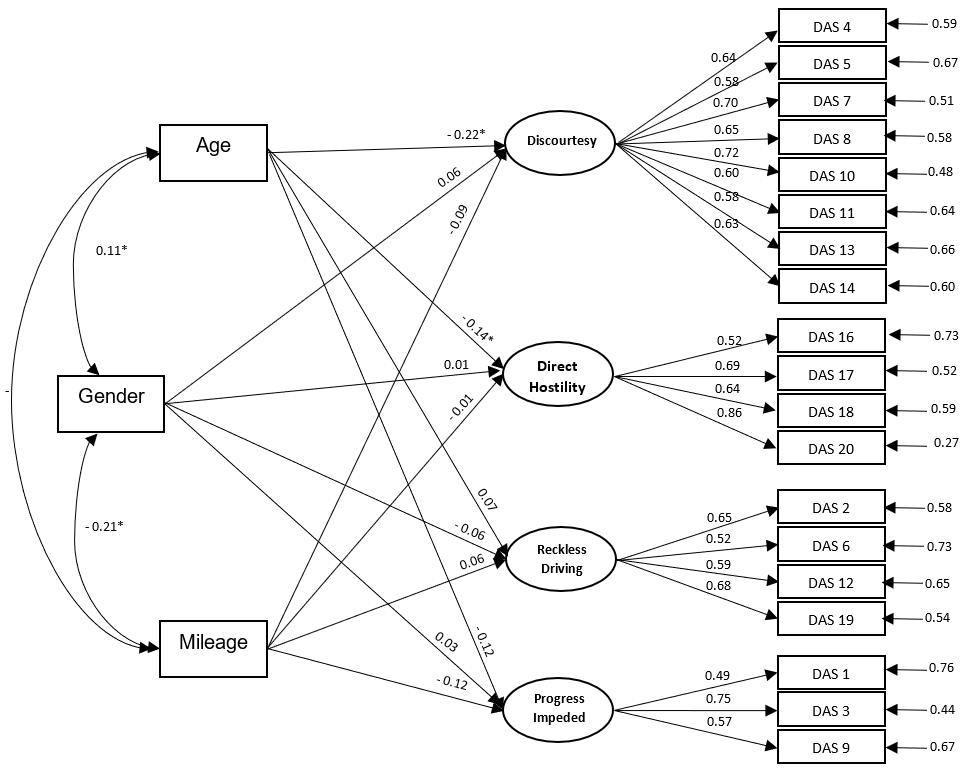
4. Discussion
The first aim of this study was to test the factor structure of the UK DAS (Lajunen et al., 1998) in Iran. Exploratory factor analysis revealed a four-factor structure including 19 of the 21 items from the UK DAS. The four factors were interpreted as discourtesy, direct hostility, reckless driving, and progress impeded. Furthermore, confirmatory factor analysis showed that the four-factor structure has an average fit with the data of Iranian drivers. The Cronbach’s alpha coefficients for each of the factors were: discourtesy = .85, direct hostility = .77, reckless driving = .71, and progress impeded = .63. According to Taber (2018) this means that discourtesy had good reliability (.8 ≤ α < .9), direct hostility and reckless driving had acceptable reliability (.7 ≤ α < .8), while progress impeded had questionable reliability (.6 ≤ α < .7). Cronbach’s alpha is affected by the number of items included which could explain the lower reliability in the factors with few items, e.g., progress impeded includes only three items in the Iranian factor structure. These results would somehow reflect the current punishments on the most crash-inducing aggression-related violations in Iran, the highest rates of which include reckless driving, excess speed over 30 km/h, forbidden overtaking, red light running, and weaving maneuvers.
Eleven of the 12 items constituting direct hostility, reckless driving, and progress impeded loaded in the same factors in Iran and the UK. The twelfth item, Someone pulls out right in front of you when there is no-one behind you, loaded in the Iranian direct hostility but in the UK reckless driving. Furthermore, eight items which loaded either into the UK factors progress impeded or reckless driving created a fourth Iranian factor named discourtesy. This discourtesy factor was found to be the highest anger evoking factor in Iran, which is in line with previous results from the UK (discourtesy as defined by Deffenbacher et al., 1994), Germany (Brandenburg & Oehl, 2021), Malaysia (Sullman et al., 2014), New Zealand (Sullman, 2006), Spain (Sullman et al., 2007), and Turkey (Yasak & Esiyok, 2009).
The two situations, Someone cuts in right in front of you on the motorway and Someone cuts in and takes the parking spot you have been waiting for, evoking most anger among the Iranian drivers are the same as for Spanish (Sullman, et al, 2007), Ukrainian (Deffenbacher et al., 2016) and French drivers (Delhomme & Villieux 2005). The first situation could be very dangerous, whereas the second situation involves inconsiderate behavior. The second situation was also one of the two situations evoking most anger among British drivers (Lajunen et al., 1998; Lajunen & Parker, 2001) and Swedish drivers (Björklund, 2008), meaning that drivers in general seems to become very angry or annoyed at this inconsiderate behavior. In general, in the exploratory factor analysis, the overall mean score of anger among the Iranian drivers (including all 21 items) was 2.94 which is similar to the overall scores obtained in other countries: 2.36 in UK (Lajunen et al., 1998), 3.15 in France (Delhomme & Villieux, 2005), 2.76 in Spain (Sullman, et al, 2007), 3.12 in Turkey (Yasak & Esiyok, 2009), 2.78 in Ukraine (Deffenbacher et al., 2016), and 3.07 in Germany (Brandenburg & Oehl, 2021).
The first and second factors extracted in the EFA were discourtesy respective direct hostility. These two factors were also the factors evoking most anger among the Iranian drivers (mean scores: discourtesy = 3.33, direct hostility = 2.82). The level of anger evoked by reckless driving and progress impeded was 2.63 and 2.58, respectively. Discourtesy was also the most anger evoking factor for example in the US (Deffenbacher et al., 1994), New Zealand (Sullman, 2006), and Turkey (Yasak & Esiyok, 2009).
Although the previous studies investigating driving anger in Iran did not use the same version of the DAS, or the same kind of participants, as we did, we have made some comparisons regarding the level of driving anger. By performing some calculations of the results in the other studies we found that the overall mean score of driving anger was 2.74 in the study by Kazemeini et al. (2013), 2.32 in the study by Barahmand et al. (2016), and 3.08 in the study by Karimi et al. (2022). In the first two studies driving anger in taxi drivers was investigated, and in the last study driving anger in bus drivers was investigated. Kazemeini et al. (2013) and Karimi et al. (2022) were using the short form (14-items) DAS, whereas Barahmand et al. (2016) were using the 33-item DAS. In our study, where we used the 21-items UK DAS, did not focus on profession and included both genders, we found a mean score of 2.94, which is in line with previous studies. Kazemeini et al (2013) did not present any subscales, but both Barahmand et al. (2016) and Karimi et al. (2022) included hostile gestures (comparable to our subscale direct hostility) and illegal driving (comparable to our subscale reckless driving). The mean scores for hostile gestures were 2.41 and 2.69, compared to the mean value of 2.82 for direct hostility in our study. The mean scores for illegal driving were 2.24 and 3.45, compared to the mean value of 2.63 for reckless driving in our study. Further, in the DAS version that Barahmand et al. (2016) used, the subscale discourtesy was included. The mean value of this subscale was 2.66, compared to the mean value of 3.33 in our study, indicating that the discourtesy from other drivers is a bigger issue for the general driver than for male taxi drivers. This finding is in line with studies in other countries where professional drivers reported less anger over discourtesy compared to non-professional drivers (for example Feng et al., 2017)
The second aim of this study was to examine the relationship between demographic factors and the DAS factors in Iran. Based on Pearson correlation analysis, as well as on the confirmatory factor analysis, negative relationships were found between age and discourtesy as well as between age and direct hostility. There were minor differences in the results from the Pearson correlation analysis and the CFA which could be due to some covariation between variables.
The negative correlation between age and discourtesy means that older, compared with younger, people get less angry at others' discourteous behaviors. This result is consistent with the studies by Brandenburg & Oehl (2021) in Germany, Sullman (2006) in New Zealand, Sullman et al. (2007) in Spain and Sullman et al. (2014) in Malaysia, but contrary with results by Matović (2020) in Serbia. The negative correlation between age and direct hostility also means that older, compared with younger people, get less angry at others' direct hostile behaviors. Lower anger in older drivers might be due to better emotion management in higher ages as shown by Saraee et al., (2020).
As in all surveys, this study is based on self-reports, which rely on participants’ honesty and ability to recall, or imagine, specific situations. Also, as the amount of anger could be experienced differently by different people the steps in the DAS-scale do not necessarily correspond to the same feeling. Another limitation is that the participants were not randomly selected which means that the results cannot be generalized to the whole population of Iranian drivers. However, we have no reason to believe that there is systematic bias in the answers of those who participated in the study. Finally, it is shown that the results in this study are in line with previous studies using the DAS, which strengthens the results of the present study.
5. Conclusion
To sum up, this study revealed a reliable four-factor structure in Iran including 19 of the original 21 items from the UK DAS. The items in the first factor mostly referred to irresponsibility or a somehow discourtesy of other drivers and was therefore named discourtesy. The other three factors corresponded to the UK DAS factors direct hostility, reckless driving, and progress impeded. The results of the correlation analysis and the confirmatory factor analysis both show negative relationships between age and discourtesy as well as between age and direct hostility.
This study included a basic survey of an available widely used questionnaire namely the DAS inventory. Possessing such an instrument can give us the authority to embrace a variety of behavioral or personality traits in association with anger-related issues in the driving context. This gives us the chance to design effective interventions aimed at reducing anger and increasing traffic safety. In addition, now when the factor structure of the DAS in Iran has been revealed, this instrument can be used in further research, by combining it with the Driver Anger Expression Inventory (DAX; Deffenbacher, et al., 2002), to examine how drivers in Iran express their anger in different traffic situations. Cross-culturally, the results of this study can be compared with other countries in relation with some other driver characteristics such as sensation seeking, frustrating situations, or impulsivity. An interesting issue concerning the driver anger characteristics can be defined as the association between the related scales (i.e., DAS or DAX scales), with intentionally risky behaviors such as willingness to speed, to explore if and to what extent intention comprise driver’s anger-related features.
CRediT contribution
Hamid Reza Behnood: Conceptualization, Formal analysis, Investigation, Methodology, Project administration, Software, Writing – original draft, Writing – review & editing. Alireza Shiarsoda: Data curation, Formal analysis, Investigation, Software, Writing – original draft. Gunilla Björklund: Conceptualization, Methodology, Writing – review & editing. Henriette Wallén Warner: Conceptualization, Writing – review & editing.
Declaration of competing interests
The authors report no competing interests.
Declaration of generative AI use
The authors declare that no generative AI was used in preparing this work.
Prior dissemination declaration
This manuscript presents original work that has not been previously published or disseminated in any form.
Ethics statement
The methods for data collection, analysis, and preservation in the present study have been approved by the Institutional Review Board of Imam Khomeini International University (Minutes No. 1310 dated 20 July 2026).
Funding statement
No external funding was used in this research.
Data availability statement
The data are available on request to the authors.
Code availability statement
Code sharing is not applicable to this article, as no custom code was produced or used.
Editorial information
Handling editor: İbrahim Öztürk, University of Leeds, the United Kingdom.
Reviewers: Alev Aktaş, Sivas Cumhuriyet University, Türkiye; Iman Taheri Sarteshnizi, The University of Melbourne, Australia.
Submitted: 15 February 2026; Accepted: 15 July 2026; Published: 14 August 2026.