Analysis of driver reaction to a pedestrian who crosses the road outside designated crosswalks
Abstract
Pedestrians who crosses the road outside designated crosswalks represent a critical safety issue in urban environments, as they are often unexpected. Understanding how drivers perceive and respond to such events is essential for improving pedestrian safety and developing effective preventive measures. This study investigates driver perception and reaction processes in safety-critical scenarios involving the sudden appearance of a pedestrian crossing the roadway outside crosswalks, with particular attention to visual detection, reaction time, and evasive behaviour. For this study a controlled experiment was conducted using a driving simulator integrated with an eye-tracking system, allowing the joint collection of vehicle kinematic data and gaze behaviour. Two urban scenarios were designed, differing in the distance at which the pedestrian appeared: one providing sufficient stopping distance for a vehicle approaching at 50 km/h and thus placing 50 km/h speed limits, and a second scenario with a shorter appearance distance consistent with a stopping distance calculated with a speed of 30 km/h, with a 30 km/h speed limit. Driver gaze behaviour, perception time, reaction time, total perception–reaction time, and avoidance strategies were analysed under these conditions. The results confirm that crossings outside crosswalks represent a highly critical scenario, characterised by delayed visual detection, increased variability in driver responses, and a higher likelihood of delayed or ineffective evasive actions. Scenarios characterised by 50 km/h speed limits produced longer and more variable reaction times, whereas tighter spatiotemporal constraints (30 km/h scenario) resulted in faster and more consistent responses. Overall, the study highlights the need for interventions aimed at improving early pedestrian detection and driver awareness, supporting the potential role of infrastructural measures and advanced driver assistance systems in mitigating safety risks in non-designated crossing environments.
1. Introduction
1.1 Literature review
Road safety remains a major global challenge, with traffic accidents accounting for more than one million fatalities worldwide each year. A substantial body of literature indicates that many of these accidents have human error as a main contributory factor, highlighting the pivotal role of human factors in road safety analysis. Consequently, a comprehensive understanding of driver behaviour under varying traffic and environmental conditions is essential for the effective design, evaluation, and management of road infrastructure.
Several studies identify human factors as a key determinant of correct road perception (Campbell et al., 2012; Čičković, 2016; Green, 2018; Theeuwes, 2021) and, consequently, as a critical contributor to accident occurrence and safety assessment (Paliotto et al., 2024, 2025; Paliotto & Meocci, 2024). Among the various sources of human error, delays in responding to unexpected events within the road environment play a particularly significant role. These delays are commonly characterized by an increase of perception–reaction time (PRT) or any other change in it, defined as the time interval between the appearance of a stimulus and the initiation of the driver’s response, such as braking or steering. PRT is influenced by a wide range of factors (Campbell et al., 2012). Even relatively small increases in PRT can have substantial implications for road safety, as they directly affect stopping distance and a driver’s ability to avoid collisions (Green, 2000). Moreover, variability in PRT has been associated with degraded driving performance and an increased risk of accidents, particularly regarding near-miss events and traffic violations (Serda, 2020). The reaction to sudden stimuli can be due to an obstacle, an animal, or even another road user that is on the trajectory of the moving vehicles. One of the riskiest scenarios is the presence of a Vulnerable Road Users (VRUs) on the road and, such a circumstance reaches its apex considering pedestrians crossing the road. In that moment the pedestrian is crossing the road transversally, positioning exactly on the trajectory of the vehicle. A high number of accidents occurred between a car and a pedestrian who is crossing the road, both at signalized crosswalks, unsignalized crosswalks, or outside crosswalks. Previous research consistently indicates that a substantial proportion of pedestrian crashes occurs during road crossings away from designated facilities (Banerjee et al., 2021; Gitelman et al., 2012). Such situations are highly critical because pedestrian presence is often unexpected; drivers predominantly allocate their visual attention to vehicle interactions and roadway geometry rather than anticipating pedestrian movements in non-designated locations (Mukherjee et al., 2024) (Zhuang & Wu, 2011). Historical EU-wide crash studies from the CARE database show that between 40% and 50% of all pedestrian-motor vehicle collisions occur when the pedestrian is crossing away from a crossing facility (European Road Safety Observatory - Mobility & Transport - Road Safety, 2026)(Ambros et al., 2025) Similarly, historical data from the UK’s Department for Transport indicates that about 40% of pedestrian collisions occur away from designated facilities, whereas fewer than 10% occur directly on them. In Italy, according to comprehensive data from ACI-ISTAT (ISTAT & ACI, 2023, 2025), only about 19% of pedestrian fatalities occur while legally crossing on a designated crosswalk. However, the absolute number of serious injuries remains high on marked facilities. This phenomenon is deeply linked to a false sense of safety often experienced by pedestrians on designated crossings, which can degrade situational alertness. In reality, protection on these facilities is structurally weak and relies heavily on the mutual expectations and subsequent evasive actions of both the driver and the pedestrian (Ekman, 1996) (Kim & Yamashita, 2008). Consequently, understanding baseline driver reaction limits when these expectations fail—such as in midblock, occluded scenarios—is vital for designing effective safety interventions.
In this context, Bella and Silvestri (Bella & Silvestri, 2021) showed that drivers exhibit lower yielding rates and initiate evasive actions closer to the conflict point when pedestrians cross outside zebra crossings, indicating delayed detection and reduced expectancy. Similar findings were reported by Toxopeus et al. (Toxopeus et al., 2018), who highlighted that unexpected pedestrians crossing result in shorter available response times and critical interaction conditions. Research on driver–pedestrian communication further emphasizes the role of visual cues and expectancy (Huang et al., 2026). Rasouli et al. (Rasouli et al., 2017) demonstrated that although pedestrians tend to look toward oncoming traffic before crossing, driver reactions strongly depend on the ability to perceive the pedestrian and the available Time-to-Collision (TTC). This confirms that pedestrians appearing in non-designated areas reduce drivers’ predictive cues and delay decision-making processes.
Driving simulator studies combining eye-tracking and behavioural measures have further examined these dynamics. Banerjee et al. (Banerjee et al., 2021) reported that collision warning systems significantly influence driver attention allocation and braking behaviour, indicating that pedestrian detection and response may be increased in scenarios with technological support systems. Understanding driver behaviour and reactions in such circumstances is paramount to identifying effective countermeasures, including Advanced Driver Assistance Systems (ADAS) (Rigneault et al., 2014) like Automated Emergency Braking (AEB), which may anticipate the braking action, and pedestrian collision warning systems, which may optimize driver attention. The effects of warning systems on PRT were analysed by Bella and Silvestri (Bella & Silvestri, 2017), who demonstrated that both visual and auditory warnings significantly reduce reaction times. Notably, auditory warnings resulted in statistically lower PRT values than visual ones, as they allowed drivers to maintain visual focus on the roadway rather than redirecting attention toward an in-vehicle visual alert. Similar conclusions regarding the benefits of advanced driver support technologies have been validated in broader studies on Intelligent Transportation Systems (ITS) and ADAS (Rachakonda & Pawar, 2023; Scanlon et al., 2016).
1.2 Objective of the study and tools
This study focuses on a critical urban safety scenario involving a pedestrian suddenly crossing the roadway outside designated crosswalks, emerging from behind a parked car. Such situations, as highlighted by accident statistics (ISTAT & ACI, 2023, 2025) and previous research (Gitelman et al., 2012), are frequent in urban environments and are characterised by low driver expectancy, making pedestrian detection particularly challenging.
The objective of this research is to provide insights into the driver perception–reaction process under these critical conditions, with specific focus on the time intervals required to visually detect the pedestrian, perceive as hazard, and initiate a response. In addition, the study analyses the specific evasive manoeuvres adopted by drivers (i.e., braking vs. steering). Particular attention is dedicated to the vehicle speed, position, and drivers’ gaze location at the exact moment the pedestrian appears.
The experimental investigation was conducted at the Laboratory for Road Safety and Accident Investigation (LaSIS) of the University of Florence. LaSIS is equipped with a virtual reality driving simulator. It features a full-scale vehicle (Lancia Ypsilon) mounted on a Stewart platform with six degrees of freedom, capable of reproducing yaw, roll, and pitch movements, and a circular screen covering a 220° field of view. This setup allows for highly versatile testing of diverse geometric configurations within interactive environments under predetermined traffic and environmental conditions, utilizing standardized, controlled, and fully repeatable experimental procedures. To complement the driving simulator, participants wore Pupil Labs eye-tracking glasses (Tonsen et al., 2020) to monitor visual attention allocation. The experiment was part of a series of experiments built for the evaluation of driver reactions (Carini et al., 2026).
2. Methodology
2.1 Simulation set up and participants
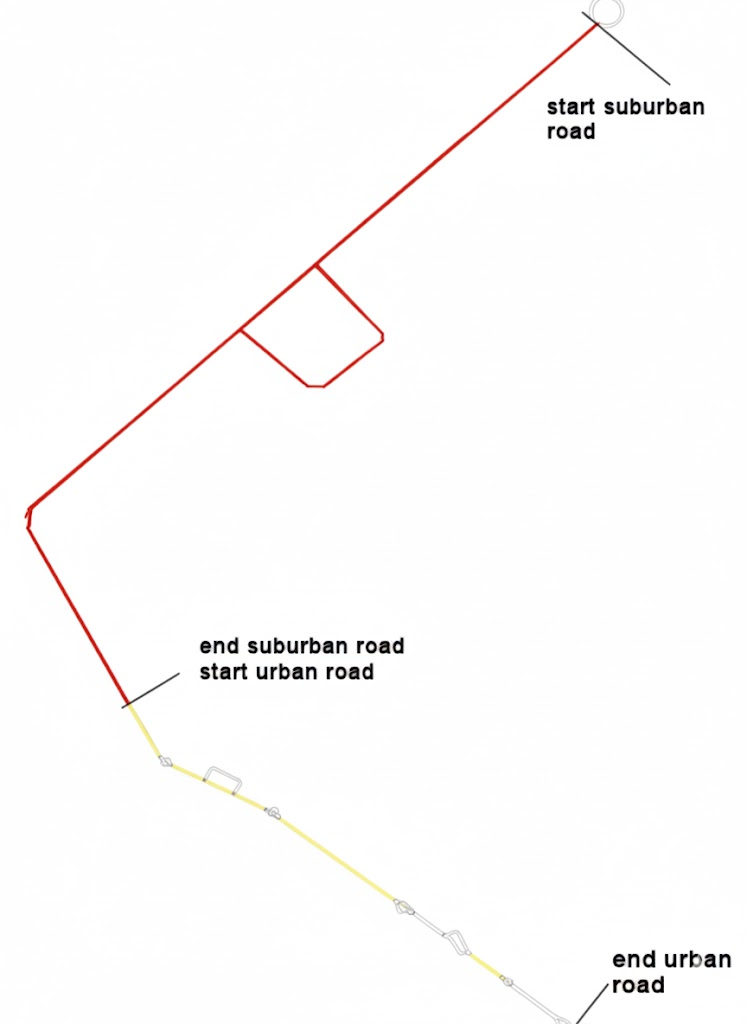
The scenario has been built considering an existing road, whose layout is composed of a single-carriageway, two-lane, two-way rural road followed by a single-carriageway, two-lane, two- way urban road section, which in the final part splits into two separated single lane carriageways separated by a raised median in the province of Grosseto (Italy). The cross section of the rural road has been defined according to the geometry of a real road. The road consists of two lanes each 4.00 m wide with very narrow shoulders (approximately 0.30 m).
The urban road consists of a single carriageway with one lane per direction, each approximately 3.75 m wide, except for a short final section where lane widths are reduced to 3.50 m and the lanes are separated by a central median. A minor urban road, used for the left-turn manoeuvre, has a width of approximately 3.00 m.
The environment around the road (buildings, trees, etc.) has been simplified to allow smooth simulation, while the main geometric and infrastructural elements have been retained to ensure a realistic driving experience. In all scenarios, a unidirectional traffic flow is present on the lane opposite to the one driven by the participants, to make the driving task more realistic. No vehicles are present in the participant’s lane, so as to avoid influencing the driver’s behaviour. In the urban section, pedestrians and cyclists were dynamically generated along the entire route to create a realistic driving environment and maintain a baseline cognitive workload. However, to avoid confounding variables or distractions, no other road users or cyclists were present in the immediate vicinity of the critical jaywalking event.
At the end of the urban section, an unexpected pedestrian crossing is introduced. The pedestrian starts the crossing manoeuvre suddenly, in the absence of a marked crosswalk. A planimetric view of the entire scenario, including both the extra-urban and urban sections, is provided in Figure 1.
2.1.1 The scenario setting
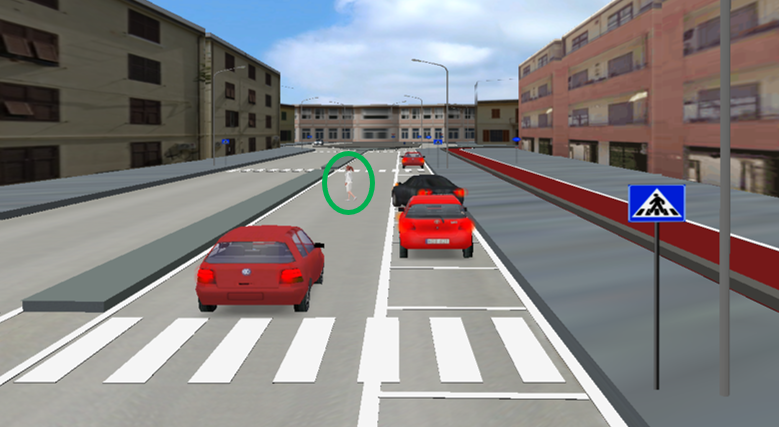
The experiment was designed to collect behavioural data related to drivers’ perceptual and reactive responses to the sudden appearance of a pedestrian in an urban driving environment. The critical event occurred outside a designated pedestrian crossing, with the pedestrian entering the roadway suddenly and without prior indication, start to cross from behind a parked car. The pedestrian speed was set at 2.00 m/s. An image showing the pedestrian crossing in front of the approaching ego vehicle is represented in Figure 2.
The pedestrian event was introduced only during the final run of the experiment, allowing participants first to become familiar with the driving environment. This design choice was adopted to minimise learning effects and to ensure that the recorded responses were primarily attributable to the pedestrian interaction.
Road geometry and environmental conditions were kept identical across all participants, while differences between two experimental groups (group 1 and group 2) were introduced exclusively through the imposed speed limits. Specifically, an 80 km/h speed limit was applied to all drivers in the rural section, whereas in the urban section speed limits of 50 km/h for Group B1 and 30 km/h for Group B2 were enforced. The speed limits were imposed only using vertical signs.
The timing of the pedestrian appearance was determined by computing a trigger based on the stopping distance, calculated in accordance with Italian standards as a function of vehicle speed (Ministero dei Trasporti, 2001). This approach ensured that the pedestrian event was activated under conditions consistent with normative safety criteria.
Based on the stopping distance calculations associated with the imposed speed limits, different trigger distances were defined for the two groups:
-
in group B1, the pedestrian trigger was activated when the ego vehicle was located at approximately 52 m from the pedestrian appearance point;
-
in group B2, the trigger was activated at approximately 28 m from the same point.
These distances correspond to the stopping distances computed for the two experimental conditions and were used as reference values for the definition of the scenarios. Although drivers could adopt different speeds during the simulation—thereby directly influencing the time and distance available to perform a manoeuvre—the predefined trigger distances provided a consistent and necessary reference framework for the experimental setup.
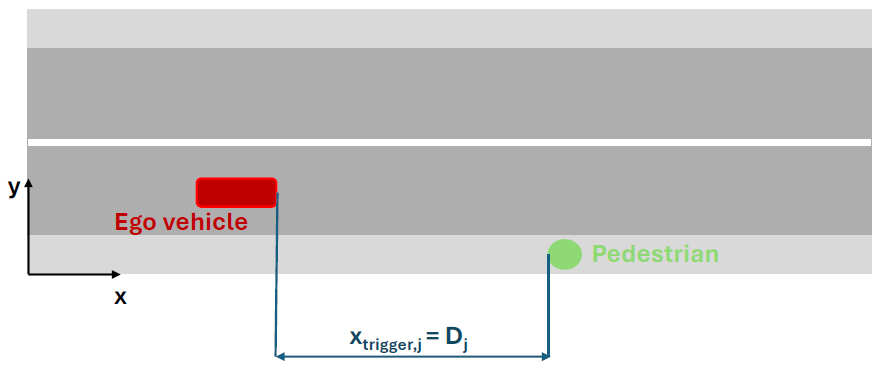
Figure 3 illustrates a schematic representation of the pedestrian scenario, including the pedestrian appearance point and the trigger distances defined for groups B1 and B2.
The statistics of the parameters used to define the scenario are summarised in Table 1, where:
-
Vlimit,j represents the urban speed limit imposed on group j.
-
xped represents the fixed location of the pedestrian appearance point along the urban segment,
-
xtrigger,j represents the distance between the ego-vehicle and the pedestrian appearance point when the pedestrian event is triggered for group j;
-
Dj represents the stopping distance calculated according to Italian standards for group j.
| Scenario | Parameter | Value | Unit |
|---|---|---|---|
| Both | xped | fixed | m |
| B1 | Vlimit,1 | 50 | km/h |
| xtrigger,1 = D1 | 52 | m | |
| B2 | Vlimit,2 | 30 | km/h |
| xtrigger,2 = D2 | 28 | m |
The parameters defining the pedestrian scenario were established on the basis of these reference distances and the imposed speed limits. The resulting experimental conditions enabled the investigation of both perception–reaction times (PRT) and drivers’ reaction strategies (e.g., braking or steering), as well as the overall outcome of the driver–pedestrian interaction.
Assuming that the driver is driving with a speed consistent with the speed limits, the TTC are 3.744 s for scenario B1 and 3.36 s for scenario B2.
TTC was calculated with the following relation:
\begin{eqnarray} TTC = D/v\tag{1} \end{eqnarray}
Where D is the trigger distance specified above (in meters) and v is the speed of the ego vehicle in m/s.
2.1.2 Participants
Participants were recruited on a voluntary basis. Prior to the experimental sessions, a screening phase was carried out to minimise the risk of simulator sickness and assessing that each participant fits the standard criteria for carrying out the simulation. Following this screening procedure, a total of 70 drivers with heterogeneous driving experience were initially selected. This sample size was defined to balance subdivision into two experimental groups (Group 1 and Group 2, each consisting of 35 participants), to satisfy minimum sample size requirements commonly recommended for driving simulator studies (Wang et al., 2023), and to compensate for potential withdrawals during the experiment.
During the experimental sessions, 14 participants were unable to complete the test due to simulator sickness and were therefore excluded from the analysis. Consequently, the final sample consisted of 56 drivers (44 males and 12 females). Most participants (96.43%) reported having driven on different types of road infrastructure in the year preceding the experiment, including urban, rural, and motorway environments. With specific reference to non-urban roads, 19.64% reported daily exposure, 50% reported driving at least once per week, and 30.36% reported driving approximately once per month.
Descriptive statistics concerning participants’ age, years of driving licence holding, and annual distance travelled are reported in Table 2 and Table 3.
| Age | Number of years having the license | |
|---|---|---|
| Average | 27.64 | 8.64 |
| Standard Deviation | 6.47 | 6.29 |
| Maximum | 56 | 32 |
| Minimum | 22 | 3 |
| < 5000 km/year | 5000 – 10 000 km/year | 10 000 – 15 000 km/year | > 20 000 km/year |
|---|---|---|---|
| 20 | 19 | 15 | 2 |
The previous tables underlines that participants were mainly young people, but with experience considering both the average number of years of license, and the average kms travelled in a year. This indicates that the participants should possess both good driving experience and strong perceptual skills.
2.2 Data elaboration
Following the simulation runs, data collected from both the driving simulator and the eye-tracking system were processed and analysed. The raw experimental dataset is publicly available in open access-form together with the description of the procedure adopted to synchronizing the tools (Paliotto, 2025).
2.2.1 Data from the simulator
For each participant and each scenario, the driving simulator recorded a set of kinematic and control-related variables, including the elapsed time from the start of the simulation, the x and y coordinates in the scenario reference system, vehicle speed, accelerator pedal position, brake pedal pressure, and steering wheel angle. All variables were sampled at a fixed temporal resolution of 0.05 s. As a result, the data acquisition was time-based rather than space based.
However, a spatially referenced dataset was required for the purposes of the subsequent analyses. To this end, the simulated road alignment was discretised using QGIS software by generating reference points every 0.5 m along the centreline. Simulator outputs were then associated with each reference point by assigning the temporally closest recorded data sample, whose coordinates do not necessarily coincide exactly with the predefined spatial location, with a possible error of less than 0.25 m, which translates in an error of about 0.03 s with a speed of 30 km/h.
2.2.2 Data from the eye-tracker
To evaluate the driver’s visual behaviour up to the hazard event, participants wore Pupil Labs eye-tracking glasses, recording gaze data at a sampling rate of 200 Hz. Although the system captures a wide array of oculomotor metrics, this study focuses exclusively on the temporal allocation of visual attention toward the hazard. Specifically, the time elapsed between the exact frame the pedestrian appears in the driver’s field of view and the instant the driver’s gaze first goes on the pedestrian. Fixations were identified using the Pupil Labs gaze-velocity threshold identification (I-VT) algorithm, setting a minimum fixation duration of 100 ms. All other non-consequential gaze metrics were excluded from the analysis to maintain a strict focus on hazard detection dynamics. Each measurement was associated with a timestamp indicating the exact time of acquisition. Timestamps were recorded using Unix time
2.3 Analysis of the outputs
The analysis focused on two main aspects: drivers’ perceptual and perceptual–reaction processes, and the type of manoeuvre adopted in response to the critical event. Drivers’ perception–reaction time (PRT) was analysed by identifying two main temporal components:
-
ΔTsee (perception time): the time required for the driver to direct their gaze towards the pedestrian after the pedestrian’s appearance;
-
ΔTreact (reaction time): the time elapsed between the moment the driver’s gaze reaches the pedestrian and the onset of the driver’s first control action.
Based on these components, the total perception–reaction time (ΔTtotal) was computed as the sum of ΔTsee and ΔTreact, corresponding to the time interval between the pedestrian’s appearance and the driver’s first reaction.
The type of reaction was classified into four categories:
-
Braking first: the driver initially applies braking and subsequently performs a steering manoeuvre;
-
Braking: the driver responds exclusively by braking;
-
Steering first: the driver initially performs a steering manoeuvre and subsequently applies braking;
-
Steering: the driver responds exclusively by steering.
To clearly identify while a braking or steering action took place, the following thresholds have been considered, based also on the simulator technical characteristics:
-
Brake and accelerator pedal: a variation of 0.05 clearly identifies a movement of the pedal;
-
Steering: a variation of 0.17 rad (10°) has been considered as a voluntary (even if unconscious) reaction.
Since steering measurements can be affected by signal noise, every identified 'first steering reaction' was manually validated through a review of the video recordings. A similar validation was not required for brake pressure.
2.3.1 Statistical Analysis
Conventional statistical techniques were employed to analyse the data, including parametric procedures appropriate for small sample sizes, such as the independent-samples t test. These methods were used to compare groups and to explore potential relationships between variables.
The purpose of the analysis was threefold: to characterise the sample, to detect differences between experimental groups, and to investigate associations among key temporal variables. The primary measures considered were ΔTsee, ΔTreact, and ΔTtotal, as defined earlier.
As a first step, descriptive statistics were computed separately for each group. For every variable, measures of central tendency and dispersion—including mean, median, standard deviation, minimum, and maximum—were obtained. Data distributions were visually examined using boxplots to highlight variability and identify possible outliers.
In addition to the quantitative evaluation, a qualitative assessment of drivers’ behavioural responses to the sudden appearance of a pedestrian was carried out. Driver reactions were classified into five categories: Steering, Steering First, Braking, Braking First, and Nothing. The latter category was assigned when no clear or unambiguous response could be identified.
Prior to inferential testing, assumptions of normality were examined using the Anderson-Darling test, complemented by visual inspection of Q–Q plots. To compare groups, variance homogeneity was assessed through Levene’s test. Depending on the outcomes of these preliminary checks, either a Welch T-test or the non-parametric Mann–Whitney U test was applied, ensuring the robustness of statistical comparisons.
Associations between selected variables were analysed separately using Spearman’s rank correlation coefficient (ρ), which is suitable for non-normally distributed or ordinal data. The following relationships were investigated:
-
ΔTreact and vehicle distance between the vehicle and the pedestrian at reaction onset;
-
ΔTreact and vehicle speed at the time the pedestrian was first detected;
-
ΔTreact and TTC.
For each pair of variables, two complementary analytical approaches were employed. Spearman’s rank correlation coefficient (ρ) was used to assess the presence and direction of monotonic associations, while simple linear regression was applied to explore the trend and consistency of these relationships. The coefficient of determination (R2) was used to quantify the proportion of variance explained by the linear model.
Spearman’s correlation was selected due to the presence of non-normal data distributions and potential outliers, which are common in behavioural datasets. The strength of the observed correlations was interpreted according to the classification proposed by Cohen (Cohen, 2013), widely adopted in behavioural and psychological research. According to this framework, correlation coefficients with absolute values below 0.1 are considered negligible, values between 0.1 and 0.3 indicate weak associations, values between 0.3 and 0.5 represent moderate relationships, and values above 0.5 denote strong relationships. Correlations exceeding 0.7 are described as very strong, while values approaching 1.0 indicate near-perfect associations. This classification provides a structured reference for assessing the relevance of the statistical relationships observed.
Although linear regression assumes a linear relationship between variables, it was used as an exploratory tool to facilitate comparisons between groups and to support the interpretation of the correlation results. All analyses were conducted separately for each group in order to highlight potential systematic differences in drivers’ visual behaviour and response strategies in the pedestrian appearance scenario.
Overall, this integrated analytical framework allowed for a detailed examination of group-level differences and behavioural dynamics, contributing to a deeper understanding of driver perception and reaction processes in critical interaction scenarios.
3. Results and discussion
Perception–reaction time (PRT) were analysed by considering the distributions of each experimental group (B1 and B2).
In group B1, eye-tracking data quality issues affected four participants, preventing reliable estimation of ΔTsee and ΔTreact. Similarly, in group B2, eye-tracking limitations were observed for two participants. These cases were therefore excluded from the corresponding analyses. The number of valid simulations retained for the statistical evaluation is reported in Table 4.
| Group | Participants | Simulations completed | Simulations with issues | Usable results |
|---|---|---|---|---|
| B1 | 35 | 28 | 3 | 25 |
| B2 | 35 | 28 | 4 | 24 |
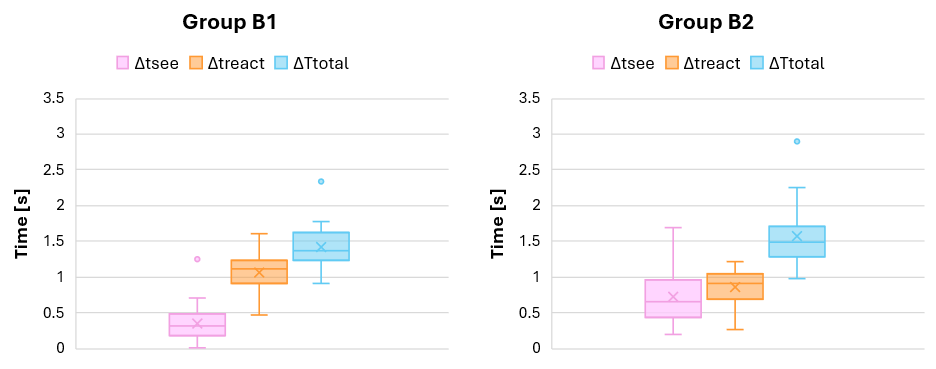
While the available simulations are those illustrated in Table 4, outlier were removed from the analysis of ΔTsee, ΔTreact, (and ΔTtotal, consequently) according to the boxplots of Figure 4. In the figure, the symbol “X” denotes the mean value, while the horizontal line within each box represents the median.
The boxplots illustrate the distribution of the three temporal variables (ΔTsee, ΔTreact, ΔTtotal) for scenarios B1 and B2, highlighting central tendency, variability, and potential extreme values.
Consequently, the following number of datasets have been considered:
-
ΔTsee: 24 datasets for B1, 24 datasets for B2;
-
ΔTreact: 21 datasets for B1, 20 datasets for B2. In these values “no response” reactions are excluded;
-
ΔTtotal: 21 datasets for B1, 20 datasets for B2. In these values “no response” reactions are excluded.
The descriptive statistics are numerically reported in Table 5.
| Group | Parameter | ΔTsee [s] | ΔTreact [s]* | ΔTtotal [s]* |
|---|---|---|---|---|
| B1 | Mean | 0.318 | 1.054 | 1.372 |
| St. Dev. | 0.198 | 0.331 | 0.225 | |
| Min. | 0.010 | 0.476 | 0.916 | |
| Max. | 0.710 | 1.616 | 1.776 | |
| B2 | Mean | 0.730 | 0.867 | 1.573 |
| St. Dev. | 0.359 | 0.225 | 0.428 | |
| Min. | 0.193 | 0.271 | 0.983 | |
| Max. | 1.689 | 1.209 | 2.898 |
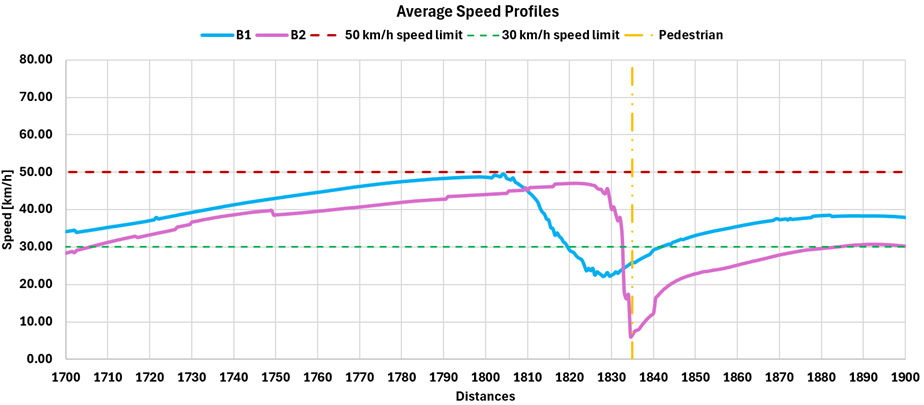
The first interesting finding—though not the primary focus of this study—is that drivers were largely unaffected by speed limits. Despite the different limits for scenario B1 (50 km/h) and B2 (30 km/h), participants maintained similar average speeds in both, as represented in Figure 5. This suggests that road geometry and environment exert a stronger influence on driver behaviour than signage. Consequently, scenario B2 proved to be more critical, as the pedestrian’s appearance distance was reduced while vehicle speeds remained high.
3.1 Analysis of the distributions of ΔTsee, ΔTreact, and ΔTtotal
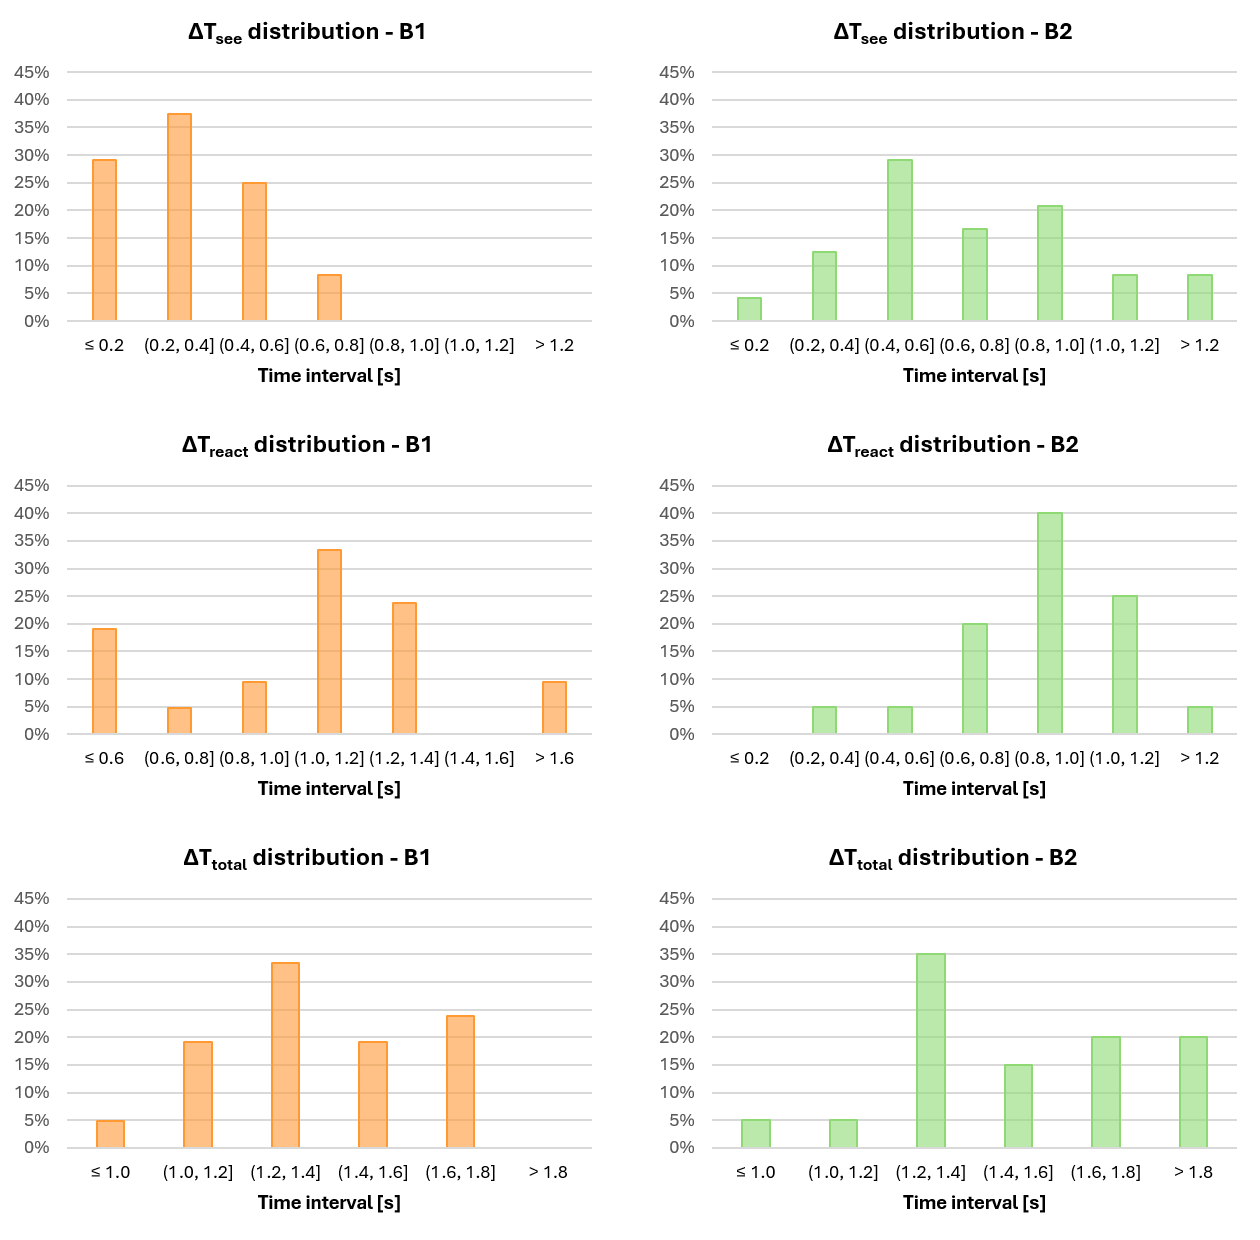
To characterise the distributional properties of the three temporal variables (ΔTsee, ΔTreact, and ΔTtotal) and to investigate potential differences in behavioural responses between the two experimental groups, an exploratory analysis was conducted using relative frequency histograms. The resulting distributions for each temporal variable, separately reported for groups B1 and B2, are shown in Figure 6. Among the simulations’ dataset, 3 participants of group B1 and 4 participants of group B2 do not react at all to the pedestrian. In this case, the data have been excluded by the analysis of , ΔTreact, and ΔTtotal.
In group B1, the distributions appear comparatively more compact and exhibit clearer central tendencies across all temporal variables. The values of ΔTsee are predominantly concentrated within the lower time intervals, indicating relatively rapid and consistent visual detection of the pedestrian. Similarly, ΔTreact shows a marked concentration within a limited range, suggesting a more homogeneous reaction process among participants. The distribution of ΔTtotal also appears relatively balanced, with most observations clustered around intermediate values, reflecting a consistent overall response sequence.
Conversely, group B2 is characterised by broader and more irregular distributions for ΔTsee and ΔTtotal, while ΔTreact follows a normal distribution around (0.8,1]. The distribution of ΔTtotal shows a greater spread towards higher time intervals and indicating longer and more heterogeneous response processes.
Overall, the distributions suggest greater inter-individual variability and less consistent temporal responses in group B2 compared to group B1, where reaction patterns appear more stable and concentrated.
To formally evaluate the normality of the data distributions and to support the selection of appropriate statistical tests, the Anderson-Darling test was applied to each variable for both experimental groups. The null hypothesis (Ho), assuming a normal distribution of the data, was considered acceptable for p-values < 0.05. The results are reported in Table 6.
| Group | Variable | A2 | p-value | Normality |
|---|---|---|---|---|
| B1 | ΔTsee | 0.914 | 0.724 | Rejected |
| ΔTreact | 0.246 | 0.733 | Not rejected | |
| ΔTtotal | 0.590 | 0.733 | Not rejected | |
| B2 | ΔTsee | 0.334 | 0.728 | Not rejected |
| ΔTreact | 0.252 | 0.733 | Not rejected | |
| ΔTtotal | 0.760 | 0.733 | Rejected |
The results indicated that, for all variables, the normality assumption was violated in at least one of the two groups. Specifically, ΔTsee did not follow a normal distribution in group B1, whereas ΔTtotal deviated from normality in group B2.
Following the assessment of normality using the Anderson-Darling test, the assumption of homogeneity of variances between the two experimental groups is evaluated. To this end, Levene’s test was applied to all temporal variables under investigation.
| Variable | Var(B1) [s2] | Var(B2) [s2] | Levene statistic | p-value | Homogeneity of variances |
|---|---|---|---|---|---|
| ΔTsee | 0.0408 | 0.1342 | 6.5901 | 0.0136 | Rejected |
| ΔTreact | 0.1151 | 0.0535 | 1.8907 | 0.1770 | Not rejected |
| ΔTtotal | 0.0925 | 0.1932 | 1.642 | 0.2074 | Not rejected |
As reported in Table 7, Levene’s test did not reveal statistically significant differences in variance between groups B1 and B2 for ΔTreact and ΔTtotal (p ≥ 0.05), while a difference in variance is evident for ΔTsee.
As the Anderson-Darling test indicated deviations from normality in at least one group for each temporal variable, the assumptions required for parametric testing were not consistently met. Consequently, between-group comparisons were performed using the non-parametric Mann–Whitney U test. Statistical significance was assessed using a conventional significance level of α = 0.05. The results of the Mann–Whitney U test are reported in Table 8.
| Variable | U statistic | p-value | Statistical difference |
|---|---|---|---|
| ΔTsee [s] | 91 | < 0.001 | Significant |
| ΔTreact [s] | 300 | 0.0196 < 0.05 | Significant |
| ΔTtotal [s] | 154 | 0.148 > 0.05 | Not significant |
For ΔTsee, the Mann–Whitney U test yielded a U statistic of 113 with a p-value lower than 0.001, indicating a statistically significant difference between the two groups. This result suggests that the time required to visually detect the pedestrian differs systematically across the experimental conditions, likely reflecting variations in approach dynamics and visual processing demands. ΔTsee is larger in B2 than in B1, suggesting the need for more time to identify the pedestrian.
A statistically significant difference was also observed for ΔTreaction (U = 300, p = 0.0196), indicating that the time required to initiate a control response following pedestrian detection is not equivalent between groups B1 and B2.
In contrast, no statistically significant difference was found for ΔTtotal (U = 154, p = 0.148). However, this is mainly derived by the different distribution among the previous two times: ΔTsee is larger in B2 than in B1, while ΔTreaction is larger in B1 than in B2, so these two effects are overlaying and canceling each other out when building the sum.
Taken together, these results indicate that perception and reaction-related processes differ between groups B1 and B2; however, such differences do not translate into a statistically significant variation in the total perception–reaction time. This finding highlights the importance of analysing the individual temporal components separately, as compensatory mechanisms may occur across different stages of the driver’s response.
Descriptive statistics indicate shorter perception–reaction times in scenario B1 compared to B2, particularly with respect to ΔTtotal. Mean values show that drivers in B2 exhibit longer perception times (ΔTsee) and higher overall response durations, suggesting generally slower behavioural responses under this condition.
Standard deviation values reveal greater dispersion in scenario B2, especially for ΔTtotal, indicating increased inter-individual variability. The wide range between minimum and maximum values further supports the presence of diverse perceptual and response strategies among participants.
In Group B1, response times are generally shorter and more consistent across all variables. The distributions of ΔTsee and ΔTtotal are relatively compact, suggesting a more homogeneous behavioural response among drivers.
In group B2, higher central values for ΔTsee and ΔTtotal are observed and increased dispersion for all times. These visual patterns are consistent with the descriptive statistics presented in Table 5 and indicate a tendency toward a more heterogeneous perception–reaction behaviour compared to scenario B1.
Each recording was also deeply analysed to identify the reason of such a difference. The analysis underlines that the shorter times to see the pedestrian can be explained by the closer position of the gaze from the point of appearance. Most of the participants of scenario B1 were looking at the area of the car from behind which the pedestrian starts to move, thus the perception of the pedestrian was faster than in scenario B2. Indeed, in scenario B2, drivers are closer to the crossing point and their gaze is already directed somewhere further away. This underlines the importance of having the gaze closer to the possible critical location. The validity of these results can be generalized to contexts beyond this specific experiment. Each critical location (pedestrian crossings, intersections, accesses, etc.) must be the focus point of the driver gaze; eye-catching elements capturing the attention of the drivers, must be avoided.
3.2 Analysis of the reaction times
To further investigate the perceptual and reactive mechanisms involved in drivers’ responses to the sudden appearance of a pedestrian, the relationships between selected temporal variables and spatial or kinematic parameters were analysed, with the aim of identifying potential behavioural differences between the experimental groups B1 and B2.
The first relationship examined concerned the association between the driver’s reaction time following pedestrian perception (ΔTreact) and the spatial distance between the pedestrian and the driver at the time the pedestrian is seen (Ttrigger+ΔTsee). Figure 7 illustrates the corresponding scatter plots for groups B1 and B2, together with the fitted linear regression lines and the associated coefficients of determination (R2).
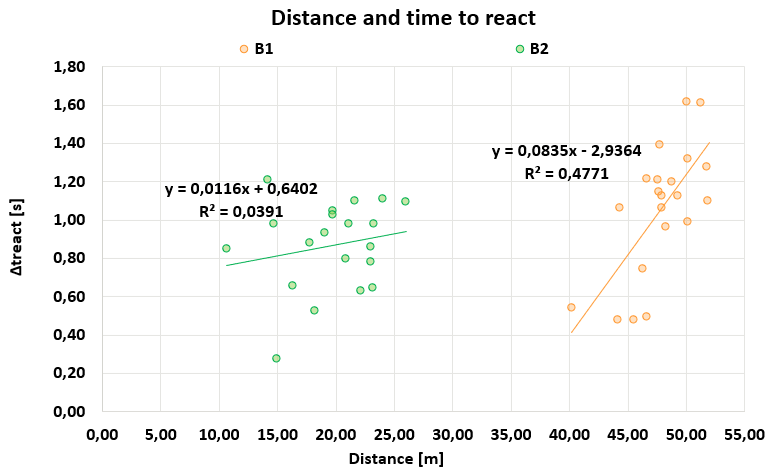
The linear regression results reported in Figure 7 indicate a positive association between pedestrian distance at the time of appearance and driver reaction time (ΔTreact) in both groups. However, the coefficients of determination (R2) are low for group B2 and moderate for B1, indicating that the linear models explain only a limited portion of the observed variability in reaction times.
Given the non-normal distribution of the data and the variability typical of behavioural measures, Spearman’s rank correlation coefficient (ρ) was used to quantify the monotonic association between the two variables. Positive correlations were observed in both groups, with ρ = 0.54 in Group B1 and ρ = 0.21 in Group B2, which according to Cohen’s classification correspond to a moderate and a small-to-moderate association, respectively.
The relationship between vehicle speed at the time the pedestrian is seen (Ttrigger+ΔTsee). and driver reaction time (ΔTreact) was also analysed for both experimental groups. Figure 8 shows the association between these variables for groups B1 and B2.
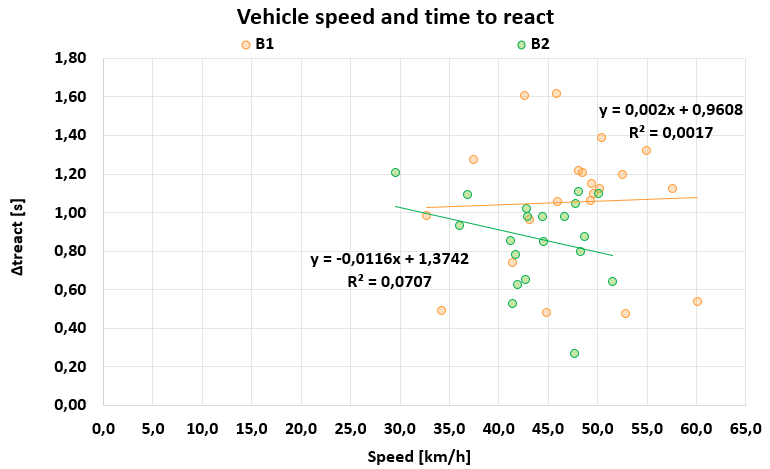
Spearman’s rank correlation analysis revealed weak positive associations in both groups, with correlation coefficients equal to ρ = 0.08 for group B1 and ρ = 0.12 for group B2. According to Cohen’s classification, these values correspond to small and very small correlations, indicating a limited monotonic relationship between vehicle speed and reaction time.
These findings are supported by the results of the simple linear regression analysis, which exhibited shallow slopes and very low coefficients of determination (R2) for both groups. The low R2 values indicate that vehicle speed does not account for the observed variability in reaction times. Drivers do not react on the basis of speed.
Because greater speed may be also associated to greater distance, the combined effect of vehicle speed and distance was investigated using the Time To Collision (TTC), defined as the ratio between the distance of the ego vehicle from the pedestrian and the ego vehicle speed at the time the pedestrian is seen (Ttrigger+ΔTsee).. TTC was thus used as an integrated measure of the temporal margin available to the driver at the onset of the critical event.
Figure 9 illustrates the relationship between TTC and reaction time (ΔTreaction) for groups B1 and B2.
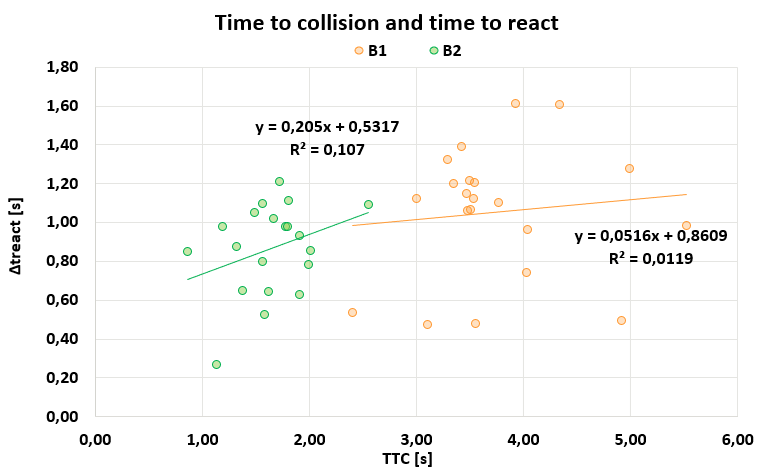
Spearman’s rank correlation analysis revealed a very weak positive association in group B1 (ρ = 0.01) and a medium to weak positive association in group B2 (ρ = 0.21). According to Cohen’s classification, both values fall within the trivial to small correlation range.
Consistently, the linear regression analysis resulted in very low coefficients of determination (R2) for both groups, indicating that TTC accounts for only a limited proportion of the variability observed in drivers’ reaction times. The results reported in Figure 9 therefore indicate that, within the considered pedestrian appearance scenario, TTC has a limited association with time to react and does not substantially explain the observed variability in response behaviour.
From a theoretical perspective, conditions B1 and B2 can be integrated, as inter-group variability is adequately captured within the Time-To-Collision (TTC) metric. Consequently, it may be hypothesized that lower TTC values correlate with decreased reaction times across specific levels of criticality, consistent with prior empirical findings. This has been analysed and it is represented by Figure 10.
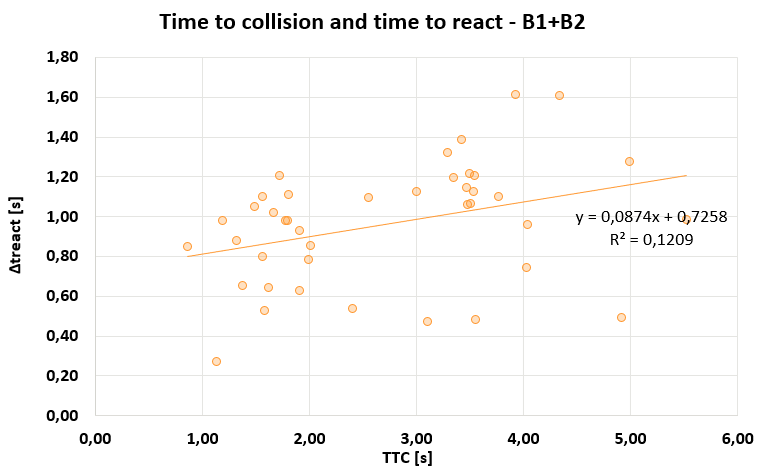
In this case, the results show a quite more powerful correlation among the data with a Spearman’s rank correlation ρ = 0.36. However, the relationship between TTC and reaction times typically attenuates beyond a given threshold, ultimately reaching a plateau defined by the lower limit of human driver reaction capabilities on one side, and the absence of urgency on the other.
3.3 Analysis of the reaction types
Drivers’ reaction types were also analysed for both experimental groups. Figure 10 presents the percentage distribution of the different reaction categories observed in groups B1 and B2.
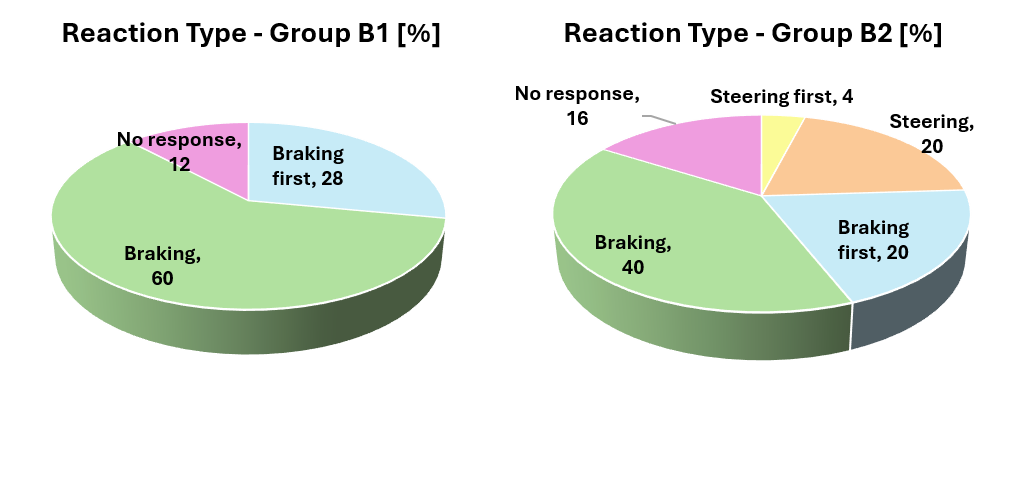
In group B1, responses involving braking represent the predominant reaction type. In particular, the “Braking” manoeuvre accounts for the 60% of the observed responses, followed by “Braking first” actions, which represent about 28% of cases. Steering-based reactions are absent, while a limited proportion of cases (12%) is classified as “No response”, indicating the absence of a clear evasive response.
In group B2, reaction strategies appear more heterogeneous. Only-braking response still constitute a substantial share of driver behaviour (40%), but a higher occurrence of “No response” responses is observed (16%), suggesting delayed or absent reactions in a considerable proportion of trials. Steering manoeuvres account for approximately 20% of responses, the same as “Braking first” actions are less frequent (20%), and “Steering first” represents a marginal proportion.
To further explore how reaction strategies relate to response timing, the time to react (ΔTreact) was examined across the different reaction categories, excluding cases classified as “Nothing”. Figure 11 presents boxplots of reaction time by reaction type, reported separately for groups B1 and B2.
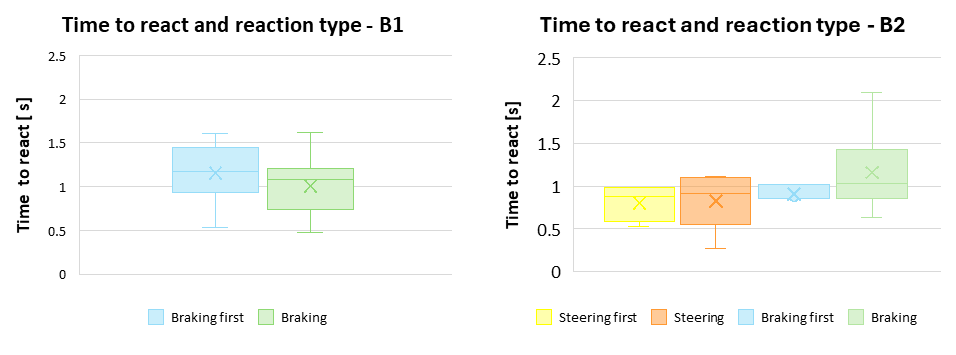
In group B1, only braking-related reaction types are observed. Reaction times associated with “Braking first” and “Braking” appear comparable, with similar central values, indicating limited differences in the time to react between these two manoeuvres. In group B2, a broader range of reaction strategies is observed, including both steering- and braking-based responses. Steering manoeuvres tend to be associated with shorter times to react compared to braking manoeuvres, while braking-related responses exhibit higher central values and greater dispersion, reflecting increased variability in response timing.
The boxplots also indicate a larger overall spread of reaction times in group B2 compared to group B1, particularly for braking manoeuvres. Given the limited number of observations within some reaction categories, these results are intended for descriptive purposes only, and no statistical comparisons are performed.
To further investigate differences in driving behaviour between the two groups, the average driving behaviour is analysed separately for each group. For groups B1 and B2, mean profiles of vehicle speed, accelerator pedal input, brake pedal input, and steering wheel activity are computed as a function of distance along the route and are shown in Figure 12 and Figure 13. The figures focus exclusively on the final segment of the route, which corresponds to the road section where the pedestrian appears.
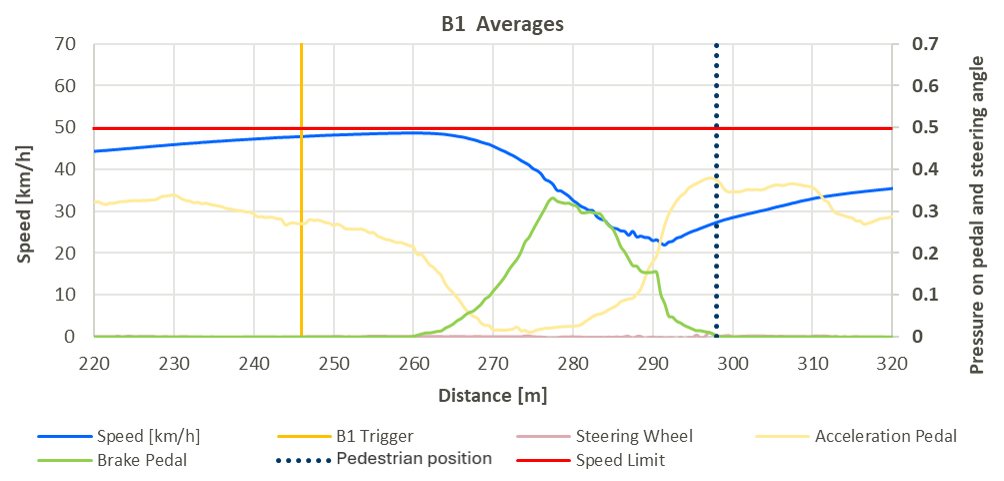
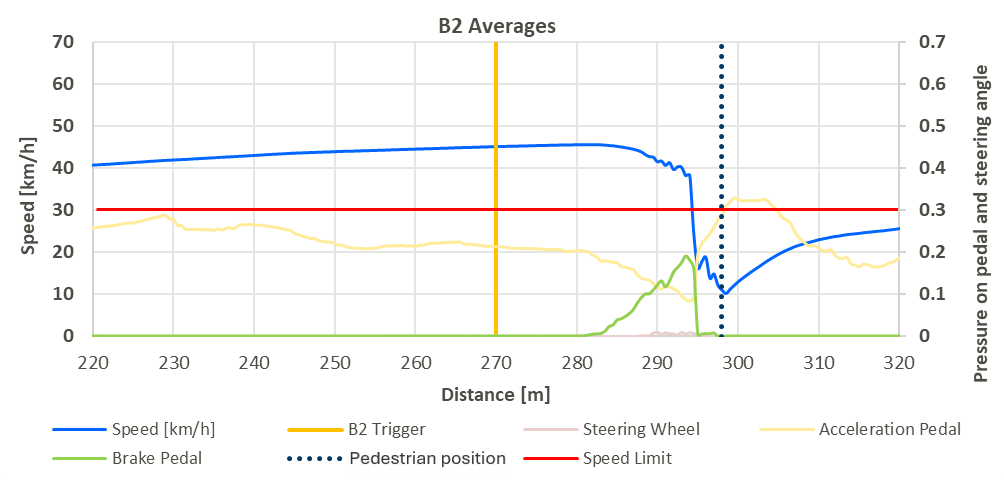
Although the average values do not exactly reflect the trend of the parameters for each user, the two graphs, which are very different from each other, highlight how in the two scenarios, overall the two reactions are very different near the crossing point, and very similar in the preceding section.
In group B1, during the segment preceding the pedestrian appearance, drivers generally maintained speeds that were consistent with the imposed limit, with average values slightly below 50 km/h. Following trigger activation, braking responses were typically progressive and allowed drivers to substantially reduce speed, resulting in the vehicle slowing down sufficiently to avoid the collision or being brought to a stop before reaching the pedestrian in all observed cases.
In contrast, in group B2, although the urban speed limit was set to 30 km/h, the average approach speed was notably higher than the imposed limit and comparable to that observed in group B1. In this group, braking responses tended to occur later and were often more abrupt, leading to a reduced available reaction window, which in many cases appears insufficient to stop the vehicle before the point of collision with the pedestrian.
The differences observed in the speed profiles and vehicle control responses are reflected in the outcomes of the pedestrian interaction. While no pedestrian impacts were observed in group B1, pedestrian impacts occurred in approximately 80% of the simulations in group B2. These results suggest that higher approach speeds, combined with reduced reaction margins, are associated with more critical safety outcomes in the pedestrian appearance scenario.
3.4 Discussion of the results
The adopted methodological framework proved effective in identifying both general behavioural patterns and inter-individual variability in driver responses to the sudden appearance of a pedestrian outside designated crosswalks. The combined use of descriptive statistics, distributional analyses, and non-parametric tests ensured a robust interpretation of perception–reaction processes, accounting for the non-normality and variability typical of behavioural data in safety-critical driving scenarios (Green, 2000; Han et al., 2021).
The analysis of perception time (ΔTsee) revealed significantly longer detection times in group B2. The comparison of the two groups in the rural area, where speed limits were 80 km/h for both the groups, and where other perceptual tasks and activities were requested to the participants, reveals that no differences are present between group B1 and group B2 in terms of perception abilities. Consequently, the difference in the perception time, lays in the different position of the pedestrian in the field of view of the driver, when the pedestrian starts crossing the carriageway. The analysis indicates that shorter detection times for the pedestrian are due to the proximity of the driver's gaze to the point of appearance. In scenario B1, about half of the participants were looking toward the parked vehicle, while the others were looking at the road. Even in the latter situation, the parked car was located very close to the centre of the field of view, because of the distance, thus, when the pedestrian appeared, she was not in the peripheral field of view. This leads to a faster perception than in scenario B2. In B2, drivers were closer to the crossing point, but their gaze was already directed further down the road. This underscores the critical importance of aligning a driver's focal point with potential hazard locations. These results can be generalized beyond this specific study: every potential conflict point (pedestrian crossings, intersections, etc.) must remain the driver's primary focus, and "eye-catching" distractions must be minimized.
The broader distributions and increased dispersion observed in group B2 further indicate higher inter-individual variability in perceptual processing, consistent with reduced driver expectancy and less systematic visual scanning behaviour, as reported in previous hazard perception studies (Crundall, 2016; Hirano et al., 2023).
The reaction time following the pedestrian detection (ΔTreact) has shown few differences between groups. This finding suggests that this type of reaction is more dictated by human physical constraints rather than the specific nature of the critical situation, as both the reaction times distributions are very similar. It must be underlined that both the scenarios were structured to be critical if the driver drives with a speed close to the speed limits.
Finally, no statistically significant difference was observed for the total perception–reaction time (ΔTtotal), indicating that perceptual and motor components may partially compensate when the response process is considered. This supports previous evidence that aggregated PRT measures may mask differences occurring at individual response stages (Green, 2000).
Reaction strategy analysis further highlighted differences between groups. In group B1, braking-related manoeuvres were predominant and consistently effective in avoiding pedestrian impacts. In contrast, group B2 exhibited more heterogeneous responses, including a substantial proportion of delayed or absent evasive actions, a behaviour previously associated with increased collision likelihood in pedestrian scenarios(Jurecki & Stańczyk, 2014). While braking has often been reported as the dominant response to pedestrian hazards, steering-based reactions may emerge more rapidly in situations where drivers are already engaged in steering actions, as shown by Li et al. (Li et al., 2019).
Correlation and regression analyses indicated that reaction time is moderately associated with pedestrian distance from the ego vehicle at the time they are seen for group B1. This cannot be said for group B2 where there a correlation cannot be seen. Considering the TTC, when the two groups are considered alone, the relationship between TTC and reaction time (Δtreact) is very poor, but it increases considering both groups together. This finding is partially consistent with previous studies reporting that the greater the TTC the greater the reaction time (Jurecki et al., 2017).
Overall, the results confirm that pedestrians who cross outside designated crosswalks represent a highly critical safety condition, especially when combined with higher approach speeds and reduced reaction margins. In agreement with prior human-factors-based safety research, the findings emphasise the predominance of perceptual and behavioural processes over purely kinematic variables in shaping driver responses (Crundall, 2016). These results underline the need for interventions aimed at improving early pedestrian detection and driver awareness. Moreover, efforts must be made to improve also pedestrian awareness of the dangers of crossing the road under such circumstances.
3.4.1 Limitations and implications
Despite the strengths of the experimental design, some limitations related to the adopted framework should be acknowledged. The study was conducted in a driving simulator environment which, while not fully reproducing real-world driving conditions, provides a validated setting for behavioural analysis and enables a high level of experimental control, particularly for the systematic manipulation of pedestrian appearance scenarios.
The sample size, consistent with comparable simulator-based and eye-tracking studies, limits the generalisability of the results. In addition, the limited number of observations within certain reaction categories constrained some inferential analyses. Nevertheless, the findings offer relevant insights into driver perceptual and behavioural responses to pedestrians crossing outside zebra markings.
The authors also considered investigating driver reactions to pedestrians crossing at marked crosswalks. However, as the experiment had to operate within the specific requirements of the European project V4SAFETY, it was decided not to introduce additional critical events. This choice was further supported by the need to avoid potential bias; incorporating a second critical event within the same simulation could have sensitized the driver, thereby compromising the authenticity of their reaction.
While the two events would not have been identical—one involving a designated crosswalk and the other an unmarked crossing—their inherent similarity would likely have increased the drivers' situational awareness regarding the roadside, leading to an unwanted learning effect. Although creating a separate scenario with a different cohort of participants was a potential solution, the project’s timeline and the challenges associated with recruitment led to this approach being discarded.
Moreover, there were concerns regarding the utility of the results. While driver behaviour when approaching a marked crossing is of great interest, comparing it to an unmarked crossing can be problematic. Most drivers instinctively scan for pedestrians and may decelerate when approaching a marked crosswalk (Meocci et al., 2024), even in the absence of a pedestrian. Consequently, such an event may not qualify as a "sudden" crossing, creating a condition fundamentally different from the one under study and thus complicating a direct comparison.
For the reasons listed above, the investigation of drivers’ behaviour approaching pedestrian crossing has been deferred to future experimental studies.
4. Conclusions
This study examined driver perception and reaction processes in safety-critical urban scenarios involving the sudden appearance of a pedestrian crossing outside designated crosswalks. Using a high-fidelity driving simulator combined with eye-tracking technology, the analysis provided detailed insights into visual attention, perception timing, and behavioural responses under unexpected pedestrian conflict conditions.
The results offer empirical data that corroborate existing literature while contributing new insights to this field of research. Moreover, they confirm that crossings occurring outside zebra markings represent a highly critical safety scenario, particularly when associated with reduced driver expectancy and limited reaction margins. Differences in the trigger time position between scenario B1 and B2 and, consequently the position of the pedestrian in the field of view of the driver, influence the perception. A first consequence, which has been not directly analysed in this study and may appear trivial, is the critical importance of aligning the driver's focal point with potential hazard locations, because sometimes eye-catcher and attractor can be positioned close to hazardous location, causing the driver to focus the attention on the objects and not on the dangerous elements. The present study confirms what already discussed in (Carini et al., 2026) that the position of the pedestrian in the field of view influence the perception time. Consequently, infrastructure design should prioritize 'visual cues' that naturally steer the driver’s gaze toward crossing entries rather than distal points on the horizon.
Another interesting finding is that under critical (scenario B1) and supercritical (scenario B2) conditions, reaction times are very similar, with a slight increase under supercritical conditions. Consequently, the main difference in PRT between the two groups was observed to be driven mainly by perception time.
Furthermore, the findings highlight a critical lesson regarding speed compliance in urban environments. In the 30 km/h scenario (B2), a substantial portion of participants failed to fully comply with the lower speed limit. This lack of compliance directly led to severely degraded initial Time-to-Collision (TTC) margins at the moment the pedestrian emerged from behind the parked vehicle.
If drivers in the B2 scenario had strictly adhered to the 30 km/h limit, the physics of the perception-reaction loop would have yielded different and safer outcomes, drastically compressing the required stopping distances and potentially eliminating collisions. This underscores a vital policy implication: the implementation of 30 km/h zones to protect vulnerable road users cannot rely solely on passive vertical signage. To effectively mitigate visual occlusion hazards and human reaction constraints, lower speed limits must be structurally enforced through physical traffic calming measures (e.g., speed humps, chicanes, road narrowing) or active automated enforcement, ensuring that the theoretical safety margins designed into the infrastructure are strictly maintained in practice.
Overall, this study contributes to a better understanding of driver–pedestrian interactions in unexpected crossing scenarios, providing evidence to support the development of more effective pedestrian safety measures. These measures include continuous attention to pedestrian education and awareness. In any case, in the present experiment, pedestrians were found to be the primary risk factor, as it is the pedestrian who performs an extremely hazardous maneuver. Indeed, where parking spaces are present, it is not feasible to install barriers to prevent pedestrians from crossing. From a safety perspective, the findings also highlight the importance of limiting pedestrians to cross outside designated or controlled facilities and indicate a potential role for Advanced Driver Assistance Systems (ADAS) in mitigating these critical situations through timely warnings or interventions before drivers reach their reaction threshold.
CRediT contribution
Andrea Paliotto: Conceptualization, Data curation, Formal analysis, Investigation, Methodology, Software, Supervision, Validation, Visualization, Writing – original draft, Writing – review & editing. Costanza Carini: Data curation, Formal analysis, Validation, Visualization, Writing – original draft. Monica Meocci: Conceptualization, Formal analysis, Funding acquisition, Methodology, Project administration, Supervision, Validation, Visualization, Writing – review & editing. Camilla Mazzi: Data curation, Formal analysis, Validation, Visualization, Writing – original draft. Francesca La Torre: Funding acquisition, Project administration, Supervision, Writing – review & editing. Alessandro Marradi: Project administration, Writing – review & editing.
Declaration of competing interests
The authors report no competing interests.
Declaration of generative AI use
The authors declare that no generative AI was used in preparing this work.
Prior dissemination declaration
An earlier version of this work was presented at the 37th ICTCT conference, held in Berlin, Germany, on 23–24 October 2025.
Ethics statement
The methods for data collection in the present study have been by Ethical Committee for Research of the University of Florence, among the transmission of “Visto di Conformità Parere della Commissione Etica per la Ricerca n.284 del 20 Ottobre 2023”.
Funding statement
The research has been carried out with funding from the Horizon Europe project V4SAFETY (https://doi.org/10.3030/101075068), grant agreement 101075068.
Data availability statement
The data supporting the findings of this study are available at Zenodo (https://doi.org/10.5281/zenodo.15433637), shared under the Creative Commons Attribution 4.0 International licence, which permits reuse and distribution provided proper attribution is given.
Editorial information
Guest editor: Peter Wagner, German Aerospace Center (DLR), Germany (retired).
Reviewers: Lars Ekman, Swedish Transport Administration, Sweden (retired); Thomas Streubel, Volvo Cars, Sweden.
Submitted: 30 January 2026; Accepted: 6 September 2026; Published: 18 September 2026.