Single- and non-single bicycle crashes at urban intersections: influential factors and comparison of ambulance- and police-reported crash datasets
Abstract
Widespread and common usage of bicycles makes cycling safety a critical issue, as over the years, cyclists’ injuries and fatalities have been rising. The majority of cycling safety literature justifiably focuses on the dangers posed by motor vehicles; however, single-bicycle crashes (SBCs) are a major portion of injuries and hospitalisations in the Netherlands. To address this gap, this study has a twofold objectives: 1) to compare SBCs and Non-SBCs in the police- and ambulance-reported crash datasets, and 2) to identify and examine different factors contributing to SBCs and Non-SBCs at urban intersections with 30 km/h and 50 km/h speed limits. For this purpose, we compared SBCs with non-SBCs (cyclist crashes involving other vehicles) by modelling the cyclist crash occurrence at urban intersections. This allowed estimating the effects of different factors associated with the built environment, infrastructure, and traffic exposure. To address the underreporting problem associated with police-reported datasets, we used ambulance dataset collected at the Flevoland region of the Netherlands. Results revealed that traffic and cycling volumes, as well as cycling infrastructure, have the most impact on increasing bicycle-involved crash counts. Furthermore, proximity to destinations is proved to be relevant, depending on the specific destination and type of crash it has an effect on. Traffic volume showed to be most relevant for Non-SBCs at 50 km/h roads, while cycling infrastructure had an important effect both on SBCs and Non-SBCs.
1. Introduction
Bicycles are one of the main modes of transport in the Netherlands. In 2022, 4.8 billion trips were made by bicycles, covering 18.2 billion kilometres and accounting for 28% of all journeys (de Haas & Kolkowski, 2023). This widespread and common usage of bicycles makes cycling safety a critical issue, as over the years, cyclists’ injuries and fatalities have been rising (Oude Mulders & Odijk, 2025). The majority of cycling safety literature justifiably focuses on the dangers posed by motor vehicles; however, single-bicycle crashes (SBCs) are a major portion of injuries and hospitalisations in the Netherlands (SWOV, 2021) and have increasingly received attention internationally (Asadi et al., 2022; Møller et al., 2021). Moreover, the number of fatalities due to SBCs has been on the rise despite an overall reduction in the number of cyclist fatalities (Utriainen et al., 2022).
Even though SBCs can occur along road sections as well as intersections, the latter ones are a relevant subset of the problem. At intersections, cyclist face changes in priority, different geometries and surfaces, multiple conflict points, kerbs, and interaction with other cyclists and pedestrians (Møller et al., 2021). These factors are of importance not only for crashes where motor vehicles are involved, but also for instances where loss of control, fall mechanisms, or simply getting on and off the bicycle are at the root of the crash. As reported by Institute for Road Safety Research of the Netherlands (SWOV, 2022), one third of all road deaths are attributed to crossings, specifically urban ones. Furthermore, cyclists are most common in infrastructure with 30 km/h and 50 km/h speed limits (SWOV, 2020).
Given the growing problem of SBCs, the main objective of this study is twofold: 1) to compare SBCs and Non-SBCs in the police- and ambulance-reported crash datasets, and 2) to identify and examine different factors contributing to SBCs and Non-SBCs at urban intersections with 30 km/h and 50 km/h speed limits. For this purpose, we compared SBCs with non-SBCs (cyclist crashes involving other vehicles) and we modelled crash occurrence at urban intersections, allowing to estimate the effects of different factors associated with the built environment, infrastructure, and traffic exposure. To address the underreporting problem associated with police-reported datasets, we used ambulance dataset collected at the Flevoland region of the Netherlands. While past studies have used hospital or emergency department data to analyse cyclist crashes and their relation to built environment factors, to the authors’ knowledge, research using ambulance data remains limited (Asadi et al., 2022; Schermers & van Petegem, 2013). Hospital-based datasets provide valuable information on injury outcomes, but generally require linkage to other data sources to obtain crash-location (Soltani et al., 2022). Ambulance records, by contrast, contain the location of the incident including coordinates (Olesen et al., 2025). This is particularly relevant for studies of single-bicycle crashes, where crash -location information is essential for understanding the influence of the built environment.
1.1 Single bicycle crashes
SBCs are crashes which involve no other vehicle (motorised or non-motorised), and are often attributed to infrastructure, cycling behaviour, or road conditions (Schepers & Wolt, 2012). These crashes result in a significant portion of cyclist injuries and fatalities (ranging from 60% to 95%), but are often overlooked (Schepers & Wolt, 2012). SBCs can result in severe injuries and the rates of fatal injury and non-fatal injury per kilometre travelled and per trip are shown to be higher for cyclists than for car users (Utriainen et al., 2022). Furthermore, literature has a consensus on the problem of underreporting of SBCs (Beck et al., 2019; Schepers et al., 2015). According to previous research, only 10% of these crashes are recorded in police databases (Boele-Vos & van Schagen, 2024). Considering that the SBCs are severely underreported in crash datasets, the real scale of the problem is likely much bigger than what is apparent in official statistics (Beck et al., 2019; Utriainen et al., 2022).
In the Netherlands, it is reported that cyclist crashes and injuries are most common at urban intersections (Kennisnetwerk-SPV, 2022), where roads usually have 30 km/h and 50 km/h speed limits. The number of cyclist fatalities is also higher at intersections than in road sections (i.e., 54% on average) (SWOV, 2022). Over the years, there have been attempts to develop models for the assessment of cyclists crash risk (Reurings & Janssen, 2007; Schermers & van Petegem, 2013). However, these efforts suffered from the lack of data availability which complicated the inclusion of factors that can be influential in cyclists’ crashes. Moreover, majority of the literature relies on police-reported crash data; however, severe underreporting makes studies based on police data prone to a less accurate representation of the extent or nature of the problem (Utriainen et al., 2022).
1.2 Factors affecting SBCs and non-SBCs
Mainly, there are two groups of causes of SBCs (Schepers & Wolt, 2012): direct causes and latent factors. On the one hand, direct causes take place right before the crash and are related to infrastructure, the cyclist, or the bicycle. Latent factors, on the other hand, are causes that might have previously been present in the system such as infrastructure design decisions. Moreover, circumstances and factors such as age, gender, skills, lighting condition, road geometry, type of bicycle, and familiarity with the location are also reported to be influential on both SBCs and non-SBCs. Table 1 shows different factors affecting SBCs and Non-SBCs, and potential causes behind these crashes.
| Category | Factor | Consequences | Source |
|---|---|---|---|
| Infrastructure Factors | Road Surface/ Conditions | Loss of control, skidding, sudden braking, descents, and wet/slippery roads increase SBC risk. | (Beck et al., 2019; Myhrmann et al., 2021; Olesen et al., 2021; Utriainen et al., 2022) |
| Road Design & Maintenance | Seasonal effects; need for safer road entry/exit design. | (Møller et al., 2021; Utriainen et al., 2022) | |
| Cycling Infrastructure | Higher risk at intersections with two-way cycle paths; cycling facilities are crucial for safety. | (Eriksson et al., 2022; Schepers et al., 2011; Uijtdewilligen et al., 2024) | |
| Speed Environment | >80% fatalities at 50–70 km/h roads; vehicle speed major risk where bicycles have priority. | (Schepers, 2021; Schepers et al., 2011) | |
| Intersection Density | Higher density increases conflicts and crashes. | (Uijtdewilligen et al., 2024) | |
| Built Environment Factors | Population Density | Higher fatal accident rate in low-density areas. | (Schepers, 2021) |
| Proximity to Amenities | Facilities (commercial, rail, education, etc.) increase crash risk. | (Oude Mulders, 2024; Uijtdewilligen et al., 2024) | |
| Urban Context | Fatalities more frequent in built-up areas. | (Oude Mulders, 2024) | |
| Temporal & Demographic | Time of Day/Exposure | Peak-hour traffic increases crash risk; crashes more frequent in daylight/clear weather. | (Schepers & Wolt, 2012; Uijtdewilligen et al., 2024) |
| Age & Gender | SBCs mostly involve males, experienced & frequent cyclists; 50% of victims over 60 were cyclists. | (Algurén & Rizzi, 2022; Beck et al., 2019; Oude Mulders, 2024; Ulak et al., 2025) | |
| Injury Severity | SBCs have lower injury severity than Non-SBCs. | (Beck et al., 2019) |
2. Study Area and Data
This chapter outlines the datasets used in the analysis and modelling. Ambulance- and police-reported datasets are compared and linked to intersections in the province of Flevoland. Infrastructure and built-environment factors are also assigned to the intersections. A check for collinearity is carried out, yielding to a final list of variables.
2.1 Study area
This study was conducted using the data from the province of Flevoland as the study area, which is a relatively new province in the Netherlands. Flevoland was chosen because it is the only province in the Netherlands where ambulance-reported data are publicly available. The research is specifically focused on 30km/h and 50 km/h urban intersections in the province. Flevoland was developed after the Second World War, when the city plans were altered to accommodate for an increasing number of motorised vehicles. This resulted in a road network hierarchy aimed at the separation of traffic types at distributor roads. This separation became clearly visible in Flevoland, where cyclists and pedestrians were provided with separate infrastructure unlike historic city centres (Schepers, 2021).
Although there is a strong presence of separate infrastructure in the province, it is worth mentioning that this study unit of analysis (i.e. an intersection) is fairly small and observed within an established distance buffer. As a result, many local intersections are still classified as mixed, particularly within lower-speed residential environments since residential streets rarely have separated cycling infrastructure in the Netherlands.
2.2 Network datasets
The Dutch National Roads Database (National Wegenbestand, NWB) is an open database containing all public roads in the Netherlands. The database assigns individual IDs (WVK_ID) to each road section in the country and records the municipality responsible, as well as the type of road (BST_Code). Intersection IDs were extracted from this database. Intersection crashes were defined as the ones that fall within a range of 20 meters around the intersection (GGD-Flevoland, 2022). In order to later ease the filtering of crashes and built environment factors, a 20-meter buffer was generated around intersection points. Furthermore, to represent the intersection complexity, the number of roads intersecting with each buffer were counted and added as a variable. To avoid errors or over counting, the maximum road count was capped at 8. This was introduced given that, in several cases, the buffer also captured adjacent road sections that are not physically part of the intersection. Intersections with more than eight matched road segments were kept in the dataset, but their road-count variable used in the analysis was set to 8.
The speed limits for each road section were retrieved from the Dutch Road Characteristics Database (Wegenkenmerkendatabase, WKD), which is a collection of databases containing relevant road characteristics. These characteristics were linked to NWB database through the road section ID (Rijkswaterstaat, 2023). Based on these databases, a categorical variable was created to record the speed limits at each intersection, namely “All 30”, “All 50”, and “Mixed”. Mixed category consists of intersections, where both 30 km/h and 50 km/h roads are merging. The WKD dataset was also used to identify the presence of parking spaces at the intersections. This factor was included to represent road complexity, as parking can obstruct sight and create unusual manoeuvres (van Petegem & Uijtdewilligen, 2021). Based on this attribute, a binary variable is computed for all intersections stating the presence (and not the number) of parking spaces.
The data about the cycling network and infrastructure were retrieved from the Dutch Cyclist’s Union (Fietserbond, 2021). Three types of cycling infrastructure were created based on the data: separated bicycle tracks, bicycle lanes, and mixed traffic conditions, where mixed traffic conditions being the most common ones. The type of cycling infrastructure merging to intersections were assigned to each intersection.
2.3 Traffic and bicycle volumes
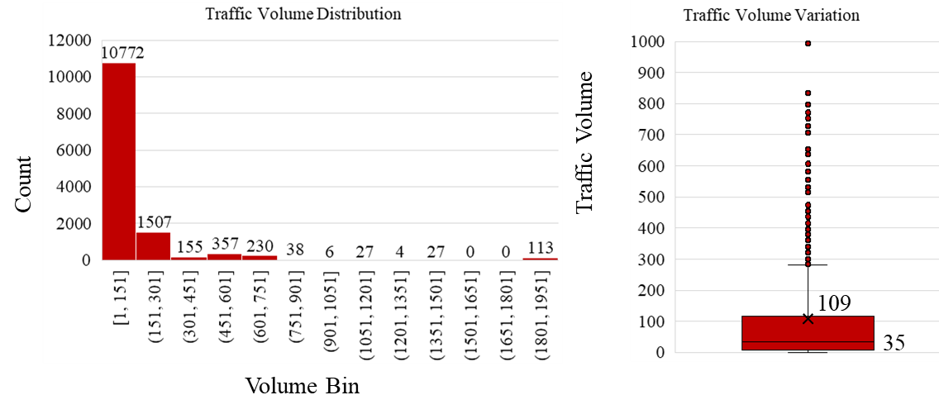
Traffic volumes were extracted from the traffic model VENOM. VENOM is a regional traffic model for strategic road and transport studies. It is used to investigate the effects of projects, measures, and policies on the current space, mobility, and infrastructure (Vervoerregio-Amsterdam, 2025). The dataset contains traffic volumes for both directions during morning and evening peaks. For main roads, the road links overlap with the NWB roads. However, in neighbourhood roads, an aggregated line is applied to the entire area. To deal with this, the aggregated volumes are distributed across the NWB roads per neighbourhood. Once all NWB roads are assigned their respective traffic volume, the volumes are assigned to each intersection. The distribution of traffic volume frequencies is shown as follows (Figure 1):
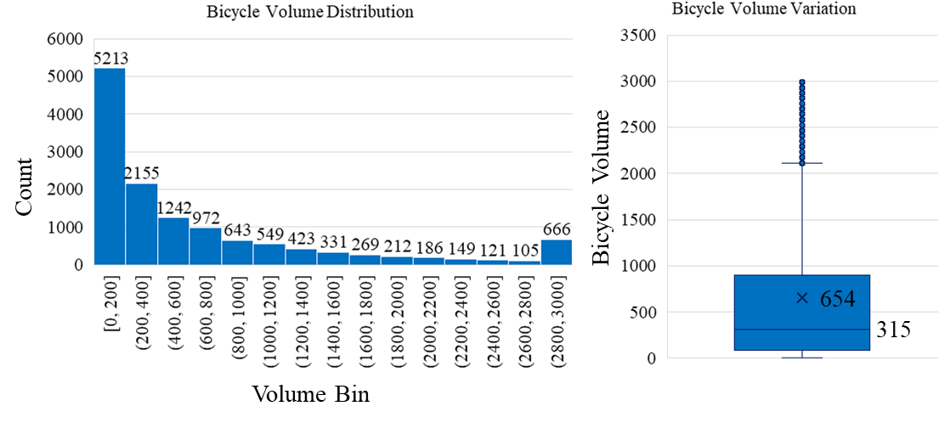
Bicycle volumes were retrieved from the data provided by private company VIA. VIA’s focus lies on road safety and software development for governments. Their Statistics section offer historical data, from which volumes can be obtained (VIA-Products, 2025). These volumes are estimated and historical values, assigned to road sections. Among other attributes, the dataset contains totals volume for each road section and both directions. These totals are related to bicycle path identifiers, and not to regular roads. Thus, through spatial operations, the volumes are transferred to the NWB road layer. Figure 2 shows the frequency of bicycle volumes. It can be seen that the majority of the traffic takes place at low levels of bicycle volume.
2.4 Built Environment Data
In Flevoland, 19 different land use types were identified and extracted from OpenStreetMap (OSM). These 19 types were aggregated into three categories to reduce the extensive granulation of the data. These categories are green (park, farmland, farmyard, forest, etc.), residential, and industry (industrial, commercial, retail). These groups were formed to avoid sparse categories. This means that low-intensity/non-residential land uses were called “green” while non-residential employment/commercial land uses were assigned to “industry”. For each intersection, the land use category was identified based on the category that overlaps with the 20-meter buffer of that intersection.
For the social and demographic data, CBS is the main provider in the Netherlands. CBS compiles statistics from individuals and entities through surveys, registers, and business records (CBS, 2022). In this research, the data used were aggregated in 100x100-meter squares by CBS. The data used were assigned to intersections based on spatial overlay with the so-mentioned buffers and the CBS grid. Hence, population and housing variables represent immediate neighbourhood context rather than the exact area of the buffer. These data include population totals, housing totals, and distances to different facilities, among others. Total numbers are used to calculate population and housing densities in the 20-meter buffers of intersections. Different accessibilities to facilities were also used (e.g., supermarkets, department stores, education facilities, train stations, and shops) to examine their effects on the cyclist crashes. To account for the effect of proximity of these facilities on the crashes at intersections, the distances of intersections to facilities were used. As a remark, the term “proximity to destinations” used in the study refers to the selected concentrated facilities (available in the CBS data), not to all possible trip destinations. These variables are intended to capture local activity concentration and exposure, rather than destination status.
2.5 Crash data
2.5.1 Ambulance-reported data
The crash database from ambulance recordings is provided by the Gemeentelijke Gezondheidsdienst Flevoland (GGD-Flevoland, 2022). The ambulance database contains all recorded crashes from 2020 to 2024. Furthermore, characteristics like the year of the crash, types of vehicles involved, number of people involved (carried by ambulance), and time indicators are also present in the data. Based on coordinates, cyclist crashes that fall within the 20-meter buffer area were spatially joined to their respective intersection ID. It is worth noting that ambulance data coordinates represent the location where the ambulance was parked; however, it can be assumed that the ambulance would be parked substantially close to the crash location.
2.5.2 Police-reported crash data
Police-reported crashes are stored in the BRON database (BRON, 2024). We chose to use “police-reported crash data” term throughout the paper. Police-reported dataset involves crashes from 2015 to 2021 where at least one bicycle was involved. Characteristics related to these crashes include the type of crash, exact dates, involved victims, road condition, and environment attributes such as weather and lighting. Similarly to the ambulance data, crashes within the 20-meter buffer are joined to their respective intersection through the intersection ID. Note that, the period of police- and ambulance-reported crashes are slightly different (2015-2021 vs 2020-2024). Although this is not ideal, the cyclist crash numbers and trends are not significantly changed for the 2015-2024 period (SWOV, 2024).
3. Methodology
This study aimed to analyse the effects of several factors associated with traffic, infrastructure, and built environment on the bicycle crashes using negative binomial regression models. These regression models were built using negative binomial regression approach, which allowed us to compare factors affecting single- and non-single-bicycle crashes. For this purpose, first it is identified the set of variables that can be used in the models.
3.1 Model Variables
To identify the variables that can be used in the regression models, a Pearson Correlation test was performed, and highly correlated variables were identified. Several variables such as Road Density and Housing Density were excluded from the model due to high correlation. Road Density correlates with Intersection Density, since the study focuses on intersections, the latter variable was kept. We found that Housing Density correlates with Population Density, so the Housing Density was excluded. Following the correlation test, a final list of variables was assembled (Table 2). In order to conduct a regression model, a reference category was identified for each categorical variable.
| Variable | Total | mean | std. dev. | median | min. | max. |
|---|---|---|---|---|---|---|
| SBCs – Ambulance | 140 | 0.01 | 0.11 | 0 | 0 | 4.00 |
| Non-SBCs – Ambulance | 277 | 0.02 | 0.17 | 0 | 0 | 4.00 |
| SBCs – Police | 11 | 8.31x10⁻⁴ | 0.03 | 0 | 0 | 1 |
| Non-SBCs – Police | 118 | 8.92x10⁻³ | 0.11 | 0 | 0 | 3 |
| log(Bicycle Count) | 69116 | 5.22 | 2.26 | 5.75 | 0 | 8.01 |
| log(Vehicle Count) | 42190 | 3.19 | 2.04 | 3.56 | 0 | 7.56 |
| Intersection Type: Roundabout | 162 | |||||
| Intersection Type: Traffic Light | 137 | |||||
| Intersection Type: Unsignalized | 12937 | |||||
| Bike Infrastructure: Lanes | 558 | |||||
| Bike Infrastructure: Separated | 2007 | |||||
| Bike Infrastructure: Mixed | 10671 | |||||
| Number of Roads | 59162 | 4.47 | 1.68 | 4.00 | 1.00 | 8.00 |
| Intersection Density | 13769 | 1.04 | 0.31 | 0.94 | 0.80 | 3.09 |
| Parking on Road | 6592 | 0.50 | 0.50 | 0.00 | 0 | 1.00 |
| Population Density | 33715 | 2.55 | 2.45 | 1.78 | 0 | 55.31 |
| Land Use: Industry | 987 | |||||
| Land Use: Residential | 10782 | |||||
| Land Use: Green | 1467 | |||||
| Distance to supermarket | 13468 | 1.02 | 0.93 | 0.80 | 0 | 6.40 |
| Distance to shopping | 14292 | 1.08 | 1.07 | 0.80 | 0 | 8.50 |
| Distance to department store | 43284 | 3.27 | 2.54 | 2.50 | 0 | 13.80 |
| Distance to train station | 88147 | 6.66 | 7.75 | 2.90 | 0 | 31.20 |
| Distance to education | 10996 | 0.83 | 0.90 | 0.60 | 0 | 7.30 |
3.2 Negative Binomial Regression modelling
There exist several statistical and machine learning models that are commonly used for the analysis of crashes. The most widely used approach is the Negative Binomial Regression (NBR), given the non-negative integer counts and the over dispersed nature of crash counts (Lord & Mannering, 2010). NBR is preferred over Poisson regression model when dealing with crash data due to the overdispersion parameter it incorporates. This makes it possible for the variance to exceed the mean, whereas Poisson’s condition states that the variance must be equal to the mean (Lord & Mannering, 2010). This is tested by computing Pearson χ2 divided by degrees of freedom, resulting in a 1.1 value and, although a low value, motivating the use of NBR. In NBR, crash frequencies are assumed to follow a Negative Binomial distribution. This adds a gamma-distributed error term to the Poisson model to account for the mentioned overdispersion. This results in an increased accuracy of the estimated computations. Given the observed number of crashes \(y_{i}\), the Poisson-gamma mixture (negative binomial) distribution of \(y_{i}\) is as follows (Washington et al., 2010):
\begin{eqnarray} P\left( y_{i} \right) = \frac{\Gamma\left( y_{i} + \alpha^{- 1} \right)}{\Gamma\left( y_{i} + 1 \right) + \Gamma\left( \alpha^{- 1} \right)}*\left( \frac{\alpha^{- 1}}{\alpha^{- 1} + \lambda_{i}} \right)^{\alpha^{- 1}}*\left( \frac{\lambda_{i}}{\alpha^{- 1} + \lambda_{i}} \right)^{y_{i}}\tag{1} \end{eqnarray}
where,
\begin{eqnarray} \lambda_{i} = \exp\left( \mathbf{\beta}\mathbf{Χ}_{\mathbf{i}} + \epsilon_{i} \right) = \exp{\left( \mathbf{\beta}\mathbf{Χ}_{\mathbf{i}} \right)*exp(\epsilon_{i})}\tag{2} \end{eqnarray}
and,
\begin{eqnarray} \exp\left( \epsilon_{i} \right)\sim\Gamma(1/\alpha,1/\alpha)\tag{3} \end{eqnarray}
Where, Xi is the vector of the predictors for observation i, and β is the vector of coefficients for the respective predictors. The set of coefficients that maximizes the loglikelihood function of the Equation 1 can be estimated by the maximum likelihood estimation. Please refer to (Washington et al., 2010) for further details on the NBR model. Crash counts are driven by the number of opportunities that occur (i.e., more traffic leads to more crashes). This means that the effect of predictors that naturally influence crash predictions are better presented by multiplicative factors (Hauer, 2004; Uijtdewilligen et al., 2024). Thus, a multiplicative factor is included, where the log of the exposure variable was used.
4. Results
4.1 Temporal comparison of ambulance- and police reported cyclist crashes
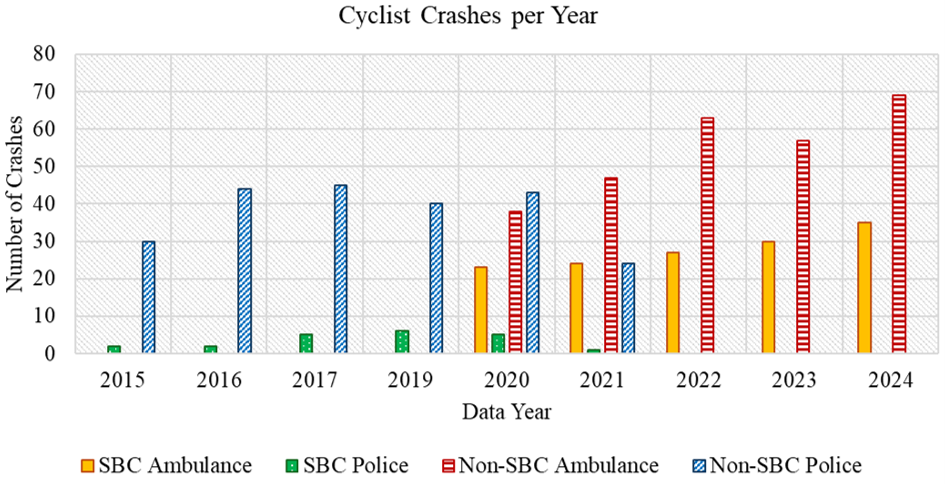
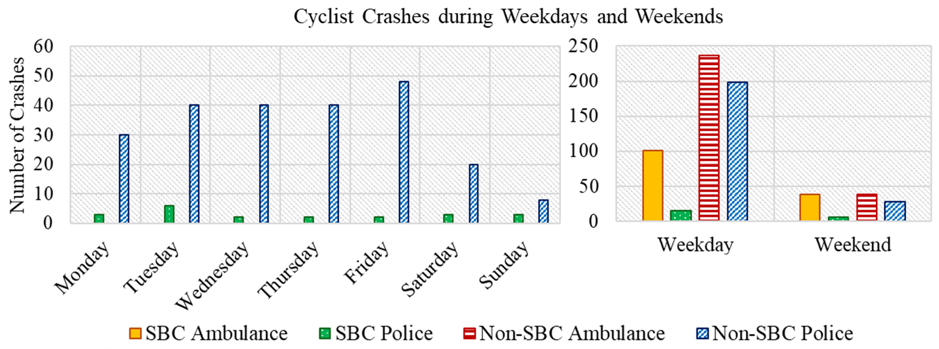
To compare the temporal variation of 30 km/h and 50 km/h intersection crashes, ambulance dataset (2020-2024) and the police-reported crash dataset (2015-2021) are used. Regarding the yearly distribution of the crashes, analysis shows an increasing trend in both SBCs and Non-SBCs, the latter being consistently higher (Figure 3). When it comes to the yearly statistics, Non-SBCs dominate each year’s crash counts, while SBC counts are substantially lower. Overall, the ambulance dataset shows substantially larger SBC counts within intersections, which enables the comparison with Non-SBCs. Both ambulance- and police-reported datasets have significantly fewer SBCs across the week compared to Non-SBCs (Figure 4). For differentiating between weekdays and weekends, police-reported Non-SBCs show a distinct pattern, with peaks on weekdays.
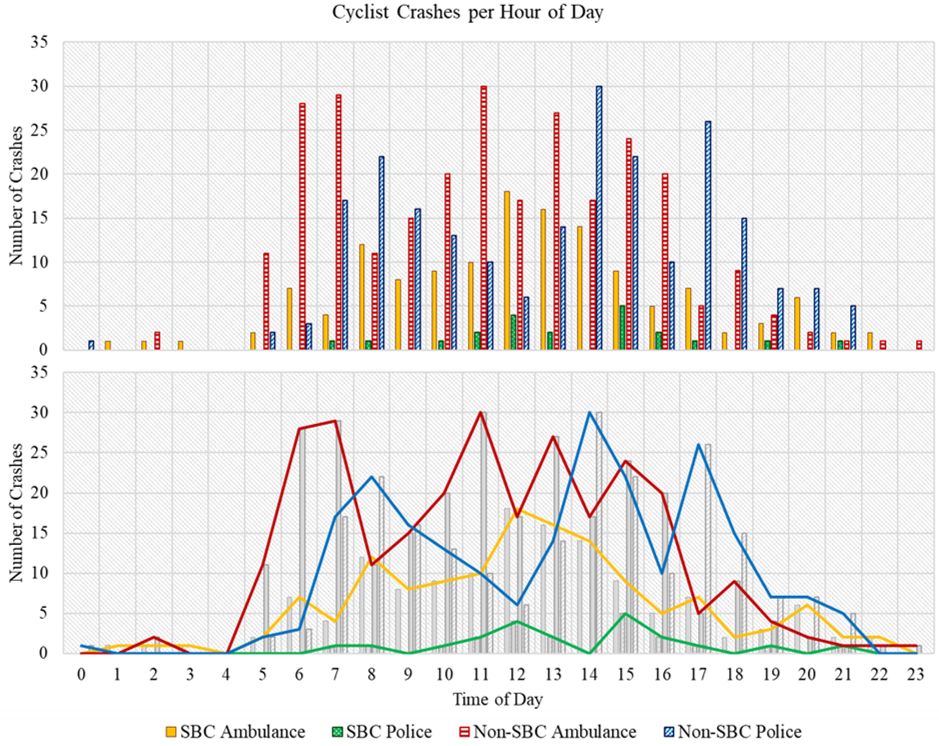
The ambulance data show that Non-SBCs are generally higher throughout the day than SBCs (Figure 5). Data show that the crash frequency peaks around the morning hours and late afternoon hours. However, ambulance-reported crash data shows a more uniform distribution throughout the day (except night hours), compared to police-reported crash dataset. The analysis of police-reported crash data revealed that most of the crashes in police-reported dataset occur around 7:00, 14:00, and 17:00 hours. In police-reported crash dataset, Non-SBCs have significantly higher crash counts compared to SBCs. Overall, Non-SBCs prove to be more sensitive to hour and type of day, while SBCs show a more uniform distribution.
Since police-reported data underrepresents SBCs, comparison where police-reported SBCs are involved are descriptive and evidence of the so-mentioned reporting differences. The ambulance data are used as the main source of SBC modelling.
4.2 Crash models and effects of predictor variables
To analyse the effects of predictor variables, six Negative Binomial Regression models were developed (four based on ambulance-reported data and two based on police-reported data). Due to the structure of the VENOM traffic model (traffic volumes) and to represent bicycle and traffic volumes more accurately, the data are split according to crash type and speed environment. Mixed speed intersections were grouped with 50 km/h intersections given that they contain at least one 50 km/h link and therefore share exposure to higher speeds. Furthermore, number of crashes for mixed intersections alone was insufficient for the speed to be a separate category. Therefore, separate crash frequency models were developed as follows: SBCs at 30 km/h, non-SBCs at 30 km/h, SBCs at 50 km/h and mixed, and non-SBCs at 50 km/h and mixed intersections. The model specification included intersection characteristics, land use, population density, distance to amenities, and bicycle infrastructure variables as well as exposure variables (i.e. BVOL and TVOL).
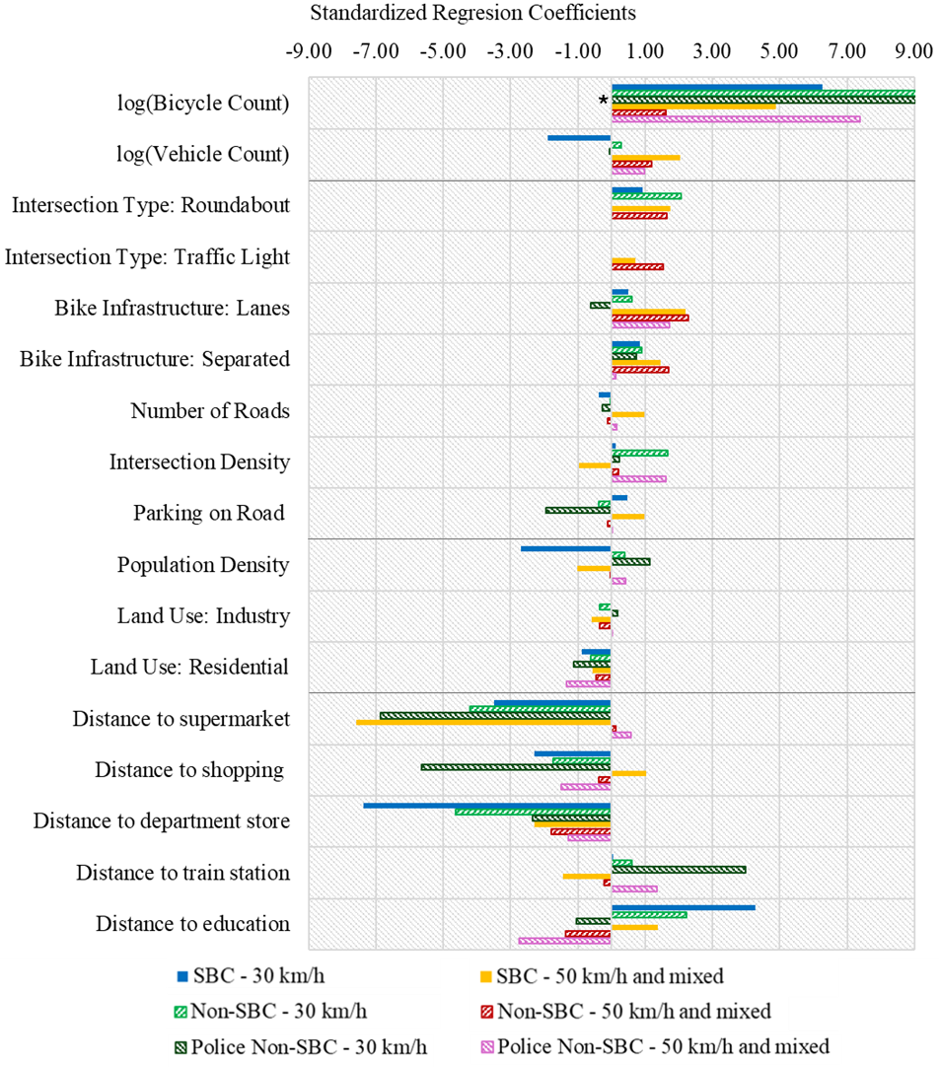
Given the comparison between the ambulance and police-reported crash datasets, and that the ambulance data show a more uniform distribution and higher count of SBC crashes, the ambulance data were used to develop four regression models, covering all speed (i.e., 30 km/h vs. 50 km/h and mixed) and crash types (i.e., single vs. non-single). We developed two more regression models using police-reported non-single bicycle crashes. Unfortunately, it was not possible to develop models of SBCs based on police-reported crashes due to limited number of observations after filtering for intersections (11 crashes in total). The regression parameters and goodness-of-fit metrics are reported in Table 3 and standardized coefficients are demonstrated in Figure 6.
4.2.1 Crash models based on ambulance-reported and police-reported crashes
The Table 3 and Figure 6 show the coefficient estimates and standardized coefficients, respectively for each of the six models. These results show the importance of bicycle and traffic volumes across the models. It is clear that the bicycle and traffic volumes play a significant role in bicycle crash frequencies. However, a striking finding is that motor-vehicle volume factor have either negative coefficient (for SBC) or is statistically not significant (for Non-SBC) at 30 km/h intersections, indicating that motor-vehicle volumes are not a major risk factor for 30 km/h intersections. Motor-vehicle volumes are more influential on both SBC and Non-SBC crashes at 50 km/h and mixed intersections compared to 30 km/h intersections; however, the effects of motor-vehicle volume are still not as notable as the effects of bicycle volume. Regarding the bicycle volume, it is striking that the effect of bicycle volume is more prominent in the analysis with police-reported crashes, particularly for Non-SBCs. It is interesting that effect of bicycle volume on the Non-SBCs at 50 km/h and mixed intersections is less remarkable.
Cycling infrastructure (particularly roundabouts) is positively associated with crash counts in most contexts (i.e., increasing crashes), which might be reflecting design-related issues. However, note that this is not observable based on police-reported crash data given the few number of police-reported crashes at roundabouts. Intersections with bike lanes seem to be more problematic at 50 km/h and mixed intersections, indicating that higher speeds might be a problem for such infrastructure. Similar findings are visible for intersections with separated bike paths, but the effects are slightly less prominent compared to bike lanes. Intersection density seem to be an aggravating factor particularly for Non-SBCs. Land-use effects are not significant except for the residential areas, which has a minor reducing effect on both SBCs and Non-SBCs. An interesting effect of population density shows that SBCs at 30 km/h intersections are more common at areas with low population density, even though the effect is not statistically significant.
Proximity variables have mixed and context-specific effects given that statistical significance of coefficients vary among the models substantially. A striking finding is that the number of cyclists crashes (both SBCs and Non-SBCs) increase considerably at 30 km/h intersections closer to supermarkets. This is also true for SBCs at 50 km/h and mixed intersections. Such effect is not visible for Non-SBCs at 50 km/h and mixed intersections. 30 km/h intersections closer to shopping areas and department stores seem to be particularly prone to cyclist crashes (both SBCs and Non-SBCs). 30 km/h intersections in proximity to train stations and educational facilities seem to experience lower number of cyclist crashes; however Non-SBCs increase at 50 km/h and mixed intersections close to educational facilities, indicating that speed might be a critical issue when there is an educational facility nearby.
| Variable | SBC | 30 km/h | Non-SBC | 30 km/h | Police Non-SBC | 30 km/h | SBC | 50 km/h & mixed | Non-SBC | 50 km/h & mixed | Police Non-SBC | 50 km/h & mixed |
|---|---|---|---|---|---|---|
| β (s.e.) | β (s.e.) | β (s.e.) | β (s.e.) | β (s.e.) | β (s.e.) | |
| Intercept | -4.662 (0.90) | -7.431 (0.92) | -8.310 (1.39) | -5.783 (1.18) | -5.009 (0.68) | -6.642 (1.15) |
| log(Bicycle Count) | 0.297 (-0.08) | 0.523 (0.09) | 0.787 (0.14) | 0.287 (0.10) | 0.177 (0.06) | 0.373 (0.11) |
| log(Vehicle Count) | -0.092 (0.06) | 0.017 (0.05) | -0.003 (0.06) | 0.166 (0.09) | 0.177 (0.06) | 0.068 (0.90) |
| IT: Roundabout | 0.906 (1.18) | 2.066 (0.53) | -28.40 (1xe6) | 1.737 (0.49) | 1.653 (0.32) | -32.36 (4xe6) |
| IT: Traffic Light | -* | -* | -* | 0.576 (0.54) | 1.525 (0.32) | -33.06 (5xe6) |
| BI: Lanes | 0.481 (0.44) | 0.594 (0.34) | -0.618 (0.57) | 2.188 (0.80) | 2.269 (0.51) | 1.723 (0.70) |
| BI: Separated | 0.843 (0.32) | 0.899 (0.25) | 0.745 (0.35) | 1.450 (0.52) | 1.693 (0.34) | 0.119 (0.47) |
| Number of Roads | -0.024 (0.08) | -0.003 (0.06) | -0.027 (0.09) | 0.101 (0.11) | -0.025 (0.07) | 0.007 (0.13) |
| Intersection Density | 0.056 (0.42) | 0.709 (0.29) | 0.131 (0.46) | -0.476 (0.44) | 0.136 (0.27) | 0.654 (0.50) |
| Parking on Road | 0.100 (0.24) | -0.066 (0.20) | -0.350 (0.27) | 0.444 (0.40) | -0.090 (0.27) | 0.009 (0.48) |
| Pop. Density | -0.103 (0.06) | 0.019 (0.05) | 0.043 (0.06) | -0.122 (0.12) | -0.003 (0.07) | 0.039 (0.10) |
| LU: Industry | 0.006 (0.53) | -0.320 (0.52) | 0.279 (0.57) | -0.629 (0.61) | -0.350 (0.36) | 0.020 (0.49) |
| LU: Residential | -0.883 (0.37) | -0.615 (0.32) | -1.111 (0.42) | -0.580 (0.43) | -0.468 (0.29) | -1.347 (0.50) |
| DT supermarket | -0.363 (0.31) | -0.543 (0.30) | -0.681 (0.42) | -1.331 (0.46) | 0.055 (0.26) | 0.091 (0.34) |
| DT shopping | -0.211 (0.27) | -0.196 (0.23) | -0.496 (0.34) | 0.142 (0.30) | -0.103 (0.20) | -0.192 (0.28) |
| DT dep. store | -0.278 (0.09) | -0.213 (0.07) | -0.076 (0.07) | -0.155 (0.12) | -0.243 (0.08) | -0.078 (0.12) |
| DT train station | 0.002 (0.02) | 0.010 (0.01) | 0.048 (0.02) | -0.029 (0.02) | -0.008 (0.01) | 0.027 (0.02) |
| DT education | 0.483 (0.26) | 0.282 (0.26) | -0.175 (0.42) | 0.208 (0.39) | -0.414 (0.25) | -0.397 (0.37) |
| N. Obs. | 10982 | 10982 | 10982 | 2252 | 2252 | 2252 |
| 2 x LL | -459.1 | -587.0 | -756.9 | -186.2 | -409.6 | -334.0 |
| AIC | 952.2 | 1208.1 | 792.9 | 408.4 | 855.1 | 372.0 |
| α | 7.00 (3.25) | 1.11 (0.94) | 6.77 (3.06) | 2.06 (1.07) | 1.39 (0.50) | 3.44 (2.17) |
5. Discussion
5.1 Interpretation of the results
The results of this research aim to provide insight into differences in the factors associated with SBCs and Non-SBCs using ambulance- and police-reported crash datasets. Due to limited number of single bicycle crashes (11 in total) in police-reported crash data, we could not conduct a regression analysis for SBCs. Therefore, it is not possible to compare SBC analyses by ambulance- and police-reported crash datasets. Nonetheless, results for Non-SBCs based on ambulance- and police-reported crash datasets are largely in agreement with each other. We did not observe a substantial difference between estimates based on these two datasets, besides minor differences in the magnitudes of coefficients.
The results from the regression models for SBCs and Non-SBCs showed that cycling and traffic volume, cycling infrastructure, and proximities to certain facilities significantly correlate crash frequencies. SBC crashes were highly linked to the presence of cycling infrastructure and by distances to specific destinations (e.g. supermarkets, department stores, etc.). Non-SBCs showed to be also related to cycling and traffic volume, as well as cycling infrastructure and distances to destinations such as train stations or department stores. The strong relationship of Non-SBCs with traffic volumes was also previously identified (Utriainen et al., 2022), where it was found that higher traffic volumes correlate with increased likelihood of vehicle-involved crashes at intersections. The influence of cycling infrastructure on SBCs was also reported in the previous studies (Uijtdewilligen et al., 2024)(Schepers, 2021). When looking into the positive association between bicycle infrastructure and SBCs, the finding should not be interpreted as evidence that cycling infrastructure itself increases crash risk. Rather, bicycle infrastructure is more commonly present at larger and more complex intersections, particularly along 50 km/h roads, where cyclist volumes are generally higher. At such locations, cyclists could be more likely to preform manoeuvres, lose control, or interact with the infrastructure, which can contribute to SBCs.
Regarding both SBCs and Non-SBCs, "Green" and "Industry" land use types seem to be inversely correlated with safety compared to “Residential”, also confirming the previous findings (Schepers, 2021), stating that non-residential zones often generate more turning and crossing movements. Only exception to this is the SCBs at 50 km/h and Mixed conditions, which did not show statistical significance. The results regarding the proximities to facilities (e.g., proximity to department stores or educational facilities) suggest that some attractors may shape crash risk (Uijtdewilligen et al., 2024). Specific to proximity to department stores and supermarkets, the proximity to heavy traffic generators shapes turning and crossing collisions which is inline with literature (Uijtdewilligen et al., 2024). Proximity to train stations are significantly tied to Non-SBC risk based on police-reported crashes, aligning again with the previous findings (Uijtdewilligen et al., 2024)(Schepers, 2021).
It should be noted that proximity variables are indicators of concentrated activity (rather than causal factors). Stronger associations may reflect locations where volumes are concentrated. Educational facilities, on the other hand, show a weaker association. This is possibly due to the fact that school-related travels are generally concentrated in specific time periods. The models, however, do not include time-specific school exposure or trip-purpose data. Furthermore, schools are typically located in residential 30 km/h areas, where users may tend to reduce their speed and pay more attention when close to schools.
Variables representing the complexity such as road count and parking on road were unexpectedly not significant or had little correlation with crash frequencies. Population density surprisingly showed no statistical significance when predicting crashes in any of the models. This might be due to how the aggregation is set up in the dataset (100x100-meter tiles), which can wash out crowding effects when working with 20 meter-buffers.
Consequently, when looking at the two types of crashes, they are both positively associated with bicycle volume and with the presence of cycling infrastructure, thus suggesting that exposure and the design of cycling facilities are important in both cases. The main difference is that motor-vehicle volume is more relevant for Non-SBCs at 50 km/h and Mixed intersections, while SBC models show stronger associations with infrastructure and selected destination-proximity variables. These differences suggest that SBC prevention should focus on intersection geometry, surface quality, transitions, and maintenance (among others).
5.2 Limitations and future research
Several limitations may affect the results of this research. Firstly, the ambulance crash dataset records the coordinates of the parked location of the ambulance, and not those of the actual crash. Furthermore, there was a distinction in crash recordings from 2020 onwards. This means that, although the ambulance data goes from 2013 to 2024, crashes prior to 2020 were recorded based on the coordinates in buildings, probably due to the recording standard (i.e. address and house number). Therefore, intersection crashes might have been overlooked when the coordinates were recorded based on buildings in proximity, leading to the discard of ambulance-reported data before 2020. The police-reported crash data appeared to have Non-SBC counts close to crash number of ambulance-reported data; however, police records greatly under-represent SBC counts. (Utriainen et al., 2022), suggests that SBCs should be explored by looking at healthcare data. On another note, the ambulance dataset includes the years 2020 and 2021, when COVID-19 restrictions may have affected patterns and volumes and thus altering crash exposure and temporal distribution of the crashes. Furthermore, due to the lack of common attributes, both datasets (ambulance- and police-reported crash) were unable to be joined. Future work can explore ways to join two datasets to conduct a more complete analysis of SBCs and non-SBCs.
Another limitation came from the traffic volumes extracted from the VENOM model. This model does not work with the NWB road layer as a base layer, but rather with its own traffic links. Furthermore, only main traffic links are accurately represented, while traffic volumes in neighbourhood minor roads are aggregated into a single line. This made the distribution of traffic volumes among intersections challenging, and averages for the neighbourhood intersections had to be assigned. Hence, results at lower speeds might suffer from generalised traffic volumes where real differences in volume are smoothed out. This means that some low-volume crossings might have been "over-exposed" and others "under-exposed". Moreover, the traffic volumes from the VENOM model aggregate morning and evening peaks, thus not fully representing a daily average. This might have caused the regression to underestimate how strongly crash counts associated with peak-period volumes.
To aggregate respective characteristics associated with intersections, 20-meter buffers were created around points representing those intersections in GIS environment. As an inherent limitation, these buffers might have aggregated data from neighbouring roads that did not belong to the intersection itself, but fell within the extent of the buffer. So, future research can explore network-based buffer generation to ensure that such irrelevant roads are not included in the aggregation.
Finally, future research could look into the effects of pedestrian infrastructure on SBCs at intersections. Urban intersections are locations where all types of traffic (vehicle or pedestrian) come together. Thus, involving pedestrian elements in research could unveil unexplored effects and provide a better understanding. Furthermore, a split between urban and suburban areas could help analyse the influence of population density and traffic volumes separately, and developing a more accurate and detailed examination.
6. Conclusion
This study compares Single-Bicycle Crashes (SBCs) and Non-Single-Bicycle Crashes (Non-SBCs) in police- and ambulance-reported crash datasets and examines different factors contributing to SBCs and Non-SBCs at urban intersections with 30 km/h and 50 km/h speed limits. For this purpose, we conducted a descriptive analysis of crashes and developed regression models to estimate cyclist crash counts at urban intersections in Flevoland, the Netherlands. Several variables were extracted from literature review, including traffic and bicycle volumes, proximity to destinations, cycling infrastructure, and intersection type, and land use characteristics. Based on the modelling results, it is revealed that traffic and cycling volumes, as well as cycling infrastructure, have the most impact on increasing bicycle-involved crash counts. Furthermore, proximity to destinations is proved to be relevant, depending on the specific destination and type of crash. Traffic volume showed to be most relevant for Non-SBCs at 50 km/h roads, while cycling infrastructure had an important effect both on SBCs and Non-SBCs.
Findings of this study can help guide targeted infrastructure and speed-management interventions. Volume management at high-risk intersections could be prioritized by introducing reduced speed limits or speed lowering measure. Since both separated tracks and bicycle lanes were associated with higher crash counts, cycling infrastructure should be prioritised for design reviews. Lastly, this study shows that there is a need for a standardized crash-recording procedure that all entities (i.e. police, ambulance, etc.) can adopt. This would facilitate better understanding of cyclists crashes and show the real scale of the cyclist safety problem.
CRediT contribution
Inés Blanes Martín-Posadillo: Conceptualization, Data curation, Formal analysis, Investigation, Software, Validation, Visualization, Writing – original draft, Writing – review & editing. Teun Uijtdewilligen: Conceptualization, Data curation, Funding acquisition, Investigation, Methodology, Project administration, Resources, Supervision, Writing – original draft, Writing – review & editing. Mehmet Baran Ulak: Conceptualization, Data curation, Formal analysis, Funding acquisition, Investigation, Methodology, Project administration, Resources, Software, Supervision, Validation, Visualization, Writing – original draft, Writing – review & editing.
Declaration of competing interests
The authors report no competing interests.
Declaration of generative AI use
During the preparation of this work, the author used several tools that include, or may include, Artificial Intelligence. These tools include: Research Rabbit to find past literature related to all topics in the research; Overleaf as a writing tool for the report; and ChatGPT as a searching engine for specific and unusual GIS tools. After using these tools/services, the author reviewed and edited the content as needed, and takes full responsibility for the content of the work.
Prior dissemination declaration
This manuscript presents original work that has not been previously published or disseminated in any form.
Ethics statement
No data were collected for this study and not ethical review was required.
Funding statement
No external funding was used in this research.
Data availability statement
The data that support the findings of this study are not publicly available because they are the proprietary property of a third party. The authors are not authorized to share these data. Requests for access to the data should be directed to the data owners (BRON data from Rijkswaterstaat and Ambulance data from GGD-Flevoland), subject to their policies and approval.
Code availability statement
No custom code or software was developed specifically for this study. All analyses were performed using R and standard, publicly available packages. Therefore, there is no study-specific code available to share.
Editorial information
Handling editor: Carmelo D'Agostino, Lund University, Sweden.
Reviewers: Ruben Kuipers, Dresden University of Technology, Germany | Lund University, Sweden; Jakub Sliacan, Swedish National Road and Transport Research Institute (VTI), Sweden.
Submitted: 18 January 2026; Accepted: 31 July 2026; Published: 14 August 2026.