Analysing bike crash reasons and predicting occurrence in Izmir city: insights from a logit regression model
Abstract
This study aims to analyse the occurrence and causes of bicycle crashes in Izmir, Turkey, with a focus on socio-demographic factors, cycling behaviours, and urban infrastructure. It seeks to identify key determinants of crash probability and reasons using regression models. Data were collected via face-to-face surveys from 1,796 cyclists across Izmir. 25% of surveyed cyclists reported having experienced a bicycle crash. Two statistical models were applied: a binary logistic regression to predict the probability of crash occurrence and a multinomial logit model to determine crash causes. Spatial data were also analysed to identify high-risk urban areas using GIS tools. The binary logistic model showed that higher age, education, income, and use of safety equipment reduced the likelihood of a crash. The multinomial logit model revealed that cyclist distraction, poor road infrastructure, and the sudden appearance of vehicles and pedestrians were the main crash causes. Younger cyclists were more vulnerable to sudden appearances. Spatial analysis identified Konak as the highest risk area, with Bornova and Karsiyaka also showing significant crash densities. Findings highlight the critical role of dedicated cycling infrastructure, especially in urban centres with mixed traffic. Policymakers should prioritize expanding bike lanes, improve road conditions, and promote cyclist education, particularly among youth and low-income populations.
1. Introduction
Bicycles have become an increasingly popular mode of transportation in urban areas, recognized for their environmental benefits, cost efficiency, and health advantages. However, alongside their growing use, concerns about cyclists' safety have also risen significantly. According to Rella Riccardi et al., 2023, cyclists are among the most vulnerable road users due to their exposure to severe injuries in traffic environments caused by motorized vehicles, facing a high risk of traffic crashes that can lead to serious injuries or fatalities. For instance, the World Health Organization (WHO) estimates that cyclists account for approximately 3% of global road traffic fatalities, showing the urgent need for improved safety measures (WHO, 2018).
Cycling crashes often result from a combination of factors, including inadequate infrastructure, risky cyclist behaviour, and interactions with motorized vehicles. For example, studies in urban areas reveal that poorly designed intersections, a lack of dedicated bike lanes, and insufficient lighting contribute significantly to the frequency and severity of bicycle crashes (Reynolds et al., 2009). In addition, demographic factors such as age, gender, and cycling experience also play a crucial role. Research shows that younger and less experienced cyclists are more likely to be involved in crashes, while male cyclists tend to exhibit riskier riding behaviours (Behnood & Mannering, 2017; Scholes et al., 2018). Perceived risk is among the determinants of road user behaviour and safety outcomes, as it guides decision-making and the likelihood of attempting risky manoeuvres. An understanding of the contribution of socio-demographic characteristics and experience to driving risk perception can inform the design of targeted interventions to improve safety for all vulnerable road users (Sahebi et al. 2022).
The severity of bicycle crashes can vary widely depending on the circumstances. Collisions involving motorized vehicles are particularly severe, often resulting in life-threatening injuries (Kim et al., 2007). Montoro et al. (2018) found that most of the road crashes involving cyclists and causing, in many cases, considerable injuries and even death, were preceded by cycling distractions.
Lately, the Safe System and Vision Zero approaches have become central frameworks in international road safety policy and research. These approaches emphasize that fatalities and serious injuries in traffic are predictable and preventable and should not be accepted as inevitable outcomes of mobility systems (ITF, 2016). The Safe System approach recognizes that human errors are unavoidable. Therefore, transport systems should be designed to minimize the probability and severity of crashes through safer infrastructure, the protection of vulnerable road users such as cyclists and pedestrians, and speed management, for example, if cars hit pedestrians at 25–30 km/h, most of them survive. However, if the cars drive at 50 km/h, the likelihood of a fatal crash is high (Johansson, R. 2009). Within this framework, separated bicycle lanes, safer intersections, traffic calming measures, and improved interaction management between cyclists, pedestrians, and motorized vehicles are considered essential components of sustainable urban mobility.
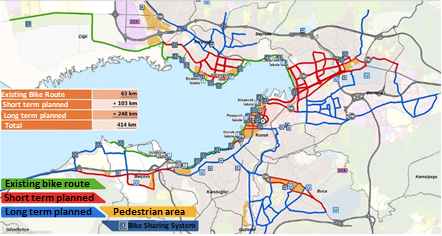
As of the year 2022, Izmir had a population of 4,462,056 (TUIK, 2022), making it one of Turkey’s fastest-growing metropolitan areas. Due to the increasing rate of bicycle use in cities and inadequate bicycle infrastructure, the probability of bicycle crashes is higher. Despite the risks, cycling remains a critical component of sustainable urban transportation systems. Well-planned cycling infrastructure, including separated bike lanes and traffic-calming measures, has been shown to reduce the likelihood of crashes and improve cyclist safety (Teschke et al., 2012). However, existing measures are often insufficient, in Izmir, for instance, designated bicycle lanes are limited to the coastline. In the city, 103 km of bicycle lanes are planned in the short term and 248 km in the long term (Izmir Metropolitan Municipality, 2023).
Izmir's Sustainable Urban Mobility Plan (SUMP) aims to define measurable targets and guiding principles for mobility and traffic development in Izmir until 2040. In addition, it will identify concrete measures to achieve these targets across various areas of activity (e.g., cycling, public transport, parking, traffic safety) (SUMP, 2022). This aligns with the aim of our research, which is to understand the possible reasons for cyclist crashes.
Therefore, this study investigates the occurrence and causes of bicycle crashes in Izmir, Turkey, focusing on both socio-demographic and spatial factors. Using binary and multinomial logit models, it analyses the relationships between variables such as age, gender, and cycling frequency and the likelihood of crashes. Additionally, the study examines the spatial distribution of crashes to identify high-risk areas and inform infrastructure improvements. By addressing these issues, this research aims to contribute to the development of safer cycling environments and encourage greater adoption of bicycles as a sustainable mode of transportation. In line with these objectives, the study seeks to address the following research questions:
What are the key socio-demographic and crash behavioural factors influencing the probability of bicycle crashes in Izmir?
What are the primary causes of bicycle crashes, and how do these vary across different age and gender groups?
Which urban areas are identified as high-risk zones for bicycle crashes, and what infrastructure interventions should be prioritized in these locations to reduce risk?
2. Literature review
Studies on bicycle crashes have become increasingly important alongside the global shift towards sustainable urban transportation (Pucher & Buehler, 2008). Research in this area has identified a range of contributing factors, including infrastructure deficiencies, cyclist, interactions with motorized vehicles, and the role of policy interventions in preventing crashes (Reynolds et al., 2009). Understanding these factors is essential for developing targeted safety strategies and informing the design of safer cycling environments.
Several studies have emphasized the importance of cycling infrastructure in improving bicycle safety. The expansion of bicycle lanes and dedicated cycling paths can reduce interactions between cyclists and motor vehicles, allowing cyclists to travel more safely and comfortably. Winters et al. (2010) investigated the impact of bicycle infrastructure on bicycle use and found that improvements such as bicycle lanes, bicycle parking facilities, and bike-sharing systems encourage cycling.
Apart from the provision of cycling infrastructure, another factor that influences the safety of bicycle is the relationship between cyclists’ behavior, road conditions, and the built environment. For instance, Billot-Grasset et al. (2016) have identified 17 bicycle accident typologies based on the analysis of 1,078 accidents in France. It turned out that the adverse weather conditions, darkness, cycling at high speeds, cyclists’ consumption of alcohol, low visibility, and some other aspects have influenced the risk of various bicycle accidents. The authors stress the importance of infrastructure improvement, increased visibility of cyclists, and safer cyclists' behavior for the prevention of accidents.
Buehler and Dill (2016) also examined the relationship between cycling infrastructure and cycling preferences. They found that cyclists generally prefer separated bicycle lanes, lower traffic speeds, roads with fewer intersections, and routes with trees along the roadway.
In addition to infrastructure improvements, promoting the use of safety equipment among cyclists is important for enhancing bicycle safety. Safety measures such as bicycle helmets and reflective clothing, can reduce injury severity and improve cyclist protection (Kwan & Mapstone, 2002). Governments can support the use of such equipment through awareness campaigns and incentive programs (Royal et al., 2007).
Pucher and Buehler (2008) investigated how bicycle lane design influences cyclist safety. Their study emphasized the importance of physical lane characteristics, intersection design, road markings, and lighting conditions. Similarly, Thompson et al. (1996) examined the impact of bicycle helmets on injuries and found that helmet use significantly reduces head injuries and prevents severe outcomes in bicycle crashes.
Pucher and Buehler (2016) conducted another study exploring ways to increase bicycle usage and reduce bicycle crashes. They evaluated the effects of policy and infrastructure measures that promote bicycle use by analysing studies conducted in cities worldwide.
Socio-demographic characteristics of bikers, such as gender and age, affected their crash risk (Sener et al., 2021). Some studies mentioned that death rates among male and young drivers were noticeably higher (Scholes et al., 2018; Wang et al., 2021) Previous studies found that risky behaviour could be represented by speeding (Damsere-Derry & Bawa, 2018), using a mobile phone while riding a bike (Buhler et al., 2021; Wang et al., 2021), and using the wrong side of the road while riding bikes (Behnood & Mannering, 2017). Schleinitz & Petzoldt (2023), analysing 95,338 police-reported injury crashes involving pedelecs and bicycles in Germany from 2013 to 2021, found that crash characteristics for both types of bicycles were remarkably consistent over time, with pedelec riders being older on average and experiencing higher injury severity. Despite these differences, the findings suggest no urgent need for specific road-safety measures targeting pedelecs and instead recommend general improvements, such as better bicycle infrastructure and helmet promotion.
Previous studies have examined determinants of bicycle crash severity on undivided highways to demonstrate how road features affect injury outcomes (Wang et al. 2024). In addition, techniques for handling imbalanced crash data, such as ensemble learning, have been applied to an urban Chinese environment, offering methodological insights into the analysis of rare but significant crash types (Zhou et al. 2024). This study builds on such perspectives by incorporating logit regression models and GIS-based spatial analysis in a high-density, mid-income city. Given their current awareness, this is the first study conducted in Turkey to simultaneously analyse bicycle crash frequency and causation using an intercept survey, logistic regression, and GIS techniques. Many previous studies from Turkey have relied on hospital-based injury records and official crash databases (Şimşek & Demircan, 2025), this study relies on cyclists' own reports of crashes, even those not reported in any official records. Further, this study contributes to a relatively under-studied area within the international body of knowledge by conducting a case study of a medium-sized, fast-growing city in a middle-income nation with emerging bicycle infrastructure.
Cyclist behaviour, particularly compliance with traffic rules, is another key factor in bicycle safety. Olivier et al. (2013) examined the frequency, causes, and consequences of bicycle crashes and found that behaviours such as running red lights and failing to yield at pedestrian crossings significantly increase crash risk for both cyclists and other road users. These findings underline the importance of integrating behavioural interventions alongside infrastructure improvements in bicycle safety strategies.
A study conducted in Hefei examined the risk factors associated with injury severity in traffic crashes involving cyclists and e-bike riders, analysing 205 injured individuals (146 e-bike riders and 59 cyclists). The most significant risk factors identified were vehicle type (OR = 14.418), crash mode (side crash, OR = 11.556), traffic rule violations (OR = 4.735), and age (OR = 2.910). E-bikes, being faster and heavier, resulted in more severe injuries compared to bicycles, and the lack of formal traffic education among e-bike riders led to increased rule violations. Side crashes had the highest severe injury rate at 40%, with most crashes occurring at intersections or during vehicle turns. Additionally, the widespread use of e-bikes as an alternative to public transportation contributed to congestion in bike lanes, thereby elevating crash risk (Hu et al., 2014).
Similarly, Jaber et al. (2021) analysed over 14,000 cycling injury records in Hungary, identifying factors such as one-way roads, signalized intersections, and uphill sections as locations with higher crash severity. Their study also found that good pavement conditions encouraged higher speeds, increasing the risk of injury, while nighttime lighting conditions correlated with lower injury severity due to increased caution. Traffic signals were associated with higher risks, whereas traffic signs, such as stop or yield, mitigated them. Both studies emphasize the growing role of e-bikes and cyclists in urban transportation, underscoring the need for targeted infrastructure improvements, such as separate bikeways, optimized traffic controls, and enhanced cyclist education, particularly in high-risk urban environments. Although these studies deal mainly with the issue of injury severity, the approach they adopt in identifying the influence of road design, traffic control, and behavioural aspects on crashes can offer an appropriate methodology for analysing crash occurrence and causes within the current study context.
Among vulnerable road users, cyclists are a key focus in the literature on road safety in Turkey. Based on the TÜİK statistics, cyclists accounted for 2% of deaths from traffic crashes in Turkey in 2024 (TUIK, 2024). Despite rising attention to cycling as a green form of transport, cycling levels in Turkish cities remain low, especially compared to those in countries with high cycling rates. The percentage of trips made through cycling amounted to 0.5% in Izmir City (Izmir UPI, 2017), which is arguably largely because of the absence of facilities for cycling and difficulties faced by cyclists when using roads in mixed traffic conditions. Research on cyclists in Turkey mostly relied on data from hospitals and traffic crash databases, with the main focus on injuries sustained (Şimşek & Demircan, 2025).
Most previous studies focused on either crash severity or the effects of infrastructure and cycling behaviour separately, while fewer examined crash occurrence and causes from the cyclists’ perspective. As mentioned before, in Turkey, existing research has relied heavily on hospital or police records as official crash data, potentially overlooking crashes that are not reported. This study investigates bicycle crash occurrence and causes in Izmir using face-to-face survey data.
3. Method
3.1 Study area
Izmir is a city in the Aegean Region of Turkey. It is the third most populous city in the country. It is one of the leading cities in terms of economy, history, and socio-cultural aspects.
Existing cycle routes in Izmir start from the north and continue along the coastline (See Figure 1). The bicycle lanes in the city are not continuous, and bicycle lanes do not connect to activity centres such as transfer centres, hospitals, stadiums, terminals, universities, bazaars, shopping centres, and city centres. Despite the discontinuous nature of the roads, the city's bicycle use rate is 0.5% (Izmir UPI, 2017), indicating that cycling is used for both recreational and commuting purposes.
3.2 Description of the questionnaire
Between 2018 and 2019, the Izmir Metropolitan Municipality conducted a face-to-face survey of bicycle users in Izmir. The survey was administered in Turkish and carried out during two different periods, summer and autumn, based on the assumption that the number of bicycle users may vary seasonally and due to the opening and closing of schools.
The data were collected from cyclists at predetermined survey locations across Izmir using a face-to-face questionnaire. Participants were randomly selected from cyclists who were using bicycles in these areas at the time of the survey. This random sampling approach ensured that the sample included a diverse range of bicycle users with different socio-demographic and cycling behavior characteristics. The survey locations were selected to represent areas with varying levels of bicycle infrastructure and traffic density. These locations included coastal bicycle lanes and university zones, thereby capturing the diversity of cycling environments in Izmir.
Each survey lasted approximately 10–15 minutes, during which respondents provided information regarding their demographic background, cycling habits, safety practices, and crash history.
The questionnaire consisted of several sections. The first section included introductory information such as the survey location, date and time, survey number, and weather conditions. The second section focused on individual and demographic characteristics, including age, gender, educational level, employment status, city and district of residence, and ownership of motorized and non-motorized modes of transportation.
The third section contained questions related to respondents’ cycling habits. These questions included categorical variables covering topics such as bicycle ownership, trip purpose, frequency of bicycle use, average daily travel time, and the reasons for using bicycles for daily trips.
Finally, the fourth section of the questionnaire focused on bicycle crashes. Respondents were asked whether they had experienced any bicycle crashes (Yes/No), the causes of those crashes, the crash locations, whether they used safety equipment while cycling, and suggestions for improving cyclists’ safety. The causes of bicycle crashes were categorized into four categories:
-
Occupation of Bicycle Lane: This occurs when bicycle lanes are obstructed by parked vehicles, pedestrians, or other obstacles, forcing cyclists to swerve into traffic or stop abruptly.
-
Cyclist Distraction: Crashes caused by cyclists being distracted by themselves such as using mobile phones, listening to music, or by the surrounding traffic environment paying attention to something other than the road, leading to reduced reaction times and increased likelihood of collisions.
-
Road Infrastructure-Related Crashes: These are crashes resulting from poor road conditions or inadequate cycling infrastructure, such as potholes, uneven surfaces, and a lack of bike lanes, poor signage, or insufficient lighting, which can cause cyclists to lose control or collide with other road users.
-
Sudden Appearance of Vehicle or Pedestrian: This type of crash occurs when a vehicle or pedestrian unexpectedly enters the cyclist's path, or when cyclists share the road with other traffic users, leaving them no time to react and avoid a collision. This can occur at intersections or in pedestrians’ crosswalks.
Participation in the survey was voluntary, and respondents were informed of the study's purpose before the survey began. No personally identifiable information was collected, and all responses were treated anonymously and confidentially. The collected data were used solely for academic research purposes. Questions were mostly closed-ended, offering predefined response options for ease of analysis, while a few allowed for open-ended feedback to capture nuanced perspectives. This systematic approach ensured comprehensive data collection on cyclists' habits, challenges, and safety-related concerns.
3.3 Analyses
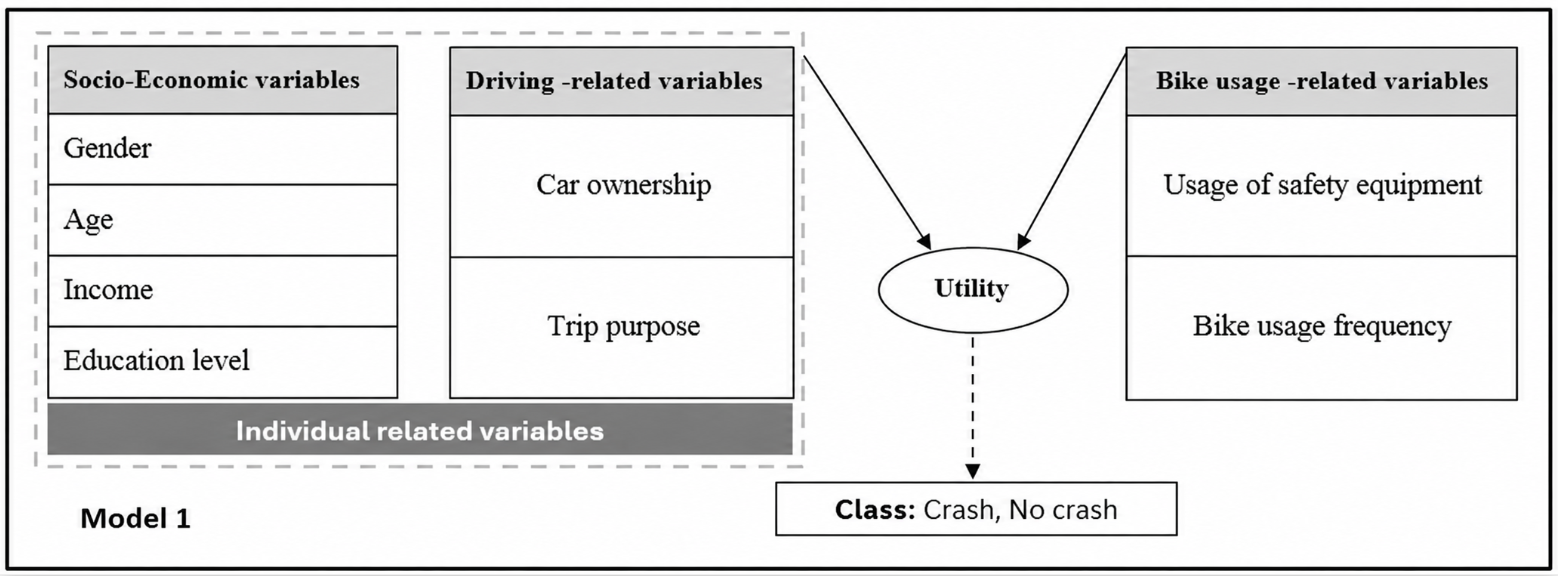
In this study, basic descriptive analyses were conducted for categorical variables, including gender, educational level, and trip purpose. Additionally, descriptive statistics, including means and standard deviations, were calculated for continuous variables like age and travel time. A correlational analysis was performed to assess the absence of multicollinearity among the independent variables. The associations between the independent variables and crash occurrences (dependent variable in Model 1) and crash reasons (dependent variable in Model 2) were examined using logistic regression, with a significance level set at p < 0.05 (95% confidence level). All statistical analyses were performed using R programming language version 4.3.0, utilizing the library (mlogit) package for logistic regression analysis. Model selection was based on Akaike Information Criterion (AIC), Bayesian Information Criterion (BIC), and McFadden R² values, with lower AIC and BIC values and higher McFadden R² indicating better model fit.
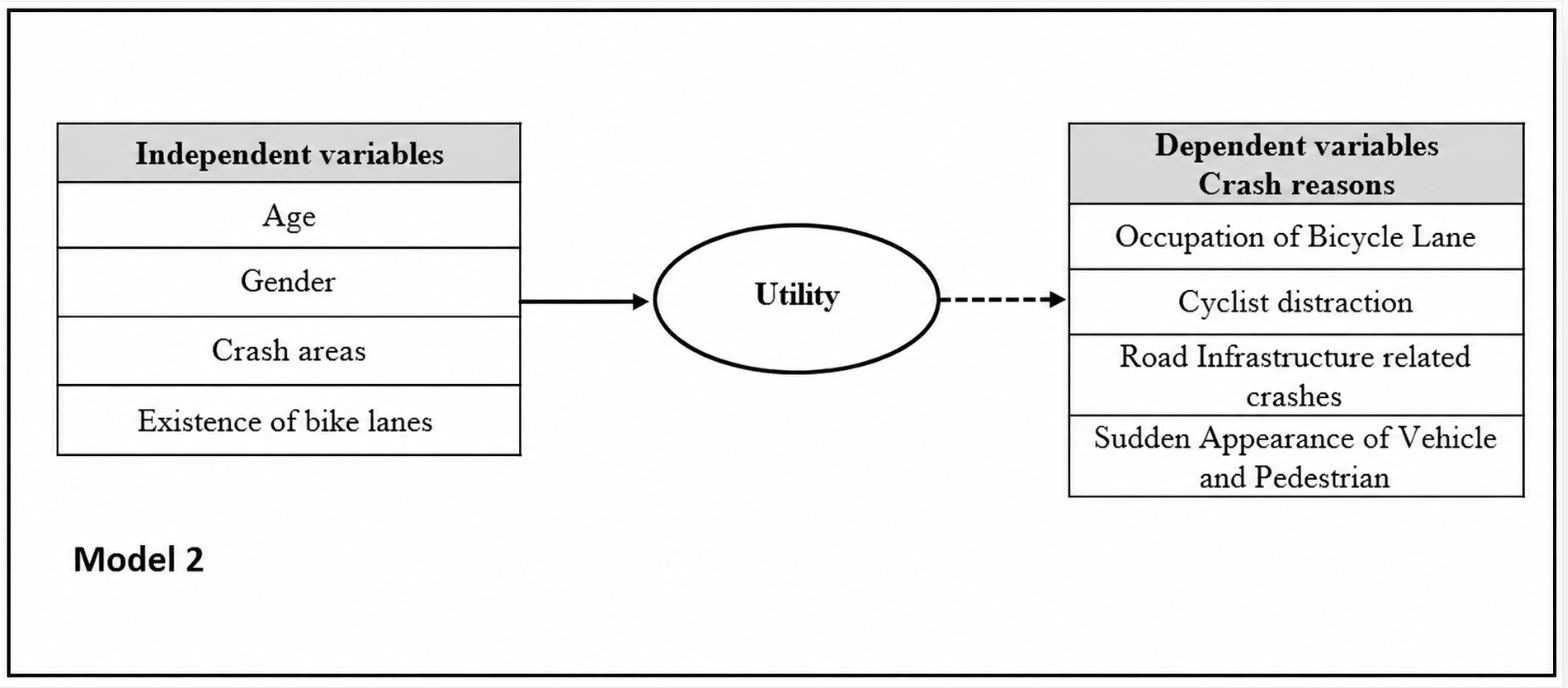
Two logistic models are used to predict the independent variables; the first model is a binary logit model, which is generated for predicting the occurrence of bike crashes (Yes/ No). The second model is a multinomial logit model that is used to predict the crash reasons (four reasons) based on a set of independent variables. The conceptual modelling frameworks for the binary and multinomial logit models are shown in Figure 2 and 3. The multinomial logit model is the most popular and standard model used by most practitioners (Louviere et al., 2000). The utility of the dependent variables is a function of observed components and unobserved components, as shown in Equation 1 (D. A. Hensher et al., 2005).
\begin{eqnarray} U_{j} = V_{j} + \varepsilon_{j}\tag{1} \end{eqnarray}
Where, Uj represents the utility function of the dependent variable j, Vj represents the observed component as shown in Equation 2, εj represents an unobserved component.
\begin{eqnarray} V_{j} = \beta_{0j} + \beta_{1j}X_{1} + \beta_{2j}X_{2} + \ldots + \ \beta_{kj}X_{k}\tag{2} \end{eqnarray}
Where, β0j is called a variable-specific constant for dependent variable j, which represents the mean of all unobserved resources of the utility. βkj is the coefficient or parameter of the independent variables Xk.
The probability formula for each dependent variable in the logistic regression is shown in Equation 3.
\begin{eqnarray} P_{j} = \frac{e^{V_{j}}}{\sum_{i = 1}^{I}e^{V_{i}}}\tag{3} \end{eqnarray}
In addition to the regression models, spatial analysis was conducted in QGIS, an open-source, cross-platform geographic information system, to map the distribution of bicycle crashes across Izmir.
4. Result
4.1 Descriptive statistics of study variables
Basic descriptive statistical analysis was conducted for socio-demographic and bike-use-related variables. The analysis was conducted to include the following variables: Age, Gender, Educational level, Income level, crash rate, purposes of bicycle usage, travel frequency, safety equipment, and bike crash reasons in Izmir city.
Participants in this study were bicycle users (n = 1796) from Izmir, Turkey, comprised of 444 women (24.7%) and 1352 men (75.3%), with an average of M = 33.22 (SD = 15.6) years of age, the minimum age was 11, while the maximum was 79 years old. The average length of each bicycle journey was M = 19.56 (SD = 11.75) min, with two outlier values of 58 and 60 min, as presented in Figure 4. The percentage of users who had crashes were 25%.
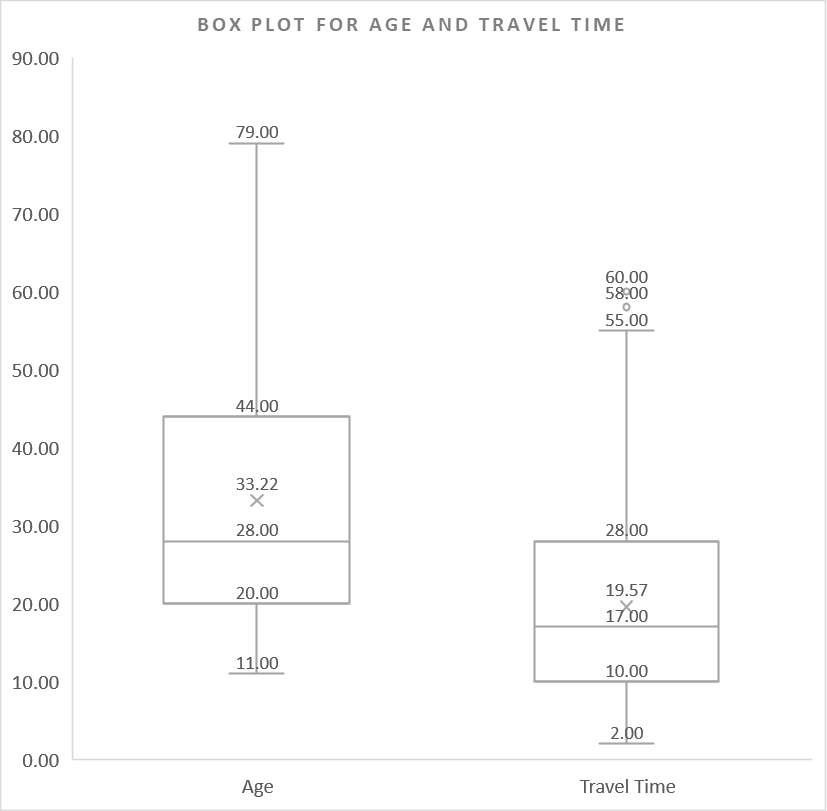
Table 1 provides a detailed description of the sample population's characteristics. The age distribution was fairly even across groups; cyclists aged below 20 years made up 26% (n=475), and those aged 21–45 accounted for 26% (n=471). As for socio-economic attributes, income values were converted to euros (1 € ≈ 25.77 TL) using the average exchange rate for the relevant period. The most frequent income range among participants was 10,000–20,000 TL (€388 – €776), accounting for 64% of the total sample. Continuous mobility measures indicated that the mean cycling travel time per day was 31.74 minutes (SD=39.48).
| Variable | Category | Frequency (Count) / Mean | Percentage (%) / SD |
|---|---|---|---|
| Gender | Female | 444 | 25% |
| Male | 1352 | 75% | |
| Age Group | Less than 20 years | 475 | 26% |
| 21–30 years | 471 | 26% | |
| 31-45 years | 442 | 25% | |
| 45+ years | 408 | 23% | |
| Car Ownership | No | 176 | 10% |
| Yes | 1620 | 90% | |
| Cycling Frequency | Every day | 858 | 48% |
| 2–3 times a week | 691 | 38% | |
| 1–2 times a month | 188 | 11% | |
| 1–2 times a year | 59 | 3% | |
| Trip Purpose | Work | 599 | 33% |
| School | 287 | 16% | |
| Recreation | 779 | 43% | |
| Other | 131 | 8% | |
| Safety Equipment | No | 775 | 43% |
| Yes | 1021 | 57% | |
| Income Level | Less than 10,000 TL (< €388) | 259 | 14% |
| 10,000 – 20,000 TL (€388 – €776) | 1153 | 64% | |
| 20,000 – 30,000 TL (€776 – €1.164) | 338 | 19% | |
| More than 30,000 TL (>€ 1.164) | 46 | 3% | |
| Crash History | No (Did not have a crash) | 1345 | 75% |
| Yes (Had a bike crash) | 451 | 25% | |
| Travel time (minutes/day) | Mean, (SD) | 31.74 | 39.48 |
| Travel distance (km/day) | Mean, (SD) | 6.89 | 9.89 |
Table 2 presents cycling characteristics by participants' crash involvement and identifies significant cross-tabulated variables directly from the table. First, there is an apparent difference in demographics: only 20% of men cyclists have crashed, compared with 39% of women cyclists. Moreover, the percentage of those aged less than 20 years who crashed was 42%, decreasing with age. Regarding safety equipment use, notable differences were observed, with 35% of cyclists who did not use safety equipment having experienced crashes, compared with only 18% of regular safety equipment users. Safety equipment usage is crucial as it helps protect cyclists in the event of a crash. Helmets, for example, can reduce head injuries. Other essential equipment includes reflective clothing, lights, and brakes. In the end, this bivariate analysis sets the basis for the description that will support the multivariable logit regression analysis.
| Variable | Category | Did Not Have a Crash | Had a Bike Crash | Had a Bike Crash | Total Group Count | Total Group Count |
|---|---|---|---|---|---|---|
| Gender | Female | 269 (61%) | 269 (61%) | 175 (39%) | 175 (39%) | 444 (100%) |
| Male | 1076 (80%) | 1076 (80%) | 276 (20%) | 276 (20%) | 1352 (100%) | |
| Age Group | Under 20 years | 276 (58%) | 276 (58%) | 200 (42%) | 200 (42%) | 475 (100%) |
| 21–45 years | 353 (75%) | 353 (75%) | 119 (25%) | 119 (25%) | 471 (100%) | |
| 46–65 years | 356 (81%) | 356 (81%) | 86 (19%) | 86 (19%) | 442 (100%) | |
| 65+ years | 360 (88%) | 360 (88%) | 48 (12%) | 48 (12%) | 408 (100%) | |
| Car Ownership | No | 19 (12%) | 19 (12%) | 157 (88%) | 157 (88%) | 176 (100%) |
| Yes | 1326 (82%) | 1326 (82%) | 294 (18%) | 294 (18%) | 1620 (100%) | |
| Cycling Frequency | Every day | 782 (91%) | 782 (91%) | 76 (9%) | 76 (9%) | 858 (100%) |
| 2–3 times a week | 484 (70%) | 484 (70%) | 207 (30%) | 207 (30%) | 691 (100%) | |
| 1–2 times a month | 69 (37%) | 69 (37%) | 119 (63%) | 119 (63%) | 188 (100%) | |
| 1–2 times a year | 10 (17%) | 10 (17%) | 49 (83%) | 49 (83%) | 59 (100%) | |
| Trip Purpose | Work | 432 (72%) | 432 (72%) | 167 (28%) | 167 (28%) | 599 (100%) |
| School | 195 (68%) | 195 (68%) | 92 (32%) | 92 (32%) | 287 (100%) | |
| Recreation | 618 (79%) | 618 (79%) | 161 (21%) | 161 (21%) | 779 (100%) | |
| Other | 100 (76%) | 100 (76%) | 31 (24%) | 31 (24%) | 131 (100%) | |
| Safety Equipment | No | 504 (65%) | 504 (65%) | 271 (35%) | 271 (35%) | 775 (100%) |
| Yes | 841 (82%) | 841 (82%) | 180 (18%) | 180 (18%) | 1021 (100%) | |
| Income Level | Less than 10,000 TL (< €388) | 101 (39%) | 101 (39%) | 158 (61%) | 158 (61%) | 259 (100%) |
| 10,000 – 20,000 TL (€388 – €776) | 895 (78%) | 895 (78%) | 258 (22%) | 258 (22%) | 1153 (100%) | |
| 20,000 – 30,000 TL (€776 – €1.164) | 314 (93%) | 314 (93%) | 24 (7%) | 24 (7%) | 338 (100%) | |
| More than 30,000 TL (>€1.164) | 35 (78%) | 35 (78%) | 11 (22%) | 11 (22%) | 46 (100%) |
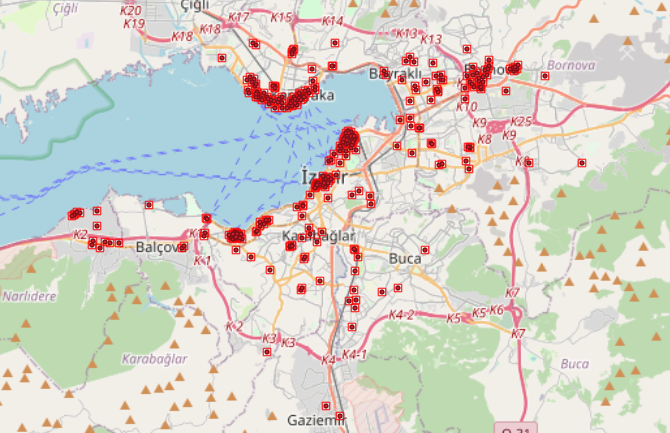
The analysis of bicycle crash data in Izmir, conducted in QGIS, identifies high-risk areas. The analysis processed 451 bicycle crash points to create a heat map, illustrating the locations where crashes occurred. The resulting heat map (Figure 5) shows where bicycle crashes occurred, revealing that crashes occur both in designated bicycle lanes and in areas without such infrastructure.
The region with the highest number of crashes is Konak, accounting for 63% of the total, followed by Karsiyaka with 15%, and Bornova with 12%. Despite Konak and Karsiyaka having bicycle lanes, primarily along the coastline, they still experience a high number of crashes. In contrast, Bornova, which lacks bicycle lanes, ranks third in crash rates. This higher incidence in Bornova is likely due to the area being a university district, where many school trips are made by bicycle.
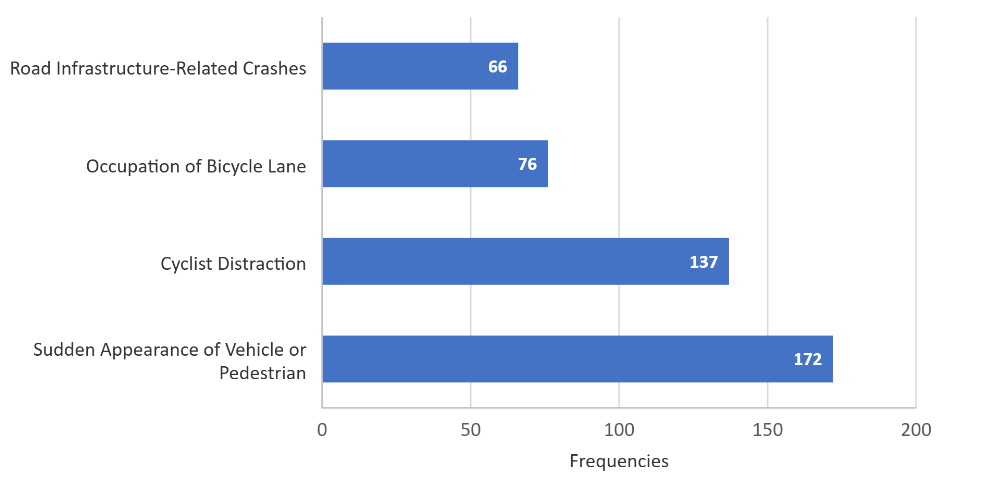
387 of 451 bicycle users. The most significant cause of crashes was the sudden appearance of vehicles and pedestrians (Figure 6). This was largely because bicycle lanes in the city are mostly limited to the coastline. As a result, most cycling crashes do not occur on these lanes but occur on the roads where bikers interact with other road users. The next most important cause of crashes was cyclist distraction.
4.2 Logistic Regression
The first model (model 1) examines the effects of socio-demographic variables and bike riding-related variables on the probability of bike crash occurrence by using a binary logistic regression. The results of the second model (model 2) are analysed using a multinomial logit model to predict crash reasons. In the second model, only crash data- the data of the people who caused crashes was used.
4.2.1 Bike crash occurrence model
The effects of the bike driver's socio-demographic characteristics and bike-riding-related variables on crashes were modelled using binary logistic regression. All variables were tested for multicollinearity, and none were found to be correlated. Table 3 presents the variables used in the model and their parameters. The dependent variable is crash occurrence, coded as a dummy variable (Yes/No), with No as the reference level. All variables presented in Table 3 are significant with 95% confidence level.
| Variable | Parameter (B) | Std. Error | z-value | P-value |
|---|---|---|---|---|
| Constant | 2.561 *** | 0.43182 | 5.9301 | 0.000 |
| Age (ref: Less than 20 years) | ||||
| From 21 years to 30 years | -0.493 ** | 0.22938 | -2.1493 | 0.032 |
| From 31 years to 45 | -0.736 *** | 0.23396 | -3.1445 | 0.002 |
| More than 45 years | -1.216 *** | 0.30548 | -3.9811 | 0.000 |
| Gender (ref: Female) | ||||
| Male | -0.925 *** | 0.18975 | -4.8759 | 0.000 |
| Income (ref: Less than 10000 TL) | ||||
| More than 10000 TL to 20000 TL | -1.285 *** | 0.21675 | -5.9283 | 0.000 |
| More than 20000 TL to 30000 TL | -2.5 *** | 0.33757 | -7.4046 | 0.000 |
| More than 30000 TL | -1.511 ** | 0.61968 | -2.4389 | 0.015 |
| Education (ref: less than high school) | ||||
| High School degree | -0.833 *** | 0.21682 | -3.8427 | 0.000 |
| Bachelor’s degree | -1.088 *** | 0.25201 | -4.318 | 0.000 |
| Graduate degree (MSc, PhD) | -0.884 ** | 0.42655 | -2.0714 | 0.038 |
| Bike usage frequency (ref: Every day) | ||||
| A few times a week | 1.905 *** | 0.23163 | 8.2225 | 0.000 |
| A few times a month | 3.122 *** | 0.28976 | 10.7736 | 0.000 |
| Rarely | 3.919 *** | 0.41445 | 9.456 | 0.000 |
| Bike trip purpose (ref: Recreational) | ||||
| Work | 1.271 *** | 0.21115 | 6.0215 | 0.000 |
| School | 0.741 *** | 0.27699 | 2.6719 | 0.008 |
| Car ownership (ref: No) | ||||
| YES | -3.192 *** | 0.28216 | -11.3115 | 0.000 |
| Safety equipment usage (ref: No) | ||||
| Yes | -0.587 *** | 0.1814 | -3.2383 | 0.001 |
| AIC | 978.096 | 978.096 | 978.096 | 978.096 |
| BIC | 1087.963 | 1087.963 | 1087.963 | 1087.963 |
| McFadden R2 | 0.478 | 0.478 | 0.478 | 0.478 |
Individual- and bike-riding-related variables were used to predict the likelihood of bike crashes. All variables: Age, Gender, Income, Education level, Bike usage frequency, Bike trip purpose, Car ownership, and Safety equipment usage were found to be significant. The p-value results were obtained and shown in Table 3. The p-values for each variable are less than 0.05, indicating that the variables differ from zero at the 0.05 level. The outcomes of applying the binary logit regression model are presented in Table 3. From the model statistics, it can be seen that the AIC and BIC were 978.096 and 1087.963, respectively. These values indicate that the model balances fit and complexity, with lower values being preferred for comparison with the other generated models that gave higher values. The McFadden R² of 0.478 indicates a good fit, indicating that the model explains approximately 47.8% of the variance in the dependent variable. According to Louviere et al. (2000), a value between 0.2 and 0.4 indicates a good model fit for logistic regression, suggesting that the model performs quite well.
The constant represents the mean of all unobserved resources of the utility. It can be seen that the coefficient for crash occurrence (“Yes”) is significantly different from zero in the model. Based on the negative association between age and crashes, older cyclists are less likely to be involved in crashes, aligning with studies suggesting that older individuals drive more rationally and adhere to traffic rules (R. Seva et al., 2013). The age parameters could be interpreted as older people drive rationally, obey traffic rules, and avoid risky behaviour such as speeding, maneuvering, and overtaking. Since most bike users are young people, it is crucial to understand the behavioural characteristics of these individuals that could influence bike crashes in Izmir. Regarding gender, male cyclists are less likely to have crashes than females, consistent with J. Liu et al. (2020) and Ma et al. (2022). This contrasts with other studies that suggest males are more prone to crashes due to riskier behaviour, a higher tendency to break traffic rules, and driving behaviour (Behnood & Mannering, 2017; Rash-ha Wahi et al., 2018).
People with an income exceeding 10,000 TL are less likely to have a bike crash, as indicated by the negative parameters. This finding aligns with (Roshanfekr et al., 2020) research, which found that individuals in the lowest income group had a 2.3 times greater risk of death from a crash and an 11.7 times greater risk of crash disability compared to those in the third income quartile. Not surprisingly, users with higher educational attainment are less likely to experience crashes. This might be because educated individuals are more aware of the risks of crashes and more likely to follow traffic rules. However, this finding contrasts with that of Bogusiak et al. (2018), which found that people with secondary education or incomplete higher education were almost twice as likely to avoid crashes as those with a university degree.
The results indicated that users who used the bike less frequently were associated with positive parameters, such as crashes. In other words, users who ride the bike rarely or a few times a month are more likely to be involved in bike crashes due to their lack of experience, compared with daily users who are experienced riders. Compared with recreational trips, work and school trips are associated with a higher crash rate, since in Izmir the majority of people use bikes for recreational purposes rather than for work or school. The results showed that bike users who have cars are less likely to have crashes. This could be justified by the perception that car drivers are more experienced with driving conditions and rules; therefore, they drive carefully, and this driving behaviour is reflected when they ride bikes. It can be seen that the car ownership parameter has the highest weight in the model, indicating its strong influence. Using safety equipment, such as a helmet and a reflective vest, while riding a bike reduces the risk of bike crashes.
4.2.2 Bike crash reasons model
The multinomial logit model shows the effect of four categorical variables on predicting bike crash reasons (see Table 4). Crash reasons were elicited using individual-related variables (Age, Gender) and area-related variables (Existing bike lane, Crash area). All parameters are significant at the 95% confidence level, with a few at the 90% level. The model was assessed using AIC, BIC, and McFadden R².
Table 4 presents the results according to four bike crash reasons: “Occupation of Bicycle Lane” (reference), “Cyclist Distraction,” “Road Infrastructure Issues,” and “Sudden Appearance of Vehicle and Pedestrian.” Using this as a reference allows for meaningful comparisons across other categories, which typically represent more complex or severe scenarios (e.g., sudden appearances or infrastructure-related issues). Furthermore, this approach aligns with methodological practices in multinomial logit modelling, where the reference category is selected to be a widely observed, theoretically neutral baseline for interpreting the relative effects of explanatory variables.
The model was selected based on the highest McFadden Pseudo R² (0.107) and the lowest AIC (1106.553) and BIC (1229.964) values. The results underline how socio-demographic and area-specific variables influence the likelihood of different crash types, offering insights into targeted interventions for enhancing cyclist safety.
| Variable | Parameter (B) | Std. Error | z-value | P-value |
|---|---|---|---|---|
| Cyclist distraction | ||||
| Constant | 2.579 *** | 0.686 | 3.758 | 0.000 |
| Age (ref: Less than 20 years) | ||||
| From 21 years to 30 years | -0.911 * | 0.521 | -1.750 | 0.080 |
| From 31 years to 45 | -1.496 *** | 0.554 | -2.699 | 0.007 |
| More than 45 years | -1.548 *** | 0.576 | -2.687 | 0.007 |
| Crash area (ref: Konak) | ||||
| Karsiyaka | -1.086 ** | 0.507 | -2.143 | 0.032 |
| Bornova | -1.38 ** | 0.561 | -2.461 | 0.014 |
| Balçova | -1.551 ** | 0.631 | -2.458 | 0.014 |
| Buca | -1.6 ** | 0.768 | -2.084 | 0.037 |
| Bike lane (ref: No) | ||||
| Yes | -1.001 ** | 0.473 | -2.115 | 0.034 |
| Gender (ref: Female) | ||||
| Male | 1.373 *** | 0.472 | 2.910 | 0.004 |
| Road Infrastructure-related crashes | ||||
| Constant | 2.421 *** | 0.742 | 3.263 | 0.001 |
| Age (ref: Less than 20 years) | ||||
| From 21 years to 30 years | -1.115 * | 0.574 | -1.940 | 0.052 |
| From 31 years to 45 | -1.512 ** | 0.608 | -2.487 | 0.013 |
| More than 45 years | -1.639 ** | 0.637 | -2.575 | 0.010 |
| Crash area (ref: Konak) | ||||
| Karsiyaka | -3.054 *** | 0.852 | -3.584 | 0.000 |
| Bornova | -2.753 *** | 0.781 | -3.525 | 0.000 |
| Balçova | -1.317 ** | 0.666 | -1.977 | 0.048 |
| Buca | -1.327 * | 0.801 | -1.657 | 0.098 |
| Bike lane (ref: No) | ||||
| Yes | -1.239 ** | 0.506 | -2.449 | 0.014 |
| Gender (ref: Female) | ||||
| Male | 1.206 ** | 0.532 | 2.268 | 0.023 |
| Sudden Appearance of Vehicle and Pedestrian | ||||
| Constant | 2.824 *** | 0.686 | 4.115 | 0.000 |
| Age (ref: Less than 20 years) | ||||
| From 21 years to 30 years | -1.822 *** | 0.537 | -3.393 | 0.001 |
| From 31 years to 45 | -1.661 *** | 0.547 | -3.037 | 0.002 |
| More than 45 years | -1.561 *** | 0.564 | -2.767 | 0.006 |
| Crash area (ref: Konak) | ||||
| Karsiyaka | -1.025 ** | 0.505 | -2.030 | 0.042 |
| Bornova | -1.372 ** | 0.556 | -2.467 | 0.014 |
| Balçova | -2.09 *** | 0.681 | -3.070 | 0.002 |
| Buca | -1.331 * | 0.754 | -1.767 | 0.077 |
| Bike lane (ref: No) | ||||
| Yes | -0.978 ** | 0.475 | -2.059 | 0.039 |
| Gender (ref: Female) | ||||
| Male | 1.43 *** | 0.480 | 2.979 | 0.003 |
| AIC | 1106.553 | 1106.553 | 1106.553 | 1106.553 |
| BIC | 1229.964 | 1229.964 | 1229.964 | 1229.964 |
| McFadden R2 | 0.107 | 0.107 | 0.107 | 0.107 |
Cyclist distraction
The constant is positively significant and differs from zero. Regarding age, older cyclists are less likely to be involved in distraction-related crashes, with those over 45 years showing the strongest negative effect. The results indicate that younger and adolescent people are more likely to be involved in distraction-related incidents due to driving inexperience, high adoption of communication technology, increased peer involvement, and a tendency to take risks (Buckley et al., 2014; Feenstra et al., 2011). The existence of bike lanes reduces the risk of distraction-related crashes, as dedicated lanes are thought to reduce surrounding traffic distractions. The results show that males increase the utility of distraction-related crashes. Regarding the crash area variable, the results show that distraction-related crashes are less likely in Bornova, Karsiyaka, Buca, and Balcova than in Konak.
Road infrastructure-related crashes
The results indicate that factors such as age, crash location, bike lane availability, and gender significantly influence the likelihood of infrastructure-related crashes. Regarding crash location, Karsiyaka is found to be the most negatively affected, which can be attributed to good traffic planning, wide bike lanes, and proper road network geometry. The second most negative location is Bornova, due to better planning compared to other areas like Buca and Balcova. As for gender, male cyclists are more likely to be involved in crashes. Moreover, the availability of bike lanes considerably decreases this probability.
This research aligns with prior studies, as it is well known that bike crashes often occur due to infrastructure problems, including intersection planning, bike lanes, bike-specific traffic light systems, and other geometric road parameters (Reynolds et al., 2009). It was estimated that bike lanes reduce bike crashes by 53% (Reynolds et al., 2009). Additionally, infrastructure-related issues may lead to severe injuries caused by crashes (Kim et al., 2007).
Sudden appearance of vehicle and pedestrian
According to the findings, the occurrence of sudden vehicle and pedestrian appearances is significantly influenced by age, crash location, bike lane availability, and gender. The results show that cyclists aged over 20 are less likely to be involved in sudden appearance crashes than the youngest age group (under 20), suggesting that younger cyclists are disproportionately vulnerable, possibly due to less experience in anticipating the unexpected movements of vehicles and pedestrians at intersections. The presence of dedicated bike lanes significantly reduces the likelihood of such crashes. Additionally, males are more susceptible to crashes resulting from sudden appearances. In terms of crash-prone areas, Balcova stands out with a parameter of -2.09, reflecting lower cyclist-vehicle interaction due to fewer cyclists in the area.
These findings are consistent with the literature. Crashes involving cyclists, vehicles, and pedestrians can pose severe, often fatal consequences, with the majority occurring on shared pedestrian-bicycle lanes or roads (Mesimäki & Luoma, 2021). Studies have also shown that perception-reaction times increase with age, particularly for individuals over 55 (Ashok et al., 2016; Svetina, 2016), which may partly explain why younger cyclists are less prepared to react to sudden appearances.
5. Discussion
The choice of Izmir as the focus city for this study is significant due to its unique urban dynamics and investments in sustainable transport policies. As Turkey's third-largest city and a rapidly growing metropolitan area, Izmir faces increasing challenges related to traffic congestion, air pollution, and the need for sustainable mobility solutions. Recent investments in cycling infrastructure and the promotion of environmentally friendly transport alternatives make Izmir an ideal case study to examine the intersection of cycling and safety. Furthermore, the city's diverse socioeconomic structure and varying urban densities provide a valuable basis for analysing the factors contributing to cycling crashes. The insights gained from Izmir can serve as a model not only for other Turkish cities but also for global metropolitan regions with similar characteristics.
Understanding the underlying causes of cycling crashes is critical for developing effective prevention strategies. Crashes are often caused by inadequate infrastructure, driver negligence, non-compliance with traffic rules, and inadequate protective equipment. Poorly designed or non-existent cycle lanes increase interactions between cyclists and motor vehicles, increasing the likelihood of crashes. In addition, inexperienced cyclists often struggle to obey traffic rules, further increasing the risk of crashes. Addressing these issues requires comprehensive measures, such as infrastructure improvements, traffic education programs, and public awareness campaigns, to promote safe cycling.
Consistent with the literature, this study emphasizes the critical role of infrastructure in enhancing cyclist safety (Reynolds et al., 2009; Buehler & Dill, 2016). Separated cycle lanes significantly reduce the risk of crashes by minimizing the interaction between cyclists and motor vehicles. This finding highlights the importance of prioritizing segregated cycling infrastructure, especially in densely populated urban areas. Moreover, the geometry of bicycle facilities could also affect the safety of cyclists, considering that there is evidence indicating that sharp horizontal curves cause lane deviations and cyclists’ conflicts (Sabbaghian et al., 2024). Furthermore, Bjørnskau et al. (2025) reported that approximately 73% of bicycle and e-scooter crashes were single-vehicle incidents, with infrastructure-related hazards representing one of the principals contributing factors.
Our results align with previous studies, showing that younger cyclists are more prone to crashes due to inexperience and risky behaviours (Behnood & Mannering, 2017; Scholes et al., 2018). Gender differences observed in this study also reflect common patterns in the literature, where male cyclists are more frequently involved in crashes but are less likely to report incidents with severe injuries (Liu et al., 2020).
The multinomial logit model identifies key crash causes, including cyclist distraction, poor road infrastructure, and the sudden appearance of vehicles or pedestrians. These findings are consistent with global trends (Kim et al., 2007; Mesimäki & Luoma, 2021) and highlight the need for targeted interventions. Infrastructure investments, combined with awareness campaigns to educate both cyclists and drivers on safe road-sharing practices, are essential. Encouraging the use of helmets and reflective gear, as emphasized by Thompson et al. (1996), could further mitigate the severity of injuries in crashes.
Finally, the spatial distribution of crashes in Izmir shows higher rates in areas without adequate cycling infrastructure, consistent with international research on the role of urban design in cyclist safety (Buehler & Dill, 2016). These findings support integrating bicycle safety measures into broader urban mobility frameworks to promote safer, more inclusive environments for cyclists, as suggested by Vilaça et al., 2019.
This study contributes to the bicycle safety literature by offering a comprehensive, data-driven analysis of bicycle crashes from both socio-demographic and spatial perspectives in the urban context. While existing research has often focused either on infrastructural variables (Reynolds et al., 2009; Buehler & Dill, 2016) or behavioural variables (Behnood & Mannering, 2017; Scholes et al., 2018), the current study, for the first time, incorporates these variables under one framework through the use of binary and multinomial logit models to explore both crash occurrence and causes. Furthermore, using self-reported data from 1,796 cyclists in Izmir, this research identifies underreported bike crashes, which are typically underrepresented in official statistics. Including regional diversity within the city, along with variables such as infrastructure availability, cycling experience, and trip purpose, expands understanding of localized crash patterns. These findings not only contribute to global studies on safe cycling but also provide additional analysis beyond current literature reviewing cities developing cycling infrastructure in middle-income countries. The limitation of this study is that, although the survey was conducted face-to-face across multiple locations in Izmir and included cyclists from different cycling environments, the sampling approach relied on selecting cyclists at predefined locations and during predefined survey periods rather than using a fully citywide random sample. Therefore, the findings should be interpreted as representative of active cyclists observed at the surveyed locations and times, but not necessarily of all cyclists in Izmir, particularly given the city's large size and spatial diversity. In addition, the questionnaire relied on self-reported responses, potentially leading to subjective interpretation and bias in reported crash causes and safety practices. Furthermore, as the survey targeted active cyclists, it is subject to a bias: individuals who died as a result of a bicycle crash or who permanently stopped cycling following an injury are not represented in the sample. Therefore, this may lead to an underestimate not only of crash severity and the true frequency of serious crashes but also influence the observed relationships between cyclist characteristics, safety equipment use, crash causes, and crash locations So, the results should be interpreted as representative of active cyclists rather than the entire population of cyclists involved in crashes.
6. Conclusion
This study provides a comprehensive analysis of socio-demographic factors, behavioural patterns, and infrastructure elements that affect bicycle crashes in Izmir. The findings reveal significant differences in bicycle use by gender, age, education, and income, with younger, male, and lower-income cyclists more prone to crashes. In addition, the study highlights the protective role of safety equipment and the critical impact of dedicated bicycle lanes in reducing crash risks.
The logistic regression models indicate that factors such as cyclist distraction, weak road infrastructure, and the sudden appearance of vehicles or pedestrians are primary contributors to crashes. Furthermore, the presence of bike lanes and the consistent use of safety equipment significantly mitigate both the frequency and severity of crashes. These findings align with global research, highlighting the universal importance of well-designed cycling infrastructure and safety measures.
The analysis indicates that older cyclists, males, individuals with higher incomes, and those with higher educational qualifications are less likely to be involved in bicycle crashes. This finding suggests that experience, risk awareness, and adherence to traffic rules play a critical role in reducing crash risk. Car ownership emerges as the most influential variable in reducing crash risk, likely reflecting the benefits of broader driving experience and cautious behaviour. The second model shows that young cyclists are more prone to crashes caused by distractions and inadequate road infrastructure. This suggests that inexperience and a propensity to take risks are important contributing factors. In contrast, cyclists under 20 are more susceptible to crashes due to the presence of other vehicles and people, as they have relatively little experience anticipating such situations. Male cyclists are more likely to be involved in crashes in all categories. In regions with a high level of urban planning and cycling infrastructure, such as Karsiyaka and Bornova, fewer crashes were reported, particularly related to road infrastructure and distraction incidents among cyclists.
These findings provide valuable information for policymakers and urban planners in Izmir who are working to make the city safer for cyclists. It is important to focus on improving cycling infrastructure, especially in areas where crashes are more likely to happen. People should be more encouraged to use separated cycle lanes. Moreover, reducing crash risks by teaching younger and less experienced cyclists about safety. By creating safety measures tailored to the specific needs of the region and the types of crashes that occur there, we can make the city even safer and support its goals of being sustainable and easy to get around.
Future research should investigate integrating emerging technologies, such as real-time traffic monitoring systems, into cycling infrastructure to improve safety further. Furthermore, investigating the effects of weather conditions, urban planning strategies, and cultural or behavioural factors will provide valuable insights for formulating comprehensive safety policies. Advanced modelling approaches, such as hybrid logit models, can offer a deeper understanding by incorporating latent variables, such as perceived safety and comfort, into analyses of crash events and their causes.
By focusing on the interaction among cyclist behaviour, infrastructure, and socio-demographic factors, this study contributes to a growing body of research advocating for safer and more sustainable urban mobility. The insights gained here can inform targeted interventions not only in Izmir but also in other urban contexts worldwide, paving the way for safer, more accessible, and environmentally friendly cities.
Although this study focuses on İzmir, the findings have broader practical implications for other areas with developing cycling infrastructure and mixed traffic conditions. The identified relationships between cyclist characteristics, trip purposes, safety equipment usage, and crash occurrence can support policymakers and transport planners in designing targeted cycling safety interventions in similar metropolitan contexts. The integration of questionnaire-based behavioral data with multinomial logistic regression models provides a transferable framework for analyzing cyclist safety, crash occurrence, and crash causes across different urban and infrastructural conditions. However, differences in cycling culture, infrastructure quality, traffic regulations, and urban form should be considered when generalizing the findings to other regions.
CRediT contribution
Elia Odabasi: Conceptualization, Data curation, Methodology, Writing – original draft. Mohammed Hajouj: Conceptualization, Formal analysis, Methodology, Writing – original draft. Yalçın Alver: Conceptualization, Methodology, Supervision, Writing – review & editing.
Acknowledgements
The authors would like to thank the Izmir Municipality for providing access to the survey data used in this study.
Declaration of competing interests
The authors report no competing interests.
Declaration of generative AI use
The authors declare that no generative AI was used in preparing this work.
Prior dissemination declaration
This manuscript presents original work that has not been previously published or disseminated in any form.
Ethics statement
Participation in the survey was voluntary, and respondents were informed of the study's purpose before the survey began. No personally identifiable information was collected, and all responses were treated anonymously and confidentially. The collected data were used solely for academic research purposes.
Funding statement
No external funding was used in this research.
Data availability statement
Data is available from the corresponding author upon reasonable request.
Code availability statement
The code used to estimate the models is available from the corresponding author upon reasonable request.
Editorial information
Handling editor: Baran Ulak, University of Twente, the Netherlands.
Reviewers: İbrahim Öztürk, University of Leeds, the United Kingdom; Caroline Tait, University of Leeds, the United Kingdom.
Submitted: 11 January 2026; Accepted: 16 July 2026; Published: 31 July 2026.