The effect of navigation modalities on driver performance, workload and user experience: a simulator study
Abstract
Young novice drivers are overrepresented in crash statistics, highlighting the need for effective training interventions. Swedish authorities have discussed simulator-based screening tests to improve licensing outcomes. This study investigated how visual versus auditory navigation instructions affect driving performance, cognitive load, and user experience in a driving simulator. A highly relevant comparison as the real-world driving tests uses auditive navigation through an examinator. Fifty students at an automotive high school with prior driving simulator experience were assigned to either a visual or auditory instruction group. Participants completed urban driving scenarios with intersections and roundabouts, while metrics such as speed, lane positioning, acceleration/braking, distance to other vehicles, and adherence to traffic rules and instructions were recorded. Cognitive load and user experience were assessed post-drive using NASA-TLX and Likert-scale surveys. Participants receiving auditory instructions committed significantly fewer breaches than those with visual instructions, suggesting there is less driving performance compromise in the auditory navigation condition as compared to the visual navigation condition. No significant difference between groups appeared for cognitive load. These results suggest that auditory instructions better reflect real-world driving test conditions and may enhance the ecological validity of simulator-based screening tests for novice drivers.
1. Introduction
Traffic safety remains a major public health concern, and young drivers consistently demonstrate a disproportionately high crash risk. This elevated risk has been documented across countries and is commonly attributed to limited driving experience, heightened risk-taking, and reduced hazard anticipation skills (Banz et al., 2019; Elvik, 2010; Walshe et al., 2017). Research has repeatedly shown that young drivers tend to underestimate risks and overestimate their driving abilities, resulting in poorer calibration between skill and perceived competence (Fisher et al., 2006; McKnight & McKnight, 2003). These challenges underline the enduring need for evidence-based training and assessment methods that support the development of safe driving habits.
Efforts to increase road safety often draw on Harvey’s “Three E’s” of Education, Enforcement, and Engineering (Groeger, 2000), with Education forming a central pillar in shaping novice drivers’ hazard perception and decision-making. Driving simulators have become widely used educational tools across transport domains due to their ability to provide safe, repeatable, and controlled environments for training and assessment. Extensive research demonstrates their effectiveness in supporting visual scanning, hazard anticipation, and risk evaluation in both novice and professional drivers (Bates et al., 2018; Casutt et al., 2014; Olsson et al., 2021; Pollatsek et al., 2011). Simulator studies also contribute to the broader understanding of driving-related cognition by enabling systematic manipulation of workload, attention demands, and task complexity (de Winter et al., 2012; Jackson et al., 2013).
In parallel, many countries have incorporated hazard perception tests (HPTs) into licensing systems to assess a driver’s ability to detect and respond to risky situations (Crundall et al., 2021; Ventsislavova et al., 2019). Beyond traditional video-based HPTs, an extensive literature examines how cognitive load, visual attention, and working memory demands influence hazard perception and driving behaviour in both simulator and naturalistic settings. Studies on driver distraction and dual-task interference consistently show that visual load is particularly disruptive to driving performance, reducing hazard detection, situational awareness, and response speed (Horrey & Wickens, 2006; Strayer & Johnston, 2001; Engström et al., 2017). This research highlights the fundamental role of attentional resource allocation in safe driving, providing important context for examining instructional design and modality effects.
In Sweden, several recent initiatives have explored the potential for simulator-based tools to complement the on-road driving test. In recent years, Sweden has undertaken several research projects exploring an initiative similar to hazard perception testing. Declining pass rates and challenges in assessing novice drivers’ risk awareness, self-evaluation, and hazard perception have prompted interest in standardized simulator-based assessments. The Swedish Transport Administration and the Swedish Transport Agency have reported persistent difficulties in assessing risk perception and self-awareness during on-road driving tests, which has prompted consideration of driving simulators as a complementary assessment method (The Swedish Transport Administration & The Swedish Transport Agency, 2019).
In response, a simulator-based screening test has been developed in collaboration with the Swedish Transport Administration (Thorslund et al., 2024). Experts from the Swedish Transport Administration’s driving test unit, the Swedish Transport Agency, Sweden’s National Association of Traffic Schools, and other traffic educators actively contributed to the design of this screening test, which also includes a self-assessment of driving performance and perceived risk. This test exposes learners to controlled hazardous scenarios that cannot be reliably or safely reproduced in real-world examinations, allowing for more fine-grained assessment of specific driver behaviours
Initial evaluations show that the simulator-based assessment can identify learner drivers who consider themselves ready for the on-road test but who have not yet developed the level of risk awareness required for safe driving. These findings align with previous research showing that young drivers often struggle to accurately judge their own driving ability, reinforcing the potential of simulator-based tools to detect risky driving behaviour and support targeted training (Thorslund et al., 2024). Currently, the simulator screening test uses visual navigation guidance in the form of a GPS-style arrow interface. However, during the actual on-road driving test, navigation instructions are delivered auditorily by the examiner, creating a mismatch in instructional modality that may influence cognitive load.
A substantial literature across human factors, cognitive psychology, and human-machine interaction shows that visual-manual tasks impose higher cognitive demands than auditory tasks, particularly when both tasks draw on the same attentional resources (Wickens, 2002; Navon & Gopher, 1979; Spence & Ho, 2008). This pattern is not unique to driving; numerous laboratory studies demonstrate that auditory cues generally preserve visual attentional resources more effectively, leading to improved task performance in visually demanding environments. Driving research reflects these findings: visual navigation systems have been associated with increased workload, impaired hazard detection, and elevated crash risk, whereas auditory navigation tends to support better lane-keeping, situational awareness, and cognitive resource management (Dalton et al., 2013; Hendradewa & Della, 2023).
Together, this cross-disciplinary evidence highlights the importance of understanding how modality shapes cognitive load, attentional allocation, and safety-critical behaviours. Adjusting instruction modality within simulator-based assessments may therefore enhance ecological validity and bring simulator testing closer to the attentional demands of the real on-road examination.
1.1 Aim
This study aimed to examine how the modality of driving instructions (auditory vs. visual) affects driving performance and cognitive load in a practical driver examination. The research questions (RQ) are as follows:
RQ1: How does the modality of driving instructions impact simulator driving performance?
RQ2: How is perceived cognitive load affected by navigational modality?
RQ3: How do users experience the two navigation systems?
2. Method
Data were collected using a between-groups design at a Swedish automotive high school. These students were selected for their relevance to the research context, as they are within the age range of novice drivers and have established experience with driving simulators as part of their vocational training. A detailed description of the participants, materials, procedure, and analysis follows below.
2.1 Participants
A total of 50 participants took part in the study, with 25 assigned to each group through random allocation by their teacher. All participants had more than two years’ prior experience with driving simulators, as these were integrated into their high school curriculum. Both groups had a mean age of 17 years. Gender distribution was relatively balanced between groups: in the visual navigation group, 38.5% were female and 61.5% male, while in the auditory group, 37.5% were female and 62.5% male. As all participants were enrolled in an automotive high school, they had completed coursework equivalent to the mandatory requirements for obtaining a driver’s licence. As all participants are highly experienced in simulated driving with visual navigation, the visual group will be used as a baseline for evaluating auditive navigational instructions.
2.2 Equipment
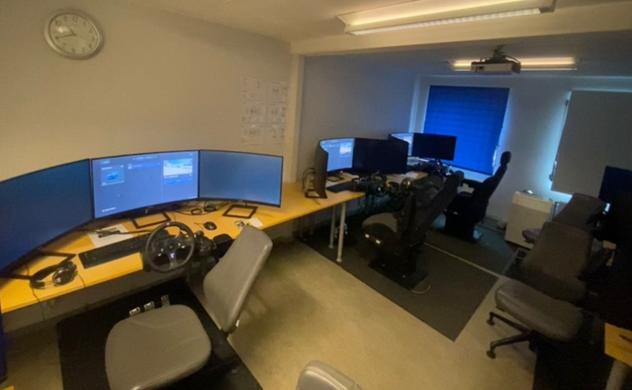
A fixed-base, medium-fidelity (Wynne et al., 2019) driving simulator equipped with Skillster software was used for the study. Skillster is a leading Swedish developer of driving simulation systems (Skillster.se). The simulator provided a 120-degree field of view across the forward display and included three functional rear-view mirrors to enhance situational awareness. It featured an automatic gearbox, and auditory feedback was delivered through headphones to ensure immersion and reduce external distractions. The simulators used in this study are shown in Figure 1.
2.2.1 Visual instructions
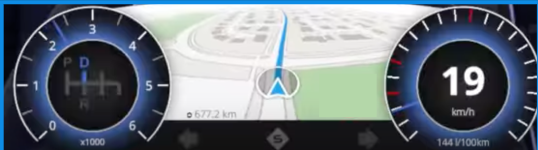
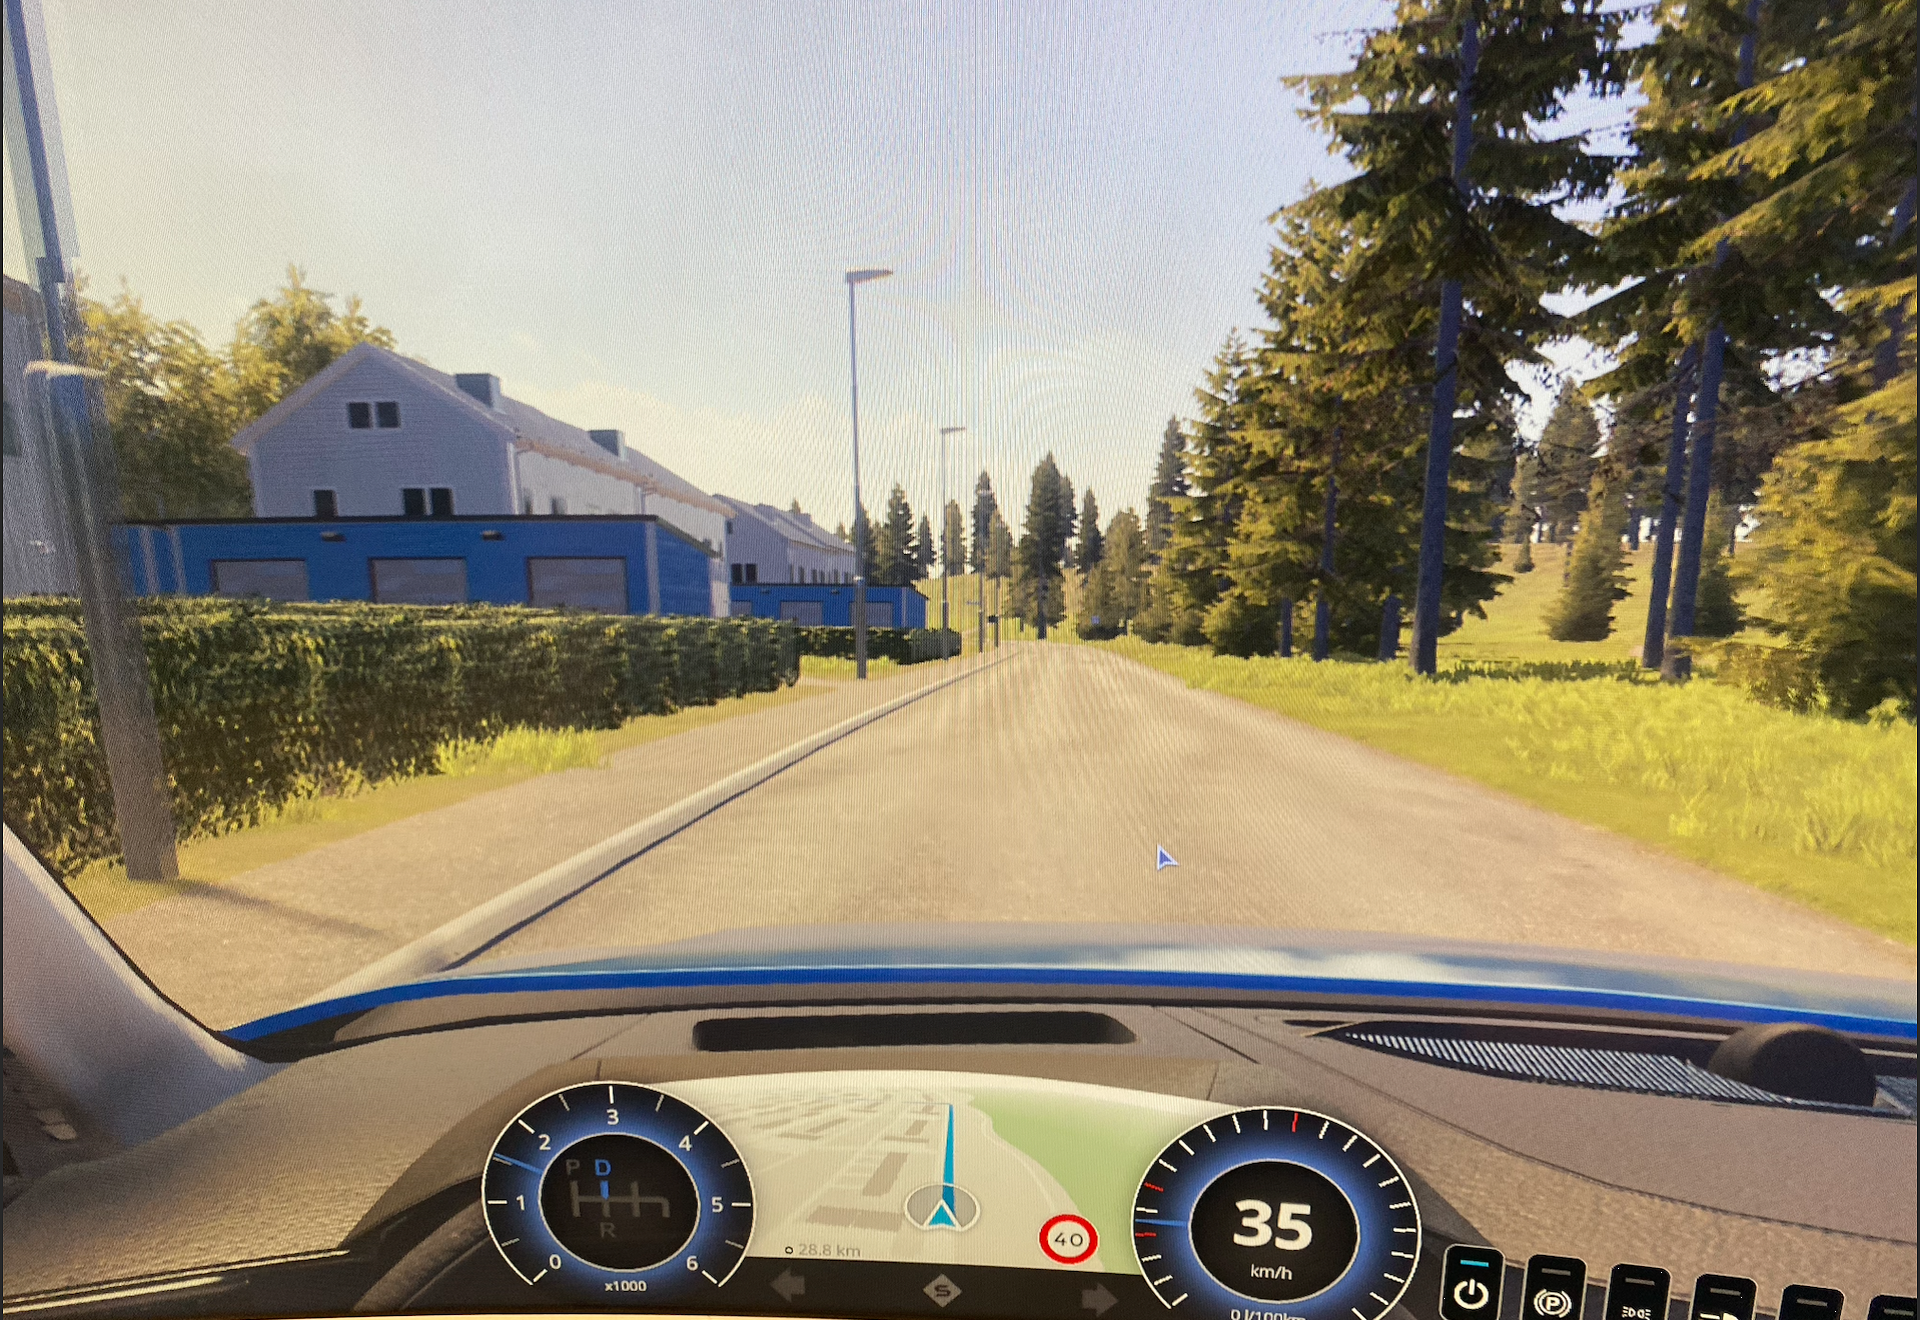
The instructions used for the visual group are shown in Figure 2 and these were presented in the dashboard, see Figure 3. The design of these instructions aimed to ensure that the informational complexity was comparable across modalities. This approach was informed by Dalton et al. (2013), who found that combining auditory instructions with more complex information increases cognitive strain.
2.2.2 Verbal instructions
The verbal instructions were delivered in Swedish using ElevenLabs’ text-to-voice AI with a female voice. The phrases included: “In the next roundabout, take the first/second/third exit,” “Take the first/second/third exit in the roundabout,” “In the next intersection, turn left/right,” and “Turn left/right” immediately before the action was required. To mimic the continuous information flow of a GPS, instructions were repeated shortly before the manoeuvre, compensating for the absence of constant visual cues. As the Swedish Transport Administration specifies only that instructions during the real driving test should be given “well in advance”, the initial prompt was set at approximately 100–150 metres before the manoeuvre. This distance was deemed appropriate by the authors, given the maximum speed limit of 60 km/h in the simulation. Meaning that participants had enough time to process the instructions before having to act on them.
2.3 Scenario
The scenario was designed, scripted, and implemented in collaboration between the first author and Skillster. The Swedish driving examination assesses several core competencies, including speed adjustment, road positioning, attention, and risk assessment (Swedish Transport Administration, 2025). Because the examination takes place under real-world conditions, it is impossible to guarantee which situations candidates will encounter, which highlights the value of the proposed simulator-based screening test (Thorslund et al., 2024).
Nevertheless, the Swedish Transport Administration (2025) specifies a number of traffic situations that are commonly assessed and may arise during the driving test. These served as a guide for the scenario: vulnerable road users, passing stationary vehicles, driving in lanes, lane changing, intersections, driving in urban areas, oncoming traffic, and turning off a main road.
The driving scenario focused on residential urban areas and included a variety of intersections and roundabouts (see example in Figure 3). Of the traffic situations outlined by the Swedish Transport Administration (2025), all were represented in the simulation except for passing stationary vehicles. The intersections varied in terms of right-of-way and give-way rules. The scenario was deterministic: other vehicles, pedestrians, and cyclists appeared in the same locations each time the simulation was run. Weather conditions were set to sunny with dry roads. The posted speed limits ranged from a minimum of 30 km/h to a maximum of 60 km/h.
The scenario was presented as one continuous driving loop rather than a set of separate scenarios. The full route lasted approximately seven minutes and included seven navigation instructions corresponding to each turning manoeuvre (five left turns and two right turns). As participants progressed through the route, they encountered around fifteen meaningful interactions with other road users, including pedestrians along sidewalks, oncoming vehicles during turning manoeuvres, vehicles emerging from side streets, and multiple intersections requiring compliance with right-of-way, give-way, and stop-sign regulations. Several intersections occurred in close succession, and in some cases, vehicles appeared unexpectedly from the right, requiring rapid adjustments in speed, attention, and knowledge of the yield-to-the-right rule. The scenario was identical across both experimental conditions.
2.4 Procedure
Data were collected on two different days, one for each group. The visual group participated first and was divided into three sessions, each with nine participants. Participants in the first group were instructed on the importance of maintaining confidentiality regarding the content of the experiment and were asked not to share details with the other group. Upon arrival, all participants had already received the study information and, after signing a consent form, they completed a brief demographic survey including age and gender. In their regular classes, the students consistently used the same visual navigation aid that was applied in the study; the auditory condition, therefore, required participants to use a new strategy with no preceding adaptation period.
Both groups (auditory and visual) were instructed to drive as they normally would while following the assigned instructions. Before starting the simulation, participants were informed about the modality they would receive to minimise confusion, as they were accustomed only to visual guidance. After completing the drive, both groups filled out a survey assessing subjective cognitive load using the NASA-TLX (Hart & Staveland, 1988). Participants also rated the clarity of the navigation instructions on a 7-point Likert scale (1 = not at all clear; 7 = very clear). In addition, they were asked whether they would change anything about the system in an open-ended response. Lastly, the auditory group was asked to indicate their preferred modality (visual, auditory, or both), whereas the visual group was asked whether they would have preferred a combination of GPS arrows and a guiding voice.
2.5 Analysis
Distance to other vehicles and obstacles, as well as driving speed, were recorded as primary measurement parameters. Additional metrics included acceleration and braking behavior, lane positioning, and adherence to both navigational instructions and traffic laws. These data were automatically collected through the simulation software to evaluate overall driving performance. Breaches were based on these data measures and defined as when a traffic law was broken or when the driving was deemed as reckless. The breaches were used to measure the driving performance in the following categories; collisions, careless driving, speeding, wrong turns, not using blinkers and missing a stop sign. As a real-world driving examination does not allow for any speeding or law violations the breaches were equally harsh in the simulation. NASA-TLX ratings and the other items from the post-drive survey were analysed with t-tests, since Levene’s test confirmed equal variances (F = 0.137, p = .713). Qualitative Content Analysis was used for the question: What would you have liked to change about the GPS system?
3. Results
In this section, the results are presented for each research question.
3.1 Driving performance
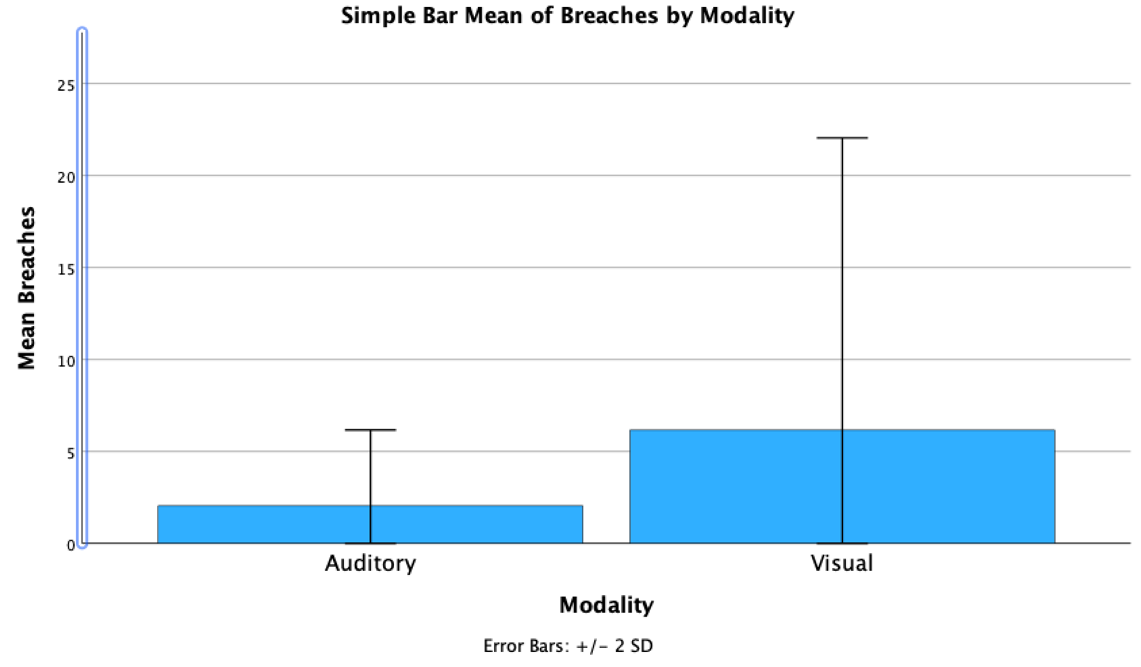
Driving performance differed significantly based on the modality used. A Welch’s t-test was conducted because Levene’s test indicated unequal variances between groups, F(1, 43) = 16.20, p < .001. Participants in the auditory condition committed significantly fewer breaches (M = 2.05, SD = 2.06) than those in the visual condition (M = 6.17, SD = 7.94), t(26.50) = 2.45, p = .021. The mean difference was 4.12 breaches, 95% CI [0.67, 7.57], representing a medium-to-large effect size, Cohen’s d = 0.69. These group means and standard deviations are illustrated in Figure 4.
3.2 Cognitive load
Overall cognitive load, calculated as the average of NASA-TLX subscales, did not differ significantly between modalities. The visual group reported slightly higher cognitive load (M = 3.47, SD = 2.42) than the auditory group (M = 3.03, SD = 2.09), but this difference was not statistically significant, t(47) = –0.69, p = .497. Additionally, when each NASA-TLX category was analysed separately (mental demand, physical demand, temporal demand, performance, effort, and frustration), no significant differences emerged between groups.
3.3 User experience
Analysis of the Likert ratings for perceived clarity revealed no significant difference between the auditory and visual groups. Levene’s test confirmed homogeneity of variance, F(1, 47) = 0.13, p = .719. Although the auditory group reported slightly higher clarity (M = 4.91, SD = 2.27) than the visual group (M = 4.54, SD = 2.14), this difference was not statistically significant, t(47) = 0.59, p = .556. These results indicate that participants perceived the instructions to be of similar clarity regardless of the modality used.
Regarding system preference, most participants in the auditory group preferred using both voice and visual arrows simultaneously (N=10). Many preferred visual arrows only (N=9), and a few preferred voice guidance alone (N=3). Among the 23 participants in the visual group, 10 indicated a preference for combining visual and auditory guidance, whereas 13 did not.
Most participants were satisfied with the GPS system, with many stating that they would not change anything. However, several recurring suggestions emerged, which are presented in Table 1 for each group.
| Theme | Responses visual group N = 23 | Responses Auditory group N = 24 |
|---|---|---|
| No changes/satisfied/unsure | "Nothing", "Don’t know", "Nothing in particular", "No", "Keep it as it is", "I don’t know", "No idea" (n = 15) |
Nothing", "No", "Nothing in particular", "Nothing." (n = 10) |
| Clarity / better visual guidance | "Somehow get a better view of where and when to turn", "Clearer", "Make it a little easier so you don’t miss the turn", "Make it easier to guess and understand the size and length of the map to the next intersection", "Show more" (n = 6) | "That it doesn’t repeat itself twice, just says I should turn once", "Clearer person speaking", "Map, no speaker", "Maybe say where the destination is at the end" (n = 4) |
| Timing / anticipation of turns | "That it suddenly becomes very short before you have to turn" (n = 1) | Say a little earlier", "Earlier", "Slightly earlier instructions at the first intersection", "Say when you should turn a little earlier", "That she says a little earlier when I should turn" (n = 7) |
| Technical issues | "She stopped talking in the middle of everything", "The voice", "Another voice" (n = 3) |
4. Discussion
This study aimed to examine how the modality of driving instructions (auditory vs visual) affects driving performance, cognitive load, and user experience with the following research questions: RQ1: How does the modality of driving instructions impact simulator driving performance? RQ2: How is perceived cognitive load affected by navigational modality? RQ3: How do users experience the two navigation systems? In this section, the results are discussed for each RQ, followed by a discussion of strengths and limitations, and future work.
4.1 Driving performance
The results show that drivers with a high experience of visual navigational aid performed significantly better with auditory instructions, committing fewer breaches. This supports Wickens’ (2002) Multiple Resource Theory, which suggests that because driving is an inherently visual task, adding visual directions overloads the brain's processing capacity. By using sound, the cognitive load is better distributed across different modalities. Interestingly, these participants were already highly familiar with simulators and visual aids through their automotive education. However, even though auditory instructions challenged their "simulator expert" habits, their performance still improved.
A further explanation for the poorer performance in the visual group may relate to familiarity. Research shows that route familiarity can reduce drivers’ attention to safety-relevant elements of the driving scene and increase mind-wandering (Young et al., 2018). A similar mechanism may be present here: because participants were highly accustomed to visual GPS-style aids, the visual interface might have encouraged a habitual, less attentive driving mode. This would explain why the visual group reported high satisfaction yet committed more breaches, since familiarity can make a task feel easy even when attention to the driving environment is reduced.
This suggests that auditory guidance is inherently more effective for driving safety, regardless of a student's previous experience with screens. These findings have direct practical value for the simulator-based screening test (Thorslund et al., 2024). Since young drivers often struggle with risk awareness and overestimating their abilities (Fisher et al., 2006; McKnight & McKnight, 2003), the simulator should not add unnecessary difficulty with additional visual displays. Furthermore, because real Swedish driving examiners give directions aloud, using audio in the simulator also increases the test's ecological validity.
It is important to note that our argument concerns the design of a simulator-based screening test, not driver training. The purpose of the screening test is to assess core driving abilities under conditions that mirror the real licensing exam, where instructions are given verbally. Adding an extra visual display in this context would introduce demands that are not part of the real test and could confound the assessment, even though visual challenges may well be useful in training.
4.2 Cognitive load
Contrary to expectations based on Wickens’ (2002) Multiple Resource Theory, no significant differences were found in reported cognitive load via the NASA-TLX. This result is surprising given that participants in the visual condition committed significantly more driving breaches, which is a classic behavioural indicator of cognitive overload.
One explanation for this discrepancy may lie in the participants' background as automotive students. As noted in the introduction, these learners are highly habitualised to visual navigation aids. This familiarity may have led them to perceive the task as manageable, even though their actual driving performance suffered. Alternatively, the lack of significance may suggest that the NASA-TLX was not sensitive enough to capture the subtle, momentary spikes in cognitive demand that occur during short, standardised simulation runs.
Taken together, these findings reinforce the need to align simulator-based assessments with real exam conditions. If visual navigation continues to dominate simulator training and future examinations, learners may develop strategies that do not transfer effectively to actual driving tests, or worse, everyday driving. By integrating auditory navigation, simulator-based screening could both enhance ecological validity and support safer driving performance in novice drivers, a population at high risk of crashes.
4.3 User experience
Regarding user feedback, most participants were positive and had no suggestions for improvement. However, a "satisfaction paradox" was observed between the two groups. Participants using the visual map were more likely to be satisfied (65%) than those in the auditory group (42%). This suggests that novice drivers may prefer visual aids because they provide constant information, even though the objective data showed this led to more driving breaches.
For those who suggested improvements, the main area identified for enhancement was the need for earlier and clearer verbal instructions. While map users rarely mentioned timing, nearly 30% of the auditory group requested earlier prompts to allow for better mental planning. This highlights a critical practical requirement for the Swedish screening test (Thorslund et al., 2024). For auditory navigation to be both effective and well-received, it must compensate for the lack of a constant visual reference with precise timing. By refining these verbal cues, the safety benefits of auditory guidance can be maintained while increasing user acceptance.
4.4 Strengths and limitations
A key strength of this study is its ecological relevance: the simulated scenarios closely mirrored the conditions of real driving tests, including urban traffic, intersections, and roundabouts. The participants were highly experienced with simulators, reducing the risk of novelty effects and ensuring reliable performance data. The study also employed both objective driving measures and subjective ratings, providing a comprehensive assessment of performance and cognitive load. Finally, by directly comparing auditory and visual navigation, the study addresses a practical gap in driver education research with clear implications for licensing practices.
However, because navigation was tested in a simulator, the realism of the driving task and technical aspects of the setup (e.g., steering wheel, pedals, screen, and software glitches) may have influenced behavior and limited external validity. Data collection was conducted in a shared room, where noise or other distractions could affect concentration, although participants were accustomed to this environment.
The sample consisted of students with relatively advanced simulator and vehicle training compared to peers of the same age, which may restrict generalizability to less experienced drivers. Their habitual reliance on GPS-based visual navigation may also have influenced performance when switching to auditory instructions.
Finally, the measures used present certain limitations. Driving performance was assessed against traffic laws and safety criteria, but subtle differences may not have been captured. Cognitive load was measured post-drive, raising the possibility of hindsight bias, and all self-reports are vulnerable to bias. The idealized simulation conditions (clear weather, dry roads) further reduce generalizability to real-world driving contexts.
Another limitation of the study is the use of a between-subjects design. This choice was deliberate, as a within-subjects design would have caused participants to recognize the route on the second drive, introducing strong familiarity and carryover effects that could mask differences between navigation modalities. However, the trade-off is increased between-participant variability, which may have reduced statistical sensitivity.
4.5 Future work
Future research should replicate these findings with more diverse participant groups, including less experienced drivers and individuals without extensive simulator training, to improve generalizability. Studies could also extend the simulator scenarios to include adverse weather, night driving, and unpredictable traffic situations to better approximate real-world conditions.
In addition, longer driving sessions may reveal more subtle differences in cognitive load that were not detected in this short simulation. Exploring variations in auditory instruction design, such as voice type, timing, or complexity, could further clarify how best to integrate auditory navigation into driver examination. Finally, longitudinal studies could investigate whether simulator-based auditory instructions transfers effectively to real-world performance and improves outcomes in formal driving examinations.
5. Conclusion
The aim of this study was to investigate how navigation modality—visual or auditory—affects novice drivers’ performance and perceived cognitive load in a simulated environment. The results show that auditory instructions lead to significantly fewer driving breaches compared to visual instructions, confirming the hypothesis that visual navigation can overload the already visually demanding driving task. Contrary to expectations, self-reported cognitive workload did not differ significantly between groups, suggesting either a habituation effect among these "simulator-expert" students or limitations in the sensitivity of the NASA-TLX for short simulation runs.
Regarding user experience, most participants were positive, though a "satisfaction paradox" was observed; map-based users reported higher satisfaction despite their lower driving performance. For those who suggested enhancements, the main area identified was the need for earlier and clearer verbal instructions. These findings indicate that instructional modality plays a meaningful role in novice drivers’ performance, with auditory navigation offering a clear safety advantage. This suggests that auditory instructions are more suitable for simulator-based screening. By refining the timing of these verbal cues to ensure they are delivered early enough for planning, the system can maintain its significant safety benefits while increasing user acceptance and better preparing learners for real-world traffic conditions.
Acknowledgement
The authors would like to thank the software developer Skillster for their valuable contribution by developing the driving simulator scenario and contacting the automotive high school. We also extend our sincere gratitude to the teachers and students at Vreta automotive high school. Their active participation in the study wase essential in ensuring a smooth and efficient data collection process.
Competing interests
The authors report no competing interests.
CRediT contribution
Marius Brudvik Norell: Conceptualization, Data curation, Formal analysis, Methodology, Writing—original draft, Writing—review & editing. Birgitta Thorslund: Funding acquisition, Project administration, Supervision, Writing—review & editing.
Data availability
The data are available on request to the authors.
Ethics
No additional background information about participants was collected, and participation was not considered ethically sensitive as these students were already familiar with simulator exercises as part of their regular training. Furthermore, similar studies and previous data collections of this type have not required ethical approval. See decision from the Swedish ethical authorities.
DECISION: The Swedish Ethical Review Authority dismisses the application, meaning that the application will not be taken up for review.
REASON FOR THE DECISION: In the project in question, no procedure will be performed on a research participant, nor any other intervention as specified in Section 4 of the Ethical Review Act. No processing of personal data will take place in the manner described in Section 3 of the Ethical Review Act. On this basis, the study is not covered by the provisions in Sections 3–4 of the Ethical Review Act and therefore does not require ethical review (Case No. 2020–06934).
Funding
This work was funded by a Swedish Transport Administration (TRV) grant (2022/31998) for the project Simulators for Driver Education and Assessment.
Generative AI use in writing
The authors declare that no generative AI was used in this work.
Prior dissemination
An earlier version of this work was presented at the 37th ICTCT conference, held in Berlin, Germany, on 23–24 October 2025.
Editorial information
Handling editor: Aliaksei Laureshyn, Lund University, Sweden.
Reviewers: Ruben Kuipers, Dresden University of Technology, Germany | Lund University, Sweden; Katerina Deliali, CINEA, Belgium.
Submitted: 6 January 2026; Accepted: 11 March 2026; Published: 20 March 2026.