Personality traits as predictors of driver behaviour: a comprehensive profiling study of Portuguese drivers
Abstract
Human factors play a substantial role in road crashes, yet understanding their contribution remains complex. Risky driving behaviours result from the interplay of multiple internal and external determinants, among which personality stands out as a relatively stable individual disposition that influences driving behaviour across different contexts. Therefore, studies examining the relationship between personality traits and driving behaviour are essential. This study aimed to construct driver behaviour profiles based on these relationships within a large sample of Portuguese drivers. A community sample of 747 licensed drivers, aged under 75 and with at least three years of driving experience, completed an online survey. Instruments included the NEO-Five Factor Inventory-20, the Impulsivity and Sensation Seeking Scale, and the 24-item Driver Behaviour Questionnaire (DBQ). Firstly, multiple linear regressions were conducted considering the three driving behaviour dimensions of the DBQ to support the construction of the profiles. Results indicated that neuroticism, agreeableness, extraversion, impulsivity, and sensation seeking predicted infractions and aggressive driving. Neuroticism, conscientiousness, and impulsivity predicted non-intentional errors, while neuroticism, openness, conscientiousness, and impulsivity were associated with lapses. Even after controlling for age and gender, personality traits remained significant predictors. Secondly, four driver behaviour profiles were constructed using two alternative methodologies: an empirical approach and cluster analysis with k-means. Profiles built using the empirical approach resulted in four groups of drivers characterised by more easily identifiable driving behaviours: prudent, regular, distracted/forgetful, and aggressive drivers. The distracted/forgetful group showed a positive relationship to crash involvement. Overall, the study shows that the complex driver behaviour needs to be carefully grouped.
1. Introduction
Road crashes remain a leading global cause of morbidity, mortality, and economic burden, representing between 1–3% of the world’s GDP (World Health Organization, 2023). In Portugal, 642 fatalities were recorded in 2023 (ANSR, 2024), a number that has remained relatively stable over the past decade, except for the temporary reduction during the COVID-19 pandemic. Despite technological advances and regulatory measures, human factors remain a significant contributor to road accidents (European Commission, 2024).
Driving is a complex activity influenced by individual characteristics, cognitive processes, and contextual factors (Hennessy, 2011; Oppenheim & Shinar, 2011). Consequently, understanding driver behaviour has become central to improving road safety.
Research has classified driver errors and violations using structured taxonomies. Reason (1990, cited in Weller et al., 2006) proposed the Generic Error-Modelling System, distinguishing between pre- and post-detection processes and developing a cognitive framework of unsafe acts, which is divided into errors and violations. Skill-based errors include slips and lapses (attention or memory failures), while rule- and knowledge-based errors involve inappropriate actions or misapplied strategies. Violations are intentional deviations from safe driving norms (Oppenheim & Shinar, 2011). These constructs differ in cognitive mechanisms and corrective strategies (Parker et al., 1995).
Other taxonomies, such as those by Treat et al. (1979), further developed by Wierwille et al. (2002), identified recognition, decision, and performance errors. More recently, Khattak et al. (2021) introduced a spatio-temporal model comprising perception, recognition, decision, and reaction, based on naturalistic driving data. Recognition errors accounted for 39% of crash causes, followed by decision (34%), performance (8%), and violations (9%).
Personality traits have long been recognised as fundamental determinants of risky driving (Ulleberg, 2002; Vaa, 2014). Impulsivity and risky driving behaviours association has been shown in various works (Bıçaksız, P. and Özkan, 2016; Deffenbacher, 2000). Sensation-seeking has also been associated with aggressive driving and infractions, like excessive speed, aggressive behaviour with other drivers, and driving under the effect of alcohol (Yang et al., 2013; Mallia et al., 2015). Jovanovic et al. (2011) found that neuroticism, agreeableness, and conscientiousness can predict driving anger and aggression. Tao et al. (2017) also found neuroticism and extraversion to be positively correlated with driving errors and violations that can lead to dangerous outcomes. On the other hand, Correia (2014), only found significant correlations of neuroticism with lapses.
A recent meta-analysis of 34 studies conducted by Luo et al. (2023) concluded that conscientiousness, agreeableness, and openness to experience were negatively associated with risky and aggressive driving behaviours. Conversely, neuroticism was positively associated with risky and aggressive behaviours. Extraversion was not significantly associated with either behaviour, a result also found in another meta-analysis by Akbari et al. (2019). However, in the latter, the authors also concluded that conscientiousness and openness to experience were not significantly related to risky driving behaviours.
Sociodemographic factors also influence driving. In some studies, younger and male drivers showed greater tendency to get angry with other drivers and to commit infractions (Aluja et al., 2023; Cordazzo et al., 2014; Lawton et al., 1997). Other authors found that women more frequently committed distraction-related errors with minor safety consequences (de Winter & Doudu, 2010; Parker et al., 1995). A cross-cultural study on 32 countries by Granié et al. (2020) concluded that socially constructed gender roles shape drivers’ self-positioning more than perceived social norms and exert less influence on behaviours when risk-taking is widely normalised. Age effects are mixed: Aberg and Rimmo, 2010 linked older age to inattention errors, Cordazzo et al. (2014) found a negative correlation with lapses, and Parker et al. (1995) found none.
Profiling driver behaviour, by identifying consistent patterns of actions, personality traits, and situational responses that influence driving performance, can provide valuable insights for safety research. Incorporating driver behaviour profiles into the fine-tuning and calibration of safety simulation models enhances their capacity to replicate safety-critical events by accounting for the variability in human driving behaviour. This approach enables a more accurate and realistic representation of real-world traffic dynamics and driver–vehicle interactions.
Despite extensive research, there is no consensus regarding which variables or analytical methods best describe and predict driver behaviour profiles (Payyanadan & Angell, 2022). Existing profiling approaches differ widely in their theoretical bases, personality measures, and statistical techniques (Liao et al., 2022; Tselentis & Papadimitriou, 2023). Moreover, studies addressing Portuguese drivers remain scarce, leaving a gap in understanding the particularities of their behaviours, which may differ from other populations.
This study seeks to address these limitations by developing empirically grounded driver behaviour profiles based on the integration of Big Five personality traits, impulsivity, and sensation seeking within a large Portuguese sample. Distinctively, it compares an empirical profiling methodology with the commonly used k-means clustering approach, assessing which produces more interpretable and representative behavioural patterns. By capturing the variability in driver personality and behaviour, this work provides an original and significant contribution to road safety research—supporting more accurate modelling of human factors in simulation, risk prediction, and behavioural intervention strategies.
2. Methods
2.1 Procedure and sample characterization
A Portuguese community sample was recruited and invited to participate in an online survey on the relationship between personality and driver behaviour. Inclusion criteria included holding a driving licence, driving regularly for at least three years, and being under 75 years of age (older drivers have been associated with increased prevalence of cognitive, sensory and motor decline, which may affect driving performance and be linked to a higher risk of road traffic accidents (Zhang et al., 2024; SafetyNet, 2009)). In Portugal, the minimum legal driving age is 18 years. Data were collected over a four-month period in 2016, aiming to achieve a balanced distribution across age groups and gender.
All participants completed self-report questionnaires that included socio-demographic information, personal accident history, and validated instruments assessing personality traits and driving behaviour. Responses were anonymous. Prior to participation, individuals were informed about the research objectives and eligibility criteria.
| n (M ± SD) | |
|---|---|
| Age | 747 (42.13 ± 12.35) |
| Driving licence tenure | 747 (21.30 ± 11.34) |
| Years of regular driving experience | 747 (20.33 ± 11.33) |
| Gender | 417 women- 55.8% |
The final sample comprised 747 participants: 417 women (55.8%), with a mean age of 42.13 ± 12.35 years, a mean driving licence tenure of 21.30 ± 11.34 years, and a mean of 20.33 ± 11.33 years of regular driving experience (Table 1). Education level was classified on a seven-point scale, from primary education (1) to doctoral degree (7). Although all levels were represented, most participants held graduate (36.8%) or master’s (30.0%) degrees.
This educational distribution is not representative of the Portuguese population. In 2016, only 23.8% of adults held a higher education degree, and this proportion had increased to merely 31.4% by 2024 (INE, 2025). The over-representation of highly educated participants may be attributed to the online survey format, which tends to attract individuals with greater digital literacy, typically associated with higher educational attainment.
2.2 Instruments
2.2.1 NEO-Five Factor Inventory-20
The Portuguese version of the NEO-Five Factor Inventory-20 (Bertoquini & Pais-Ribeiro, 2006) was used to assess the Big Five personality traits: Neuroticism, Extraversion, Openness to Experience, Agreeableness, and Conscientiousness. The instrument comprises 20 items rated on a 5-point Likert scale (1 = strongly disagree to 5 = strongly agree). Psychometric evaluation of the Portuguese version involved Exploratory and Confirmatory Factor Analyses (EFA, CFA) and Reliability Analysis (Dourado et al., 2017a; Dourado et al., 2017b). Two items were removed, resulting in a five-factor structure consistent with the original model and good internal consistency (Cronbach’s α = 0.68–0.74).
2.2.2 Impulsive Sensation Seeking Scale
Impulsivity and Sensation Seeking were measured using the Portuguese adaptation of Zuckerman’s (1994) Impulsive Sensation Seeking Scale, translated and validated by the research team (Dourado et al., 2017a; Dourado et al., 2017c). The scale consists of 19 binary (“True”/“False”) items and yielded a two-factor model: Impulsivity and Sensation Seeking, after excluding four items. Each factor demonstrated good reliability (α = 0.79 and 0.76), and the total scale showed strong internal consistency (α = 0.82). Sensation Seeking reflects the pursuit of novel and intense experiences despite associated risks, while Impulsivity denotes spontaneous, unreflective action.
2.2.3 Driver Behaviour Questionnaire
Driving behaviour was assessed using the Portuguese short version of the Manchester Driver Behaviour Questionnaire (Correia, 2014; Reimer et al., 2005; Reason et al., 1990), comprising 24 items rated from 0 (never) to 5 (always). Psychometric analysis produced a three-factor model with 22 items—Infractions and Aggressive Driving (IAD, α = 0.77), Non-intentional Errors (NIE, α = 0.73), and Lapses (α = 0.71)—with an overall internal consistency of α = 0.84 (Dourado et al., 2017a; Dourado et al., 2017d). IAD represents deliberate rule violations, NIE refers to unintentional errors with potential risk, and Lapses indicate minor attentional failures with limited safety impact.
2.3 Data analysis methods
2.3.1 Hierarchical multiple linear regressions – methods and statistical analysis
In a previous analysis, the Pearson correlation coefficient had already been computed to explore associations between personality traits, socio-demographic variables, and driver behaviour dimensions (correlation results published in Dourado et al., 2017a can be seen in Appendix A).
Subsequently, multiple linear regressions were performed to analyse how much variance in the DBQ dimensions (dependent variables) could be explained or predicted by the variables that had previously shown significant correlations, and to evaluate the relative contribution of each independent variable. Preliminary analyses were conducted to ensure that the assumptions of normality, linearity, independence, homoscedasticity, and multicollinearity were not violated. SPSS version 23.0 was used for the analysis.
The variability in the DBQ dimensions explained by correlated personality traits, while controlling for socio-demographic variables, was assessed using hierarchical multiple linear regressions.
2.3.2 Building driver behaviour profiles- methods and statistical analysis
Two alternative methodologies were used to build driver behaviour profiles: an empirical construction and a cluster analysis with the k-means method.
2.3.3 Empirical method
Reason’s (1990) classification of unsafe acts, further developed by Oppenheim and Shinar, 2011, was used as a basis to define four behavioural profiles: aggressive (frequent intentional violations), distracted/forgetful (lapses and non-intentional errors), prudent (rare errors, lapses or violations), and regular (moderate behaviour). Personality traits were scored by quartiles (low, medium, high) and used to allocate individuals to profiles, based on the associations obtained in the hierarchical multiple linear regression analysis. Controlling for the personality trait scores to capture targeted driving behaviour, drivers were manually assigned to each group, through iterative adjustments.
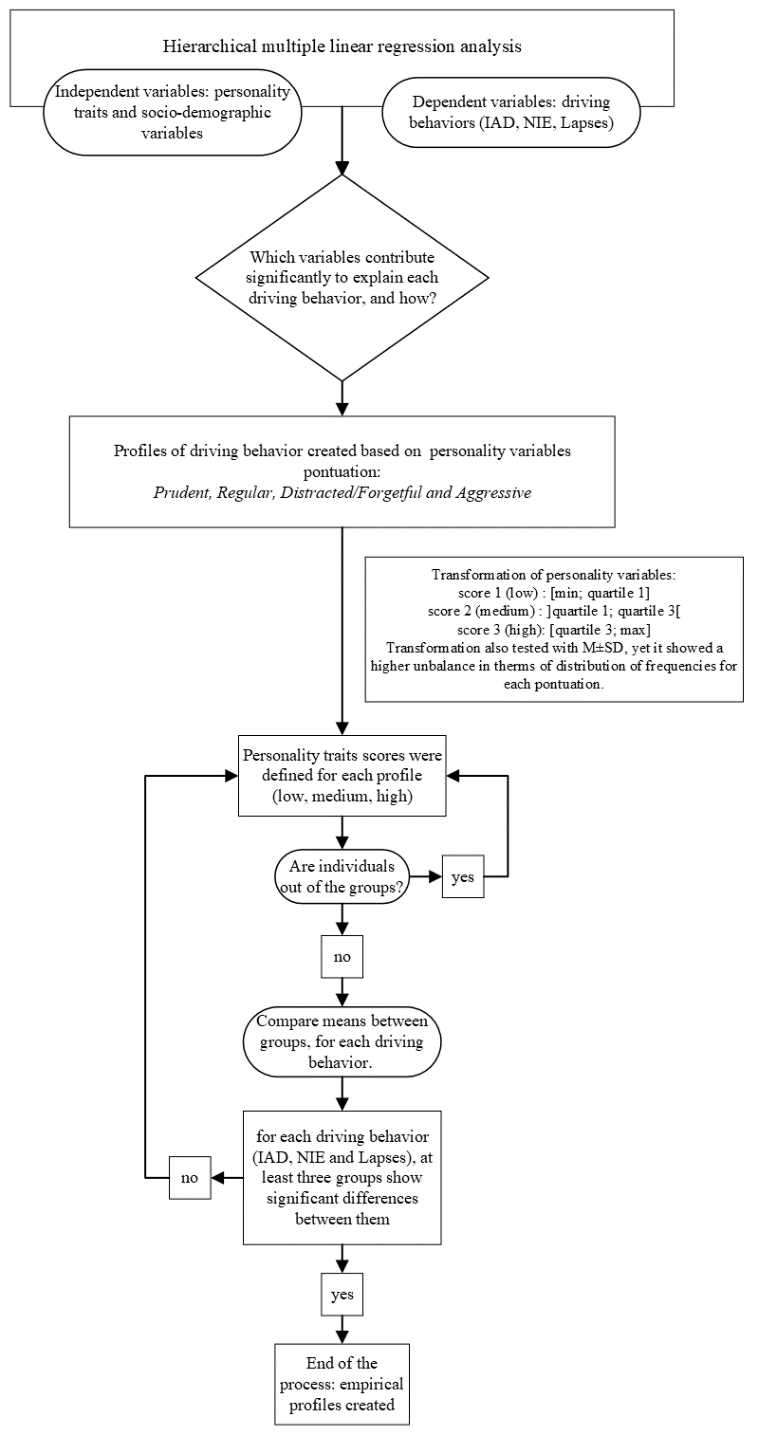
Group comparisons were conducted using ANOVA (Bonferroni or Tamhane post hoc tests) for normally distributed data, and the Kruskal-Wallis test with Mann-Whitney U tests otherwise. The process concluded when at least three groups demonstrated statistically significant behavioural differences. Figure 1 shows the flowchart of this methodology.
2.3.4 Cluster technique with k-means
Three clustering hypotheses were tested: (1) all personality variables; (2) only those with β > 0.1 in the regression analyses (Neuroticism, Agreeableness, Conscientiousness, Impulsivity, Sensation Seeking); and (3) the set used in the empirical profiles (Neuroticism, Agreeableness, Conscientiousness, Extraversion, Impulsivity, Sensation Seeking). For each hypothesis, hierarchical clustering was performed using Ward’s method (Ulleberg, 2002) and the squared Euclidean distance, determining the optimal number of clusters through dendrogram and R² analysis (Marôco, 2014).
The standardised variables were subsequently analysed using k-means clustering (Ulleberg, 2002). Group differences in IAD, NIE, and Lapses were compared after testing for normality and homogeneity of variance. The selected hypothesis was the one that maximised significant intergroup differences.
2.3.5 Validation of the profiles using crash involvement
Considering the profiles obtained by each method, a linear regression model was applied to the number of at-fault crashes per year of driving licence. The objective was to validate the profiles defined by both methods, assuming that each profile may be associated with crash involvement. The linear regression model for the number of crashes per year can be written as follows:
\begin{equation} Y_{ij} = \beta_0 + \beta_j X_{ij} + \gamma_{Age} AGE_i + \gamma_{Gender} GENDER_i\tag{1} \end{equation}Where i denotes individuals (i = 1,…,747), and j denotes the groups for each profile. Yᵢj represents the number of at-fault crashes per year of driving licence, and Xᵢj is a dummy variable for each profile. For convenience, the profile classified as regular was included as the reference category. βj is the estimated parameter for each j–1 profile.
Age and gender were included as control variables, with γAge and γGender representing the respective estimated parameters. The model parameters were estimated using NLOGIT 5.
3. Results
3.1 Descriptive analysis
The mean scores (and standard deviations) of the dimensions of the NEO-FFI-20, ImpSS, and DBQ are presented in Table 2. These dimensions correspond to the personality trait variables entered the regression models. The mean and standard deviation of the number of at-fault crashes per year of driving licence are also included in Table 2.
| NEO-FFI-20 | n (M ± SD) | Scale range |
|---|---|---|
| Neuroticism | 747 (7.02 ± 2.29) | 0 - 12 |
| Openness to experience | 747 (14.32 ± 3.22) | 0 - 16 |
| Conscientiousness | 747 (15.97 ± 2.01) | 0 - 16 |
| Agreeableness | 747 (11.01 ± 2.09) | 0 - 12 |
| Extraversion | 747 (13.98 ± 2.28) | 0 - 16 |
| ImpSS | ||
| Impulsivity | 747 (1.31 ± 1.56) | 0 - 5 |
| Sensation seeking | 747 (4.21 ± 2.80) | 0 - 10 |
| DBQ | ||
| Infractions and aggressive driving | 747 (8.68 ± 5.16) | 0 - 35 |
| Non-intentional errors | 747 (5.82 ± 3.80) | 0 - 45 |
| Lapses | 747 (8.58 ± 4.11) | 0 - 30 |
| Number of crashes at fault per year of driving licence | 747 (0.049± 0.081) |
3.2 Hierarchical multiple linear regression analysis
The hierarchical multiple linear regression was applied to three distinct models, considering as dependent variables the three driving behaviour dimensions of the DBQ: IAD, NIE, and Lapses. The aim was to identify the variables influencing each of the three driving behaviours, with particular focus on the NEO-FFI and ImpSS variables.
3.2.1 Infractions and aggressive driving regression
An initial regression model including Age, Gender, Education, Years of driving licence, Years of frequent driving, and personality traits (Neuroticism, Agreeableness, Extraversion, Impulsivity, and Sensation Seeking) explained 28.3% of the variance in Infractions and Aggressive Driving (IAD) [F(10.736)=30.462, p<.001]. Multicollinearity (VIF>5) was detected among Age, Years of licence, and Years of frequent driving; the latter was non-significant (p=0.924). A refined model (Table 3) excluding multicollinear variables explained 27.2% of the variance [F(8,738)=35.821, p<.001, Durbin–Watson=1.976], with all predictors significant: Age (β=-0.205), Gender (β=0.270), Education (β=-0.193), Neuroticism (β=0.085), Agreeableness (β=-0.106), Extraversion (β=0.096), Impulsivity (β=0.209), and Sensation Seeking (β=0.136). No multicollinearity remained (VIF<5).
Impulsivity exhibited the highest partial correlation (0.216), followed by Sensation Seeking (0.137). After controlling for socio-demographic variables (R²adj=0.154), personality traits still accounted for an additional 12.2% of the variance in IAD [R²change=0.122, F change(5.738)=25.085, p<.001], highlighting their independent predictive power.
| IAD model | Unstandardized coefficients | Standardized coefficients | T | Correlations | Collinearity statistics | ||||
|---|---|---|---|---|---|---|---|---|---|
| B | Std. error | β | Zero order | Partial | Part | Tolerance | VIF | ||
| Constant | 0.049 | 2.038 | 0.024 | ||||||
| Age | -0.086 | 0.014 | -0.205*** | -6.240 | -0.239 | -0.224 | -0.195 | 0.905 | 1.104 |
| Gender* | 2.809 | 0.335 | 0.270*** | 8.385 | 0.254 | 0.295 | 0.262 | 0.938 | 1.066 |
| Education | 0.906 | 0.152 | 0.193*** | 5.945 | 0.160 | 0.214 | 0.186 | 0.930 | 1.075 |
| Neuroticism | 0.191 | 0.079 | 0.085** | 2.425 | 0.092 | 0.089 | 0.076 | 0.802 | 1.248 |
| Agreeableness | -0.263 | 0.080 | -0.106*** | -3.287 | -0.142 | -0.120 | -0.103 | 0.932 | 1.073 |
| Extraversion | 0.217 | 0.080 | 0.096*** | 2.701 | 0.138 | 0.099 | 0.084 | 0.775 | 1.290 |
| Impulsivity | 0.690 | 0.115 | 0.209*** | 6.001 | 0.259 | 0.216 | 0.187 | 0.805 | 1.242 |
| Sensation seeking | 0.251 | 0.067 | 0.136*** | 3.760 | 0.301 | 0.137 | 0.117 | 0.744 | 1.343 |
3.2.2 Non-intentional errors regression
In the initial Non-intentional Errors (NIE) regression model (Table 4), Education, Neuroticism, Conscientiousness, Impulsivity, and Sensation Seeking explained 10.3% of the variance [F(5,741)=18.102, p<.001]. All predictors were significant (p<.001) except Sensation Seeking (β=0.058, p=0.126). No multicollinearity was identified (all VIF<5). A refined model excluding the non-significant variable explained 10.1% of the variance [F(4,742)=22.000, p<.001, Durbin–Watson=2.152], with all predictors significant: Education (β=0.148), Neuroticism (β=0.127), Conscientiousness (β=-0.137), and Impulsivity (β=0.190).
| NIE model | Unstandardized coefficients | Standardized coefficients | T | Correlations | Collinearity statistics | ||||
|---|---|---|---|---|---|---|---|---|---|
| B | Std. error | β | Zero order | Partial | Part | Tolerance | VIF | ||
| Constant | 5.199 | 1.412 | 3.681 | ||||||
| Education | 0.511 | 0.121 | 0.148*** | 4.211 | 0.110 | 0.153 | 0.146 | 0.982 | 1.019 |
| Neuroticism | 0.210 | 0.060 | 0.127*** | 3.500 | 0.188 | 0.127 | 0.122 | 0.916 | 1.091 |
| Conscientiousness | -0.259 | 0.069 | -0.137*** | -3.776 | -0.188 | -0.137 | -0.131 | 0.914 | 1.094 |
| Impulsivity | 0.461 | 0.086 | 0.190*** | 5.332 | 0.212 | 0.192 | 0.185 | 0.951 | 1.051 |
Impulsivity exhibited the strongest partial correlation with NIE (0.192), followed by Education (0.153), Conscientiousness (-0.137), and Neuroticism (0.122). After controlling for socio-demographic variables [Step 1: R²adj=0.011, F(1,745)=11.225, p=0.003], personality traits accounted for an additional 9.4% of explained variance [R²change=0.094, F change(3,742)=26.005, p<.001]. These findings highlight impulsivity and low conscientiousness as key predictors of unintentional driving errors, consistent with prior behavioural research.
3.2.3 Lapses regression
For the Lapses dimension (Table 5), Age, Gender, Education, Neuroticism, Conscientiousness, Openness to Experience, and Impulsivity explained 13.3% of the variance [F(7,739)=17.329, p<.001, Durbin–Watson=2.160]. Years of driving licence, Years of frequent driving, and Sensation Seeking were excluded due to non-significance and multicollinearity (VIF>5). All retained predictors were significant: Age (β=-0.075, p=0.036), Gender (β=-0.102, p=0.003), Education (β=0.165, p<.001), Neuroticism (β=0.094, p=0.009), Conscientiousness (β=-0.121, p=0.001), Openness (β=0.085, p=0.017), and Impulsivity (β=0.215, p<.001).
| Lapses model | Unstandardized coefficients | Standardized coefficients | T | Correlations | Collinearity statistics | ||||
|---|---|---|---|---|---|---|---|---|---|
| B | Std. error | β | Zero order | Partial | Part | Tolerance | VIF | ||
| Constant | 8.108 | 1.792 | 4.524 | ||||||
| Age | -0.025 | 0.012 | -0.075** | -2.101 | -0.092 | -0.077 | -0.072 | 0.904 | 1.106 |
| Gender | -0.846 | 0.286 | -0.102*** | -2.953 | -0.133 | -0.108 | -0.101 | 0.971 | 1.030 |
| Education | 0.618 | 0.135 | 0.165*** | 4.578 | 0.168 | 0.166 | 0.156 | 0.896 | 1.117 |
| Neuroticism | 0.168 | 0.064 | 0.094*** | 2.617 | 0.166 | 0.096 | 0.089 | 0.906 | 1.104 |
| Openness to experience | 0.108 | 0.045 | 0.085** | 2.400 | 0.113 | 0.088 | 0.082 | 0.932 | 1.073 |
| Conscientiousness | -0.248 | 0.073 | -0.121*** | -3.386 | -0.157 | -0.124 | -0.115 | 0.908 | 1.101 |
| Impulsivity | 0.565 | 0.092 | 0.215*** | -6.131 | 0.227 | 0.220 | 0.209 | 0.947 | 1.056 |
Impulsivity exhibited the strongest partial correlation (0.220), followed by Conscientiousness (-0.124), Neuroticism (0.096), and Openness (0.088). Among socio-demographic variables, Education showed the strongest correlation (0.166). After controlling for Age, Gender, and Education [Step 1: R²adj=0.039, F(3,743)=11.225, p<.001], personality traits explained an additional 9.8% of variance [ΔR²=0.098, F change(4,739)=21.001, p<.001], confirming their significant independent contribution to lapses in driving behaviour.
3.3 Empirical driver behaviour profiles
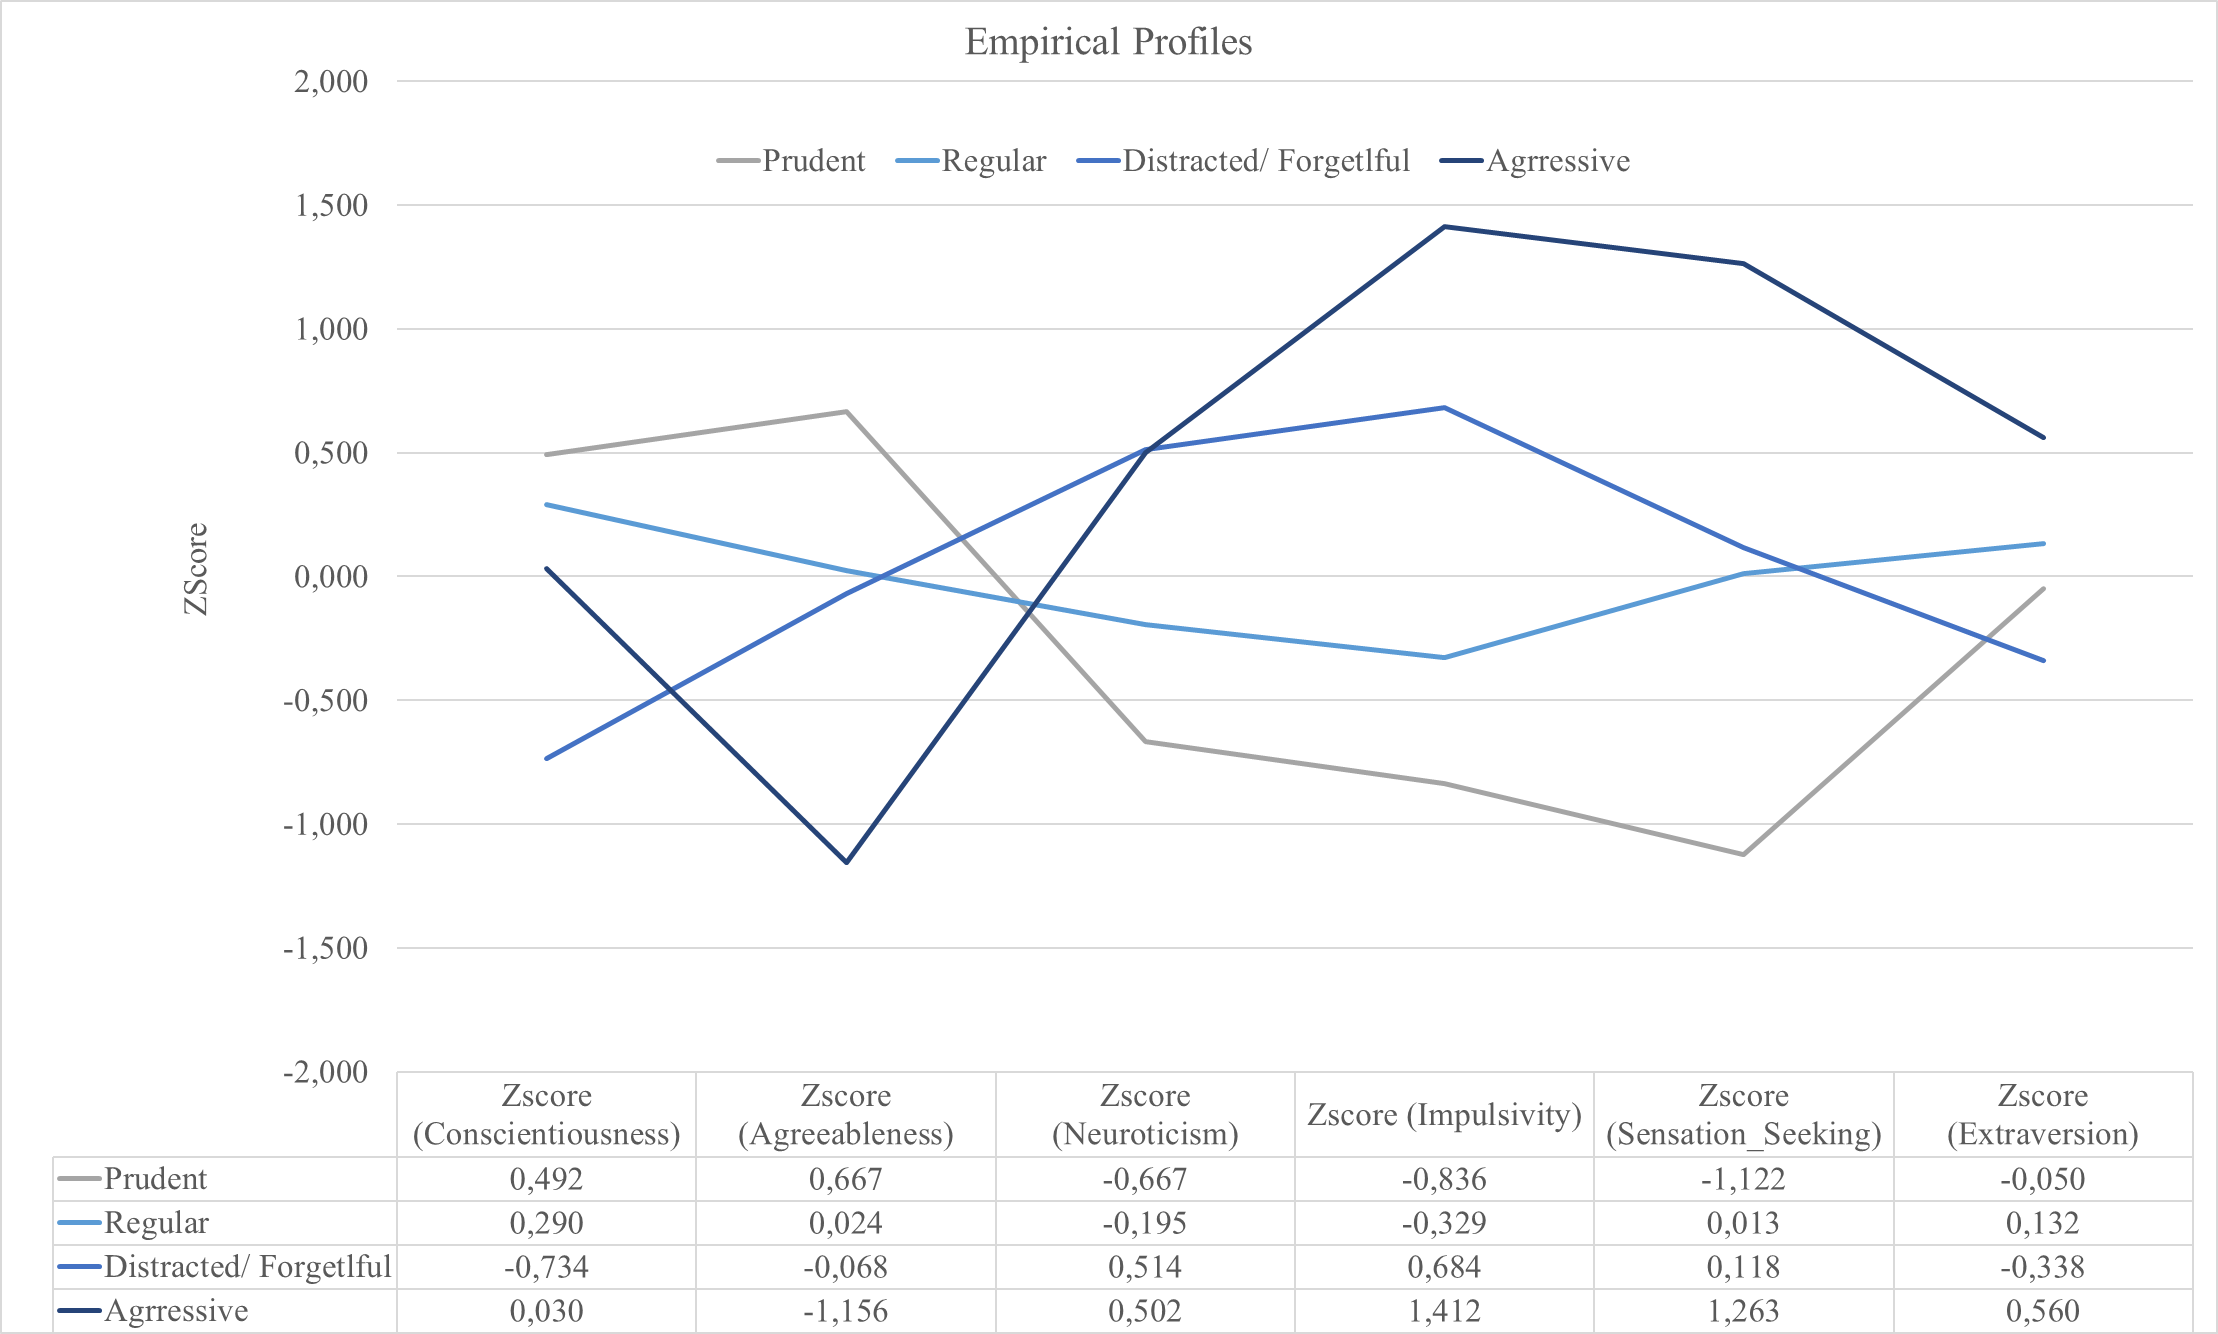
Four empirical driver profiles were identified (Tables 6 and 7; Figures 2 and 3): Prudent — low Impulsivity and Sensation Seeking, average/high Conscientiousness and Agreeableness (n=67); Regular - moderate across traits (n=429); Distracted/Forgetful - low/average Conscientiousness, high/average Neuroticism and Impulsivity (n=216); and Aggressive - low Agreeableness, high Impulsivity and Sensation Seeking (n=35).
| Prudent | Regular | Distracted/forgetful | Aggressive | |
|---|---|---|---|---|
| Neuroticism | low/average | average/high | average/high | |
| Impulsivity | Low | average/high | high | |
| Sensation seeking | Low | high | ||
| Extraversion | average/high | |||
| Openness to experience | ||||
| Conscientiousness | average/high | low/average | ||
| Agreeableness | average/high | low |
| Prudent | Regular | Distracted/forgetful | Aggressive | |
|---|---|---|---|---|
| Age | 44,19 ± 12,34 | 41,51 ± 12,32 | 43,24 ± 12,49 | 38,97 ± 10,99 |
| Gender | 62.7% F; 37.3% M | 56.4% F; 43.6% M | 54.6% F; 45.4% M | 42.9% F; 57.1% M |
| Number of individuals in the group | 67 (9% of total sample) | 429 (57% of total sample) | 216 (29% of total sample) | 35 (5% of total sample) |
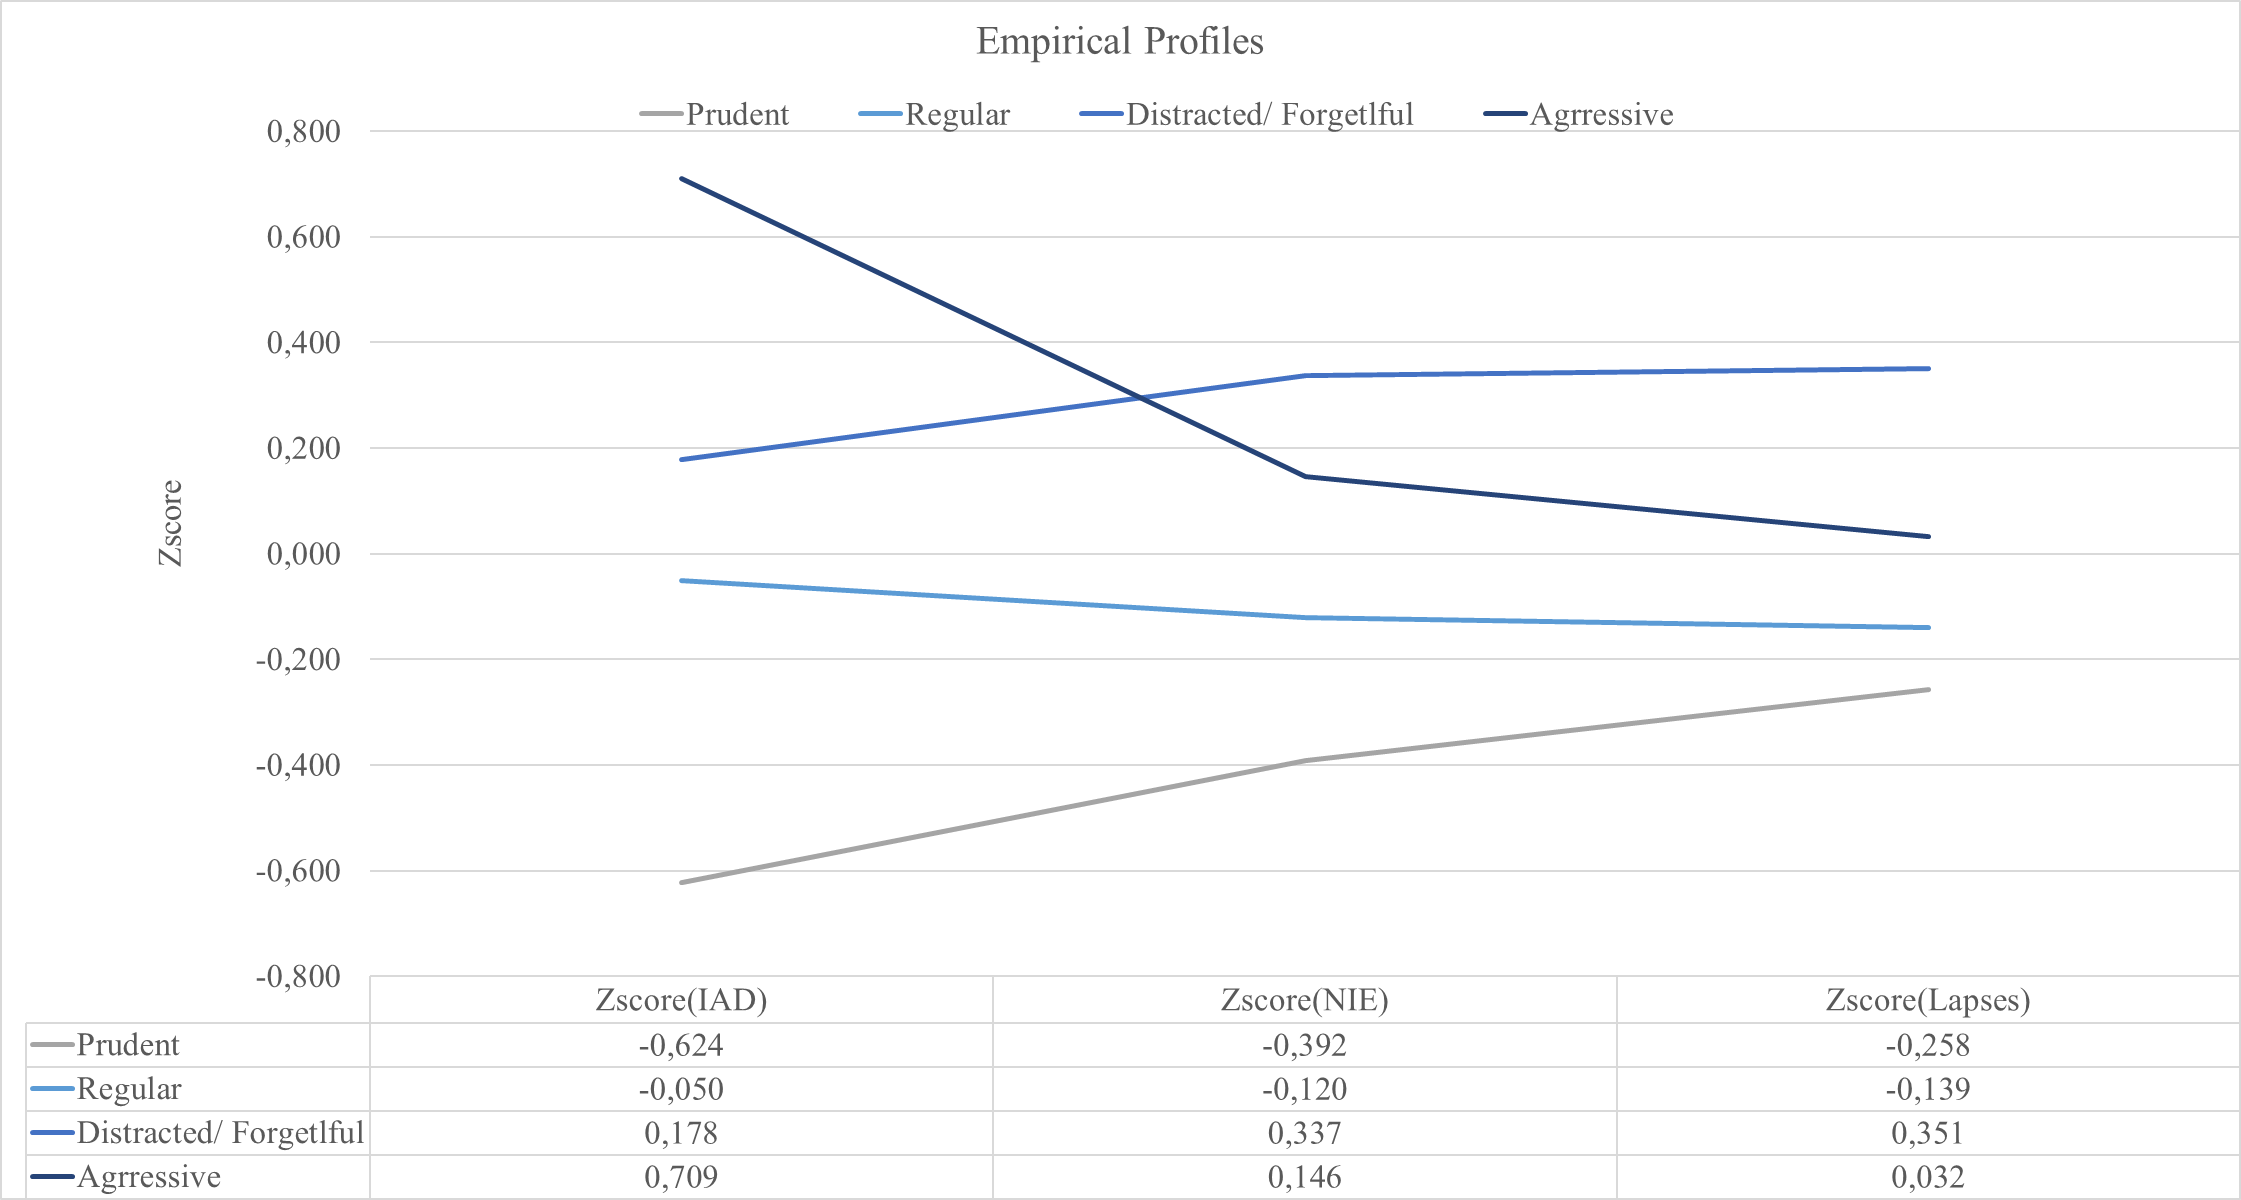
In driving behaviour, the Prudent group exhibited the lowest IAD, NIE, and Lapse scores, while the Aggressive group showed the highest IAD, and the Distracted/Forgetful group showed higher NIE and Lapses. The Kruskal-Wallis test revealed significant group differences, confirmed by Mann–Whitney U tests: Prudent drivers differed significantly from Distracted/Forgetful and Aggressive drivers in all behaviours. The Prudent and Regular groups exhibited significant differences in IAD and NIE behaviours. The Regular and the Distracted/Forgetful presented significant differences in all behaviours. While Distracted/Forgetful and Aggressive groups did not differ significantly.
3.4 K-means driver behaviour clusters
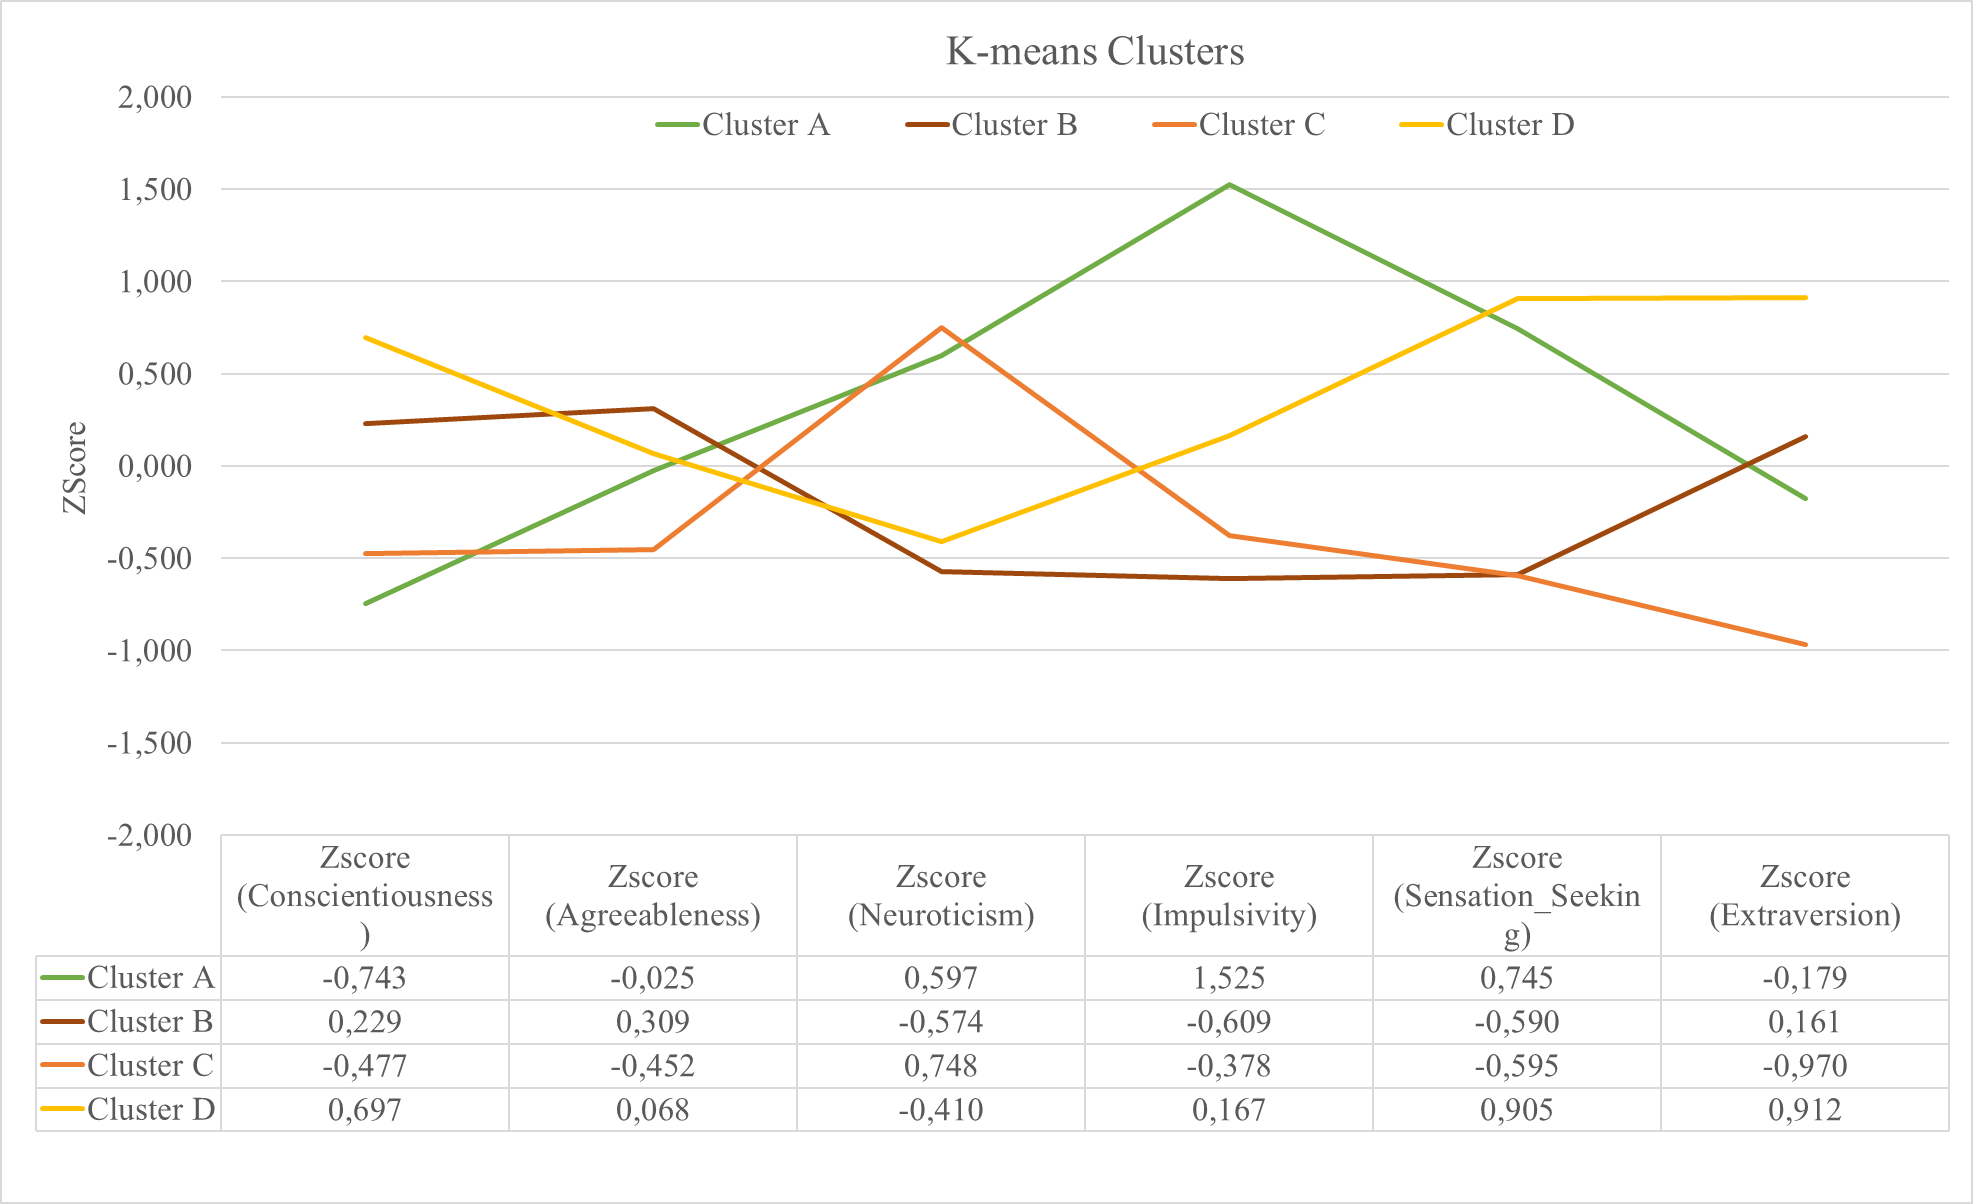
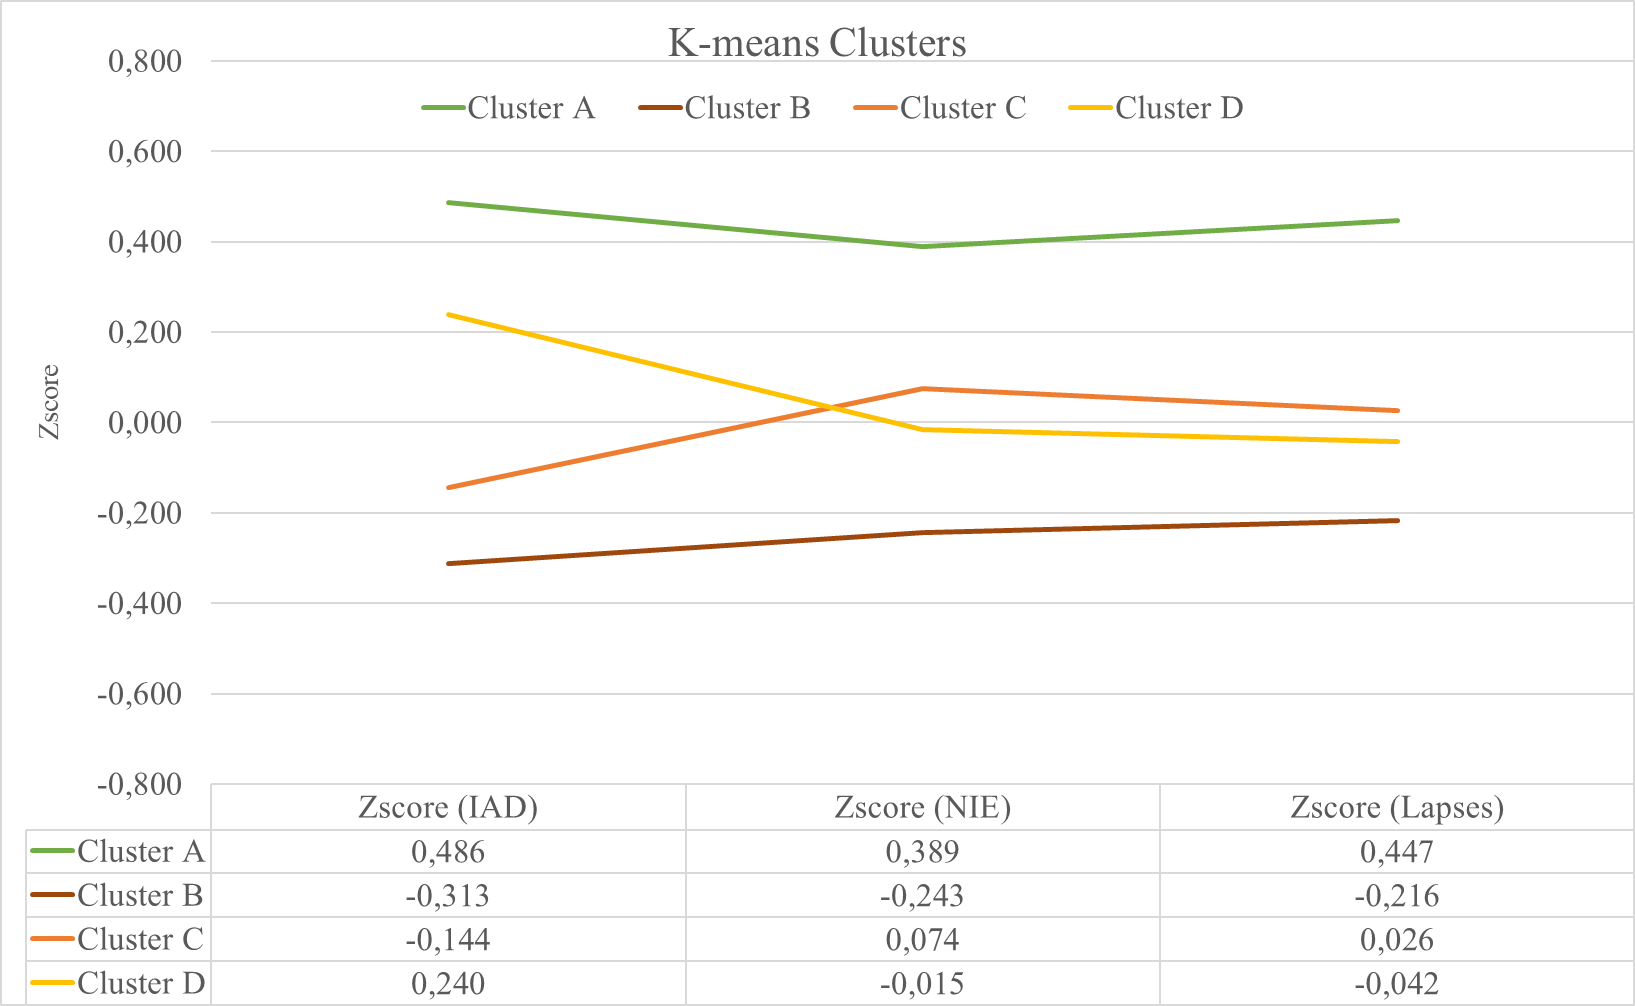
Hierarchical and k-means clustering identified four driver clusters based on personality traits — Neuroticism, Agreeableness, Conscientiousness, Extraversion, Impulsivity, and Sensation Seeking (Table 8; Figures 4 and 5). Cluster A exhibited medium/low scores for Conscientiousness, medium scores for Agreeableness and Extraversion, medium/high scores for Neuroticism and Sensation-seeking, and a high score for Impulsivity; Cluster B displayed medium/low scores for Neuroticism, Impulsivity and Sensation seeking, medium scores for Conscientiousness, Agreeableness and Extraversion; Cluster C showed low score for Extraversion, medium/low scores for Conscientiousness, Agreeableness, Impulsivity and Sensation seeking and medium/high score for Neuroticism.; and Cluster D demonstrated medium/low score for Neuroticism, medium scores for Agreeableness and Impulsivity, medium/high score for Conscientiousness, and slightly higher scores for Sensation seeking and Extraversion.
| Cluster A | Cluster B | Cluster C | Cluster D | |
|---|---|---|---|---|
| Age | 42,62 ± 12,32 | 43,35 ± 12,62 | 41,32 ± 12,31 | 40,97 ± 11,96 |
| Gender | 56.3% F; 43.7% M | 55.6% F; 44.4% M | 66.3% F; 33.7% M | 44.8% F; 55.2% M |
| Number of individuals in the group | 126 | 248 | 190 | 183 |
Given the number of individuals per cluster, ANOVA was used to compare means between groups, with Tamhane post-hoc tests applied as the variances were not homogeneous. Cluster A showed significant differences from Clusters B and C across all driving behaviours. Between Cluster A and Cluster D, significant differences were observed in NIE and Lapses. Comparisons between Clusters B and C also revealed significant differences across all behaviours, while Clusters B and D, and Clusters C and D, differed significantly only in IAD.
3.5 Validation of the profiles of each method based on the number of crashes per year
Two models were applied to analyse the number of at-fault crashes per year of driving licence, as described in Section 2.3.5. Table 9 presents the results of the regression model using the empirical profiles as independent variables, which, together with age and gender, explain 7.11% of the variance [F(5,741)= 11.336, p<.0001]. In this model, the Regular profile was used as the reference category. Apart from gender and age, only the Distracted/Forgetful profile showed statistical significance, possibly due to the higher number of observations compared with the Prudent and Aggressive profiles. This result highlights the difference between the Distracted/Forgetful and Regular profiles. The positive value estimated by the model indicates a higher crash risk for this profile compared with the Regular one.
Table 10 presents the results of the regression model using the k-means clusters as independent variables, which, together with age and gender, explain 5.26% of the variance [F(5,741)= 8.234, p<.0001]. The results show that none of the profiles were statistically significant, despite the relatively balanced number of observations across clusters.
| Model empirical profiles | Coefficient | Std. error | z | p-value | 95% CI |
|---|---|---|---|---|---|
| Constant | 0.11174 | 0.01135 | 9.85 | 0.0000 | [0.08950 ; 0.13398] |
| Age | -0.0014 | 0.00024 | -6.40 | 0.0000 | [-0.00197 ; -0.00105] |
| Gender | -0.0122 | 0.00585 | -2.01 | 0.0449 | [-0.02320 ; -0.00027] |
| Prudent | 0.0033 | 0.01036 | 0.32 | 0.7483 | [-.01698 ; 0.02363] |
| Regular | - | - | - | - | - |
| Distracted/forgetful | 0.0255 | 0.00657 | 3.88 | 0.0001 | [0.01261 ; 0.03838] |
| Aggressive | -0.01142 | 0.01386 | -0.82 | 0.4102 | [-0.03859 ; 0.01575] |
| Model k-means clusters | Coefficient | Std. error | z | p-value | 95% CI |
|---|---|---|---|---|---|
| Constant | 0.1176 | 0.01242 | 9.47 | 0.0000 | [0.09326 ; 0.14196] |
| Age | -0.0015 | 0.00024 | -6.10 | 0.0000 | [-0.00192 ; -0.00098] |
| Gender | -0.0117 | 0.00596 | -2.05 | 0.0403 | [-0.02390 ; -0.00054] |
| Cluster A | 0.0084 | 0.00915 | 0.92 | 0.3588 | [-0.00953 ; 0.02632] |
| Cluster B | -0.0030 | 0.00769 | -0.39 | 0.6987 | [-0.01806 ; 0.01210] |
| Cluster C | - | - | - | - | - |
| Cluster D | -0.0057 | 0.00833 | -0.68 | 0.4942 | [-0.02201 ; 0.01063] |
4. Discussion
4.1 The predictive ability of personality traits
Regression analyses indicated that personality traits, although accounting for modest variance, significantly predicted driving behaviour beyond socio-demographic factors. Infractions and Aggressive Driving (IAD) showed the highest explained variance (adj. R² = 0.272), followed by Lapses (adj. R² = 0.133) and Non-intentional Errors (NIE) (adj. R² = 0.101).
Higher Impulsivity, Sensation Seeking, Extraversion and Neuroticism, and lower Agreeableness, predicted higher IAD scores These findings led us to conclude that having a higher tendency to search for intense experiences and feelings, and at the same time having low compassion for others, can explain aggressive behaviours while driving, like becoming impatient with a slow driver and overtaking on the right (illegal manoeuvre in Portugal). The results also show that being talkative and assertive (extraversion), associated with the other traits, can also be correlated with pursuing aggressive behaviours on the road, like showing hostility to other drivers. Nevertheless, previous studies did not consistently confirm the role of Extraversion and Neuroticism, suggesting difficulty in defining a stable predictor set. Male gender and younger age were associated with higher IAD, corroborating earlier findings (Cordazzo et al., 2014; Granié et al., 2020). Importantly, even when controlling for Age, Gender, and Education, the personality traits still contributed significantly to explaining this aggressive behaviour.
The results of the non-intentional errors (NIE) regression also led us to claim that high tendency to act with little or no forethought (high impulsivity), together with low self-discipline (low conscientiousness) and high propensity to ruminate and experience feelings as anxiety (high neuroticism) can contribute to committing errors that can have dangerous outcomes. These results are in line with some previous findings (Tao et al., 2017). Controlling for the effect of Education, personality traits maintained their predictive ability. Gender, age and driving experience were not significant predictors, consistent with some studies (Cordazzo, 2014; Parker et al., 1995) but contradicting others (Deffenbacher et al., 2000; Correia, 2014).
Impulsivity was also the strongest predictor of Lapses, alongside low Conscientiousness and high Neuroticism. The variable Openness to experience also revealed positive association in this regression analysis, putatively showing that people with higher levels of intellectual curiosity, creativity and a preference for novelty have higher tendency to perpetuate errors related to distractibility. Female gender and younger age predicted higher Lapses, supporting existing evidence. When controlling for the socio-demographic variables, personality traits continued to significantly contribute to the model.
Overall, the consistent influence of Impulsivity and Neuroticism across all models underscores their central role in characterising driver behaviour.
4.2 Driver Behaviour Profiles
Analysis of empirical profiles revealed distinct behavioural and personality patterns. The Aggressive group scored high in Impulsivity and Sensation Seeking but low in Agreeableness, while the Prudent group showed the inverse pattern — high Agreeableness and low Impulsivity and Sensation Seeking (Figure 2). This symmetry was also evident in driving behaviour, with the Regular group occupying an intermediate position (Figure 3). Significant group differences emerged in Infractions and Aggressive Driving (IAD) and Non-intentional Errors (NIE) between Prudent and Aggressive drivers, and in IAD when comparing Prudent with Regular or “Aggressive with Regular groups.
The Distracted/Forgetful group exhibited the highest frequency of NIEs and Lapses, associated with elevated Neuroticism and Impulsivity. Moderate Agreeableness and Sensation Seeking likely explain the lower occurrence of intentional violations. This group displayed higher error and violation levels than Regular drivers, who showed balanced traits and moderate error and violation rates (Figure 3). Comparisons between Distracted/Forgetful and Regular drivers revealed significant differences across all behavioural dimensions. The Distracted/Forgetful group also showed lower Conscientiousness and higher Agreeableness than the Aggressive group, which can explain more unintentional errors and lapses but fewer deliberate violations. Regular drivers represented the majority (n=429), followed by Distracted/Forgetful (n=216), Prudent (n=67), and Aggressive (n=35), reflecting the rarity of extreme behaviours.
K-means clustering produced comparable patterns (Figures 4 and 5). Cluster A- characterised by high Impulsivity and low Conscientiousness, showed the highest IAD, Lapses, and NIE scores, encompassing impulsive/aggressive and distracted drivers. Cluster B represented prudent behaviour with the lowest error levels, while Clusters C and D displayed moderate scores, differing primarily in Extraversion. Cluster sizes were relatively balanced: Cluster B (n=248), Cluster C (n=190), Cluster D (n=183), and Cluster A (n=126). Cluster A aligned most closely with the Aggressive group, and Cluster B with the Prudent group, while Distracted/Forgetful and “Regular groups overlapped with Clusters C and D.
Comparison of both methodologies showed that Cluster A included drivers with the highest mean scores across all behaviours, while the Aggressive group primarily committed intentional violations, with a higher IAD mean (0.709 vs. 0.486). The Prudent group, comparable to Cluster B, displayed the lowest scores and greater behavioural homogeneity. The Distracted/Forgetful group showed elevated NIE and Lapse scores but no significant differences from the “Aggressive group. This profile partially overlapped with Clusters C and D, which were less clearly defined.
The linear regression model results associating the number of at-fault crashes per year of driving licence with the profiles reinforce the conclusion that profiles based on the k-means method do not accurately represent risky behaviour, as no profile showed statistical significance, even with a higher number of observations in each cluster. In contrast, the results of the model applied to the empirical method showed that the Distracted/Forgetful group had a positive relationship with the number of at-fault crashes per year compared with the Regular group. The other groups did not show statistical significance, possibly due to the small number of observations per group.
The positive estimate for the Distracted/forgetful group aligns with expectations, considering Table 6, which shows that this group exhibits average to high scores for Neuroticism and Impulsivity, as well as low to average scores for Conscientiousness. Despite the extensive number of studies examining the association between Driver Behaviour Questionnaire (DBQ) scores and crash involvement (e.g., Bobermin & Ferreira, 2022), to the best of the authors’ knowledge, none has considered profiles derived from the combined dimensions of the NEO-FFI-20, ImpSS, and DBQ. Nevertheless, studies focusing on the relationship between DBQ factors and crash involvement have reported small positive correlations between violations and errors and self-reported crashes (de Winter et al., 2015; de Winter & Dodou, 2010). Assuming the Distracted/Forgetful group can be associated with these behaviours, the findings of the present study are consistent with several previous works.
4.3 Study strengths and limitations
A major strength of this study lies in its comprehensive integration of validated psychological instruments—the NEO-FFI-20, Impulsive Sensation Seeking Scale, and Driver Behaviour Questionnaire—to construct multidimensional driver behaviour profiles. The empirical profiling approach demonstrated greater predictive validity than k-means clustering, with the Distracted/Forgetful group showing a significant positive association with crash involvement, thereby reinforcing the model’s ecological validity. The identification of four theoretically coherent profiles - Prudent, Regular, Distracted/Forgetful, and Aggressive - highlights meaningful distinctions in personality and driving behaviour, providing novel insights into driver typologies. The large community sample (N=747) and robust psychometric reliability further strengthen the findings.
Nevertheless, limitations include reliance on self-reported data, which may introduce consistency and acquiescence biases, and a sample with an overrepresentation of highly educated individuals, which is not representative of the Portuguese population. Moreover, the complexity of human behaviour is not captured in all its dimensions, limiting the conclusions. In this study we only applied K-mean cluster algorithm. Experiment with other clustering algorithms would be important to validate these results. Additionally, given that road crash events are relatively rare over a driver’s lifetime, self-reported at-fault crashes are typically sparse, thereby reducing the statistical power of the analysis and limiting the ability to detect meaningful association.
Another aspect to consider concerns the temporal context of the dataset. Data were collected in 2016, nevertheless the dataset may still be considered relevant, as the psychological constructs examined—particularly personality traits—are generally regarded as relatively stable across adulthood and repeatedly linked to driving behaviour, as outlined in the introduction. Similarly, the DBQ has shown enduring validity across different traffic contexts since its development. Nonetheless, we acknowledge that the Portuguese driving environment has evolved since 2016, including technological advancements in vehicles, changes in road safety policies, and shifts in traffic density, which may influence the expression or frequency of specific behaviours. Therefore, the findings should not be interpreted as fully representative of current conditions. Instead, they provide valuable insight into the underlying psychological mechanisms shaping driver behaviour, while highlighting the need for updated datasets to confirm contemporary applicability.
Despite these constraints, the study offers an original and methodologically rigorous contribution to understanding personality-based differences in driving behaviour.
5. Conclusions
This study identified the key personality traits underlying three risky driving behaviours—Infractions and Aggressive Driving (IAD), Non-intentional Errors (NIE), and Lapses—within a large sample of Portuguese drivers. Two methodologies were compared for developing driver behaviour profiles: an empirical approach and k-means clustering. Although both produced four groups, the empirical method yielded more coherent, interpretable, and behaviourally distinct profiles, whereas k-means resulted in heterogeneous clusters. These results highlight that statistical clustering methods, if applied mechanically and without a nuanced understanding of behavioural theory, especially if applied to limited samples, risk oversimplifying the intricate psychological processes that drive human behaviour.
Regression analyses showed that personality traits, particularly Impulsivity and Neuroticism, significantly predicted IAD, Lapses, and NIE beyond socio-demographic factors. Male gender and younger age were further associated with higher IAD, while female gender and younger age were linked to increased Lapses. The use of validated psychometric instruments (NEO-FFI-20, ImpSS, DBQ) and a robust sample strengthens the reliability of these results and contributes novel evidence to Portuguese road-safety research, consistent with international findings (de Winter et al., 2015).
Future studies should incorporate experimental and naturalistic driving methods to verify whether the identified profiles correspond to objectively distinct behavioural patterns. Such multidisciplinary approaches may enhance understanding of human factors in traffic safety, support the identification of high-risk driver subgroups, and inform targeted safety interventions. The findings may also contribute to more effective driver training by aligning it with learner profiles. From the perspective of traffic analysis, particularly in traffic simulation, these findings can be incorporated to better represent distinct driving behaviours and, consequently, to more accurately reproduce traffic dynamics, especially at the microscopic level. Additionally, in the context of vehicle technology development, these profiles can inform the improvement of various systems, including driver assistance features. For example, warning systems and in-vehicle interfaces may be tailored to individual drivers in terms of timing, modality and interaction, while distraction and fatigue detection systems could potentially benefit from profile-based customisation.
CRediT contribution
Joana Félix Dourado: Conceptualization, Formal analysis, Investigation, Methodology, Writing – original draft, Writing – review & editing. Sara Ferreira: Formal analysis, Methodology, Supervision, Writing – original draft, Writing – review & editing. Ana Telma Pereira: Formal analysis, Methodology, Supervision. Ana Bastos Silva: Supervision. Álvaro da Maia Seco: Supervision.
Acknowledgements
The authors are deeply grateful to all the participants in this study and to all the professionals involved.
Declaration of competing interests
The authors declare that there are no conflicts of interest.
Declaration of generative AI use
AI tools were used to improve English expression and clarity.
Prior dissemination declaration
The current research derives from earlier works presented on international conferences and published in their proceedings: Dourado et al., 2017a, Dourado et al., 2017b, Dourado et al., 2017c and Dourado et al., 2017d. Earlier results of the predictive ability of personality traits were presented in the Road Safety and Simulation International Conference, held in The Hague, the Netherlands, in 2017, with no publication associated.
Ethics statement
This work forms part of the doctoral project approved by the Faculty of Sciences and Technology of the University of Coimbra. The data were obtained in 2016, at a time when only informed consent was required.
Funding statement
PhD grant by Foundation for Science and Technology (PD/BD/105718/2014). UID/04427/2025 of the CITTA-Research Center for Territory, Transports and Environment with DOI: https://doi.org/10.54499/UID/04427/2025, funded by Fundação para a Ciência e a Tecnologia, I.P./ MECI through the national funds.
Data availability statement
Data are available from the corresponding author upon reasonable request.
Editorial information
Handling editor: Mette Møller, Technical University of Denmark (DTU), Denmark.
Reviewers: Désirée Hagmann, Zurich University of Applied Sciences (ZHAW), Switzerland; Ioni Lewis, Queensland University of Technology, Australia.
Submitted: 8 December 2025; Accepted: 13 May 2026; Published: 22 May 2026.