Assessing how physical and mental fatigue affect driving speed on Banda Aceh – Medan Highway Indonesia
Abstract
This study was motivated by the relatively high number of traffic accidents along Banda Aceh–Medan Highway, where driver fatigue has been repeatedly cited as the key contributing factor. The research aimed to determine the extent to which physical and mental fatigue influence driving speed behaviour on this long-distance route. A quantitative survey was conducted with 400 drivers, both professional and private, using the validated fatigue scales and Structural Equation Modeling for the data analysis. The results indicated that physical fatigue negatively affects speed stability, while mental fatigue significantly increases speed variability. Nevertheless, both physical and mental fatigue explaining 57.8% of the variance in driving speed. These findings highlight the dual cognitive and physiological dimensions of fatigue, emphasizing its role in impaired speed regulation and increased accident risk. This study contributes to existing knowledge by quantifying the distinct effects of physical and mental fatigue on driving performance in a real-world setting, thereby offering empirical support for targeted fatigue management interventions on long-distance routes.
1. Introduction
Traffic accidents continue to represent one of the foremost causes of mortality globally (Ma et al., 2018; Darma et al., 2017; Saputra, 2017). In Indonesia, road safety constitutes a pressing public health concern, as traffic collisions remain a leading cause of death nationwide (World Life Expectancy, 2020; Hermawan et al., 2024; World Health Organization, 2023). According to the World Health Organization (WHO), more than 1.19 million individuals succumb annually to road traffic accidents, with over 90% of fatalities occurring in low- and middle-income countries, including Indonesia (World Health Organization, 2023).
Among Indonesia’s high-risk transportation road corridors, Banda Aceh–Medan route, Banda Aceh is the capital of the Aceh Province, whilst Medan is the capital of the North Sumatra Province, warrants particular attention. This segment forms part of the Sumatra National Road network, serving as a principal arterial connection between Aceh Province and North Sumatra. Extending over 400 kilometers and traversing diverse topographical conditions, the corridor serves private vehicles, intercity buses, and long-haul freight trucks. The combination of high traffic volumes and extended travel durations renders drivers particularly vulnerable to both physical and mental fatigue.
Empirical data from the Aceh Regional Police Traffic Directorate indicate that, in January 2024, 239 traffic accidents were reported on roads in Aceh Province, resulting in 29 fatalities, with the majority occurring along Banda Aceh–Medan route (Antara News, 2024). Media reports further corroborate that driver fatigue and drowsiness constitute principal contributing factors. For example, in Aceh Tamiang District, a truck driver reportedly experienced a microsleep episode prior to colliding with a leading vehicle (Lentera24, 2025). Moreover, incidents have also been documented in Bireuen and Lhokseumawe Districts, where accident reconstructions suggest lapses in concentration attributable to fatigue.
Research conducted by Kacandra et al. (2024) indicates that 66.2% of intercity bus drivers operating along the Aceh–Medan route exhibited work-related fatigue. Prolonged driving durations, insufficient rest periods, and psychological stress associated with variable traffic conditions and road terrain were identified as primary factors. These findings emphasize the critical role of driver fatigue in exacerbating the risk of accidents along the route.
Physiological fatigue in drivers is characterized by reduced muscular capacity and prolonged reaction times, while cognitive fatigue leads to decreased alertness, impaired attention, and diminished decision-making performance (Freitas et al., 2024; Jiang & Yang, 2024). These fatigue states are influenced by the interaction between homeostatic sleep pressure and circadian rhythms, whereby prolonged wakefulness increases sleep propensity, while circadian low phases further degrade alertness and decision-making functioning. Valdez (2018) explains that during these phases, there is a progressive decline in tonic alertness, sustained attention, working memory, and decision-making functions, leading to reduced cognitive compensatory capacity and an increased likelihood of decision-making errors. This evidence is further supported by Wang et al. (2024), who demonstrate that sleep loss resulting from circadian rhythm disruption significantly impairs motor inhibition more than motor execution. Consequently, driver fatigue not only compromises physiological and cognitive functioning but also directly alters operational driving behaviour, thereby substantially increasing the risk of traffic accidents (Freitas et al., 2024; Pankaj, 2024).
Despite these findings, few studies have quantitatively examined the relationship between driver fatigue and driving speed along the route. The absence of empirical evidence assessing the extent to which fatigue influences driving behaviour represents a critical gap in road safety research. Developing effective accident prevention strategies requires a precise understanding of how physical and mental fatigue affect drivers’ speed regulation. Such insights can inform evidence-based traffic policies, including the implementation of mandated rest periods, strategic placement of rest facilities, and targeted safety education programs for long-distance drivers.
Accordingly, this study aims to evaluate the relationship between driver fatigue and driving speed along Banda Aceh–Medan route. The findings are expected to support accident prevention initiatives and contribute to the improvement of traffic safety on long-distance land transport travel.
2. Literature review
Traffic accidents represent a serious issue with significant implications for human safety, economic losses, and the efficiency of transportation systems. Broadly, the causes of traffic accidents can be categorized into three factors: human factors, vehicle-related factors, and environmental or road-related factors (Jecson et al., 2020; European Commission, 2024; Puspasari et al., 2023; Ojo, 2015; Harith et al., 2019; Parvez et al., 2025; Bucsuházy et al., 2019). Among these, human factors have been consistently identified as the most dominant contributor in previous studies (European Commission, 2024; Puspasari et al., 2023; Ojo, 2015; Harith et al., 2019; Bucsuházy et al., 2019).
A critical aspect of human factors frequently associated with elevated accident risk is driver fatigue. Fatigue has been shown to be a primary element contributing to loss of vehicle control and diminished decision-making capacity on the road (Fell & Black, 1997; Philip et al., 2005; May & Baldwin, 2009; Gunawardane & Dharmaratne, 2014; Lim & Chia, 2015; Davidović et al., 2018). Generally, fatigue is defined as physiological and psychological condition characterized by reduced physical and mental capabilities and impaired alertness due to prolonged activity, insufficient rest, or disruption of the body’s biological rhythms (May & Baldwin, 2009; Lim & Chia, 2015). This condition can impair alertness, motor skills, reflexes, judgment, and decision-making ability (Lim & Chia, 2015).
Since Crawford’s early investigations (1961), fatigue has been regarded as a complex and difficult-to-measure phenomenon. Fatigue can generally originate from two sources: (1) operational fatigue, which arises from the act of driving itself, and (2) pre-existing fatigue, which affects driving performance (Tong et al., 2024). Physical and mental fatigue develop differently yet interact during driving, as noted by Tong et al. (2024).
Mental fatigue can be understood as the cumulative consequence of sustained high mental load, wherein the cognitive demands of driving continuously deplete attentional resources and decision-making control capacity. Experimental research by Huang et al. (2024) demonstrates that increased mental workload particularly under dual-task driving conditions reduces attentional capacity and motor control, reflecting the early stages of mental fatigue through measurable degradation in driving performance. These findings are reinforced by the systematic review conducted by Raza et al. (2024), which concludes that prolonged exposure to high mental workload is consistently associated with reduced alertness, delayed reaction times, and impaired decision-making. These effects are physiologically evidenced by alterations in indicators such as heart rate variability. Accordingly, mental fatigue functions as a transitional mechanism linking cognitive driving demands to declines in operational performance that elevate safety risks.
Physical fatigue in drivers refers to a reduction in neuromuscular capacity induced by prolonged static postures, sustained muscle tension, and extended working durations during driving activities (Alonso et al., 2016). However, empirical findings by Selan et al. (2024) indicate that physical workload is not significantly associated with fatigue, whereas mental workload shows a strong relationship, suggesting that drivers perceived physical complaints often represent downstream manifestations of prolonged mental strain. This evidence highlights that physical fatigue in drivers rarely occurs in isolation but is closely intertwined with mental fatigue. Jin et al. (2024) further substantiate this interaction by reporting that increasing physical fatigue may accelerate mental fatigue through heightened demands on central nervous system control, while mental fatigue, in turn, diminishes drivers’ ability to maintain effective neuromuscular coordination.
Alonso et al. (2016) additionally note that mental fatigue predominantly affects decision-making processes and driving safety, whereas physical fatigue contributes to degraded vehicle control through postural alterations and impaired motor responses. The combined effects of these fatigue dimensions result in a decline in drivers’ cognitive functioning and attentional capacity, which directly influences operational driving behaviors, such as speed fluctuations (Biggs et al., 2009; Saxby et al., 2013; Freitas et al., 2024; Pankaj, 2024).
Fatigue impairs the ability to maintain a constant speed (Fell & Black, 1997) and causes speed instability (May & Baldwin, 2009). It reduces reaction time and sensorimotor control, preventing drivers from adjusting speed appropriately to road conditions, for instance by delaying braking or failing to notice unintended acceleration due to lapses in attention (Lim & Chia, 2015; Davidović et al., 2018). May & Baldwin (2009) further note that in monotonous road conditions such as long straight roads with limited visual variation, light traffic, and extended travel durations passively fatigued drivers often fail to notice incremental speed increases due to diminished active monitoring of vehicle speed.
Even in the absence of physical fatigue, the brain can enter a state of decreased alertness, reduce speed perception and increase the risk of microsleep (Ma et al., 2018; Van Dongen et al., 2003). This is particularly hazardous given that reaction times to expected events range from 0.6 to 2 seconds, whereas reactions to unexpected events can be up to 35% slower (AASHTO, 2018). Hou et al. (2024) report that reduced variation in visual stimuli positively correlates with longer microsleep episodes and greater vehicle speed variability, which, according to Zhang et al. (2025), increases the risk of traffic accidents.
Continuous driving induces fatigue and drowsiness, thereby increasing the likelihood of human error and traffic accidents (Meilinda et al., 2025). Williamson et al. (2011) demonstrated that fatigue impairs speed perception, leading drivers to unconsciously maintain higher driving speeds. Accumulated fatigue further degrades psychomotor functioning, prolongs reaction times, and elevates the risk of vehicle control loss (Fell & Black, 1997; Davidović et al., 2018). This form of fatigue significantly affects driving performance in both professional and non-professional drivers; however, its underlying mechanisms, accumulation patterns, and subjective perception differ between these groups.
Field studies involving professional bus drivers indicate that fatigue develops cumulatively over real driving shifts, as evidenced by reduced neural arousal and alterations in cardiac autonomic regulation, such as heart rate variability (HRV), despite the routinized and highly practiced nature of the driving task (Lecca et al., 2022; Miller & Filtness, 2024). In this population, fatigue is primarily driven by extended working hours, irregular schedules, economic pressures and sleep disturbances, rendering it latent and chronic in nature (Fell & Black, 1997; Gunawardane & Dharmaratne, 2014; Peng et al., 2020; Blom et al., 2024). Notably, many professional drivers continue to perceive themselves as capable of driving safely even when physiological indicators reveal reduced alertness, highlighting a mismatch between subjective self-assessment and objective fatigue states.
In contrast, fatigue among non-professional drivers tends to be situational and manifests rapidly in driving performance, often emerging as an acute response to partial sleep deprivation. Comparative studies have shown that partial sleep loss significantly degrades driving performance, as reflected in increased lane deviation, greater speed variability, and delayed reaction times (Mahajan & Velaga, 2022). Although non-professional drivers are generally more aware of subjective sleepiness, they typically lack effective operational compensation strategies, resulting in more immediate and observable performance deterioration.
Direct comparisons further reveal that professional drivers frequently report lower levels of subjective sleepiness, while objective indicators such as blink duration and lane deviation suggest equivalent or even higher levels of fatigue relative to non-professional drivers (Anund et al., 2018). This pattern suggests that occupational experience and habitual work demand foster compensatory strategies (e.g., maintaining speed consistency) that mask fatigue symptoms without eliminating their underlying physiological effects. Conversely, non-professional drivers tend to exhibit more pronounced and rapid performance degradation under fatigue due to limited adaptation to fatigued driving conditions.
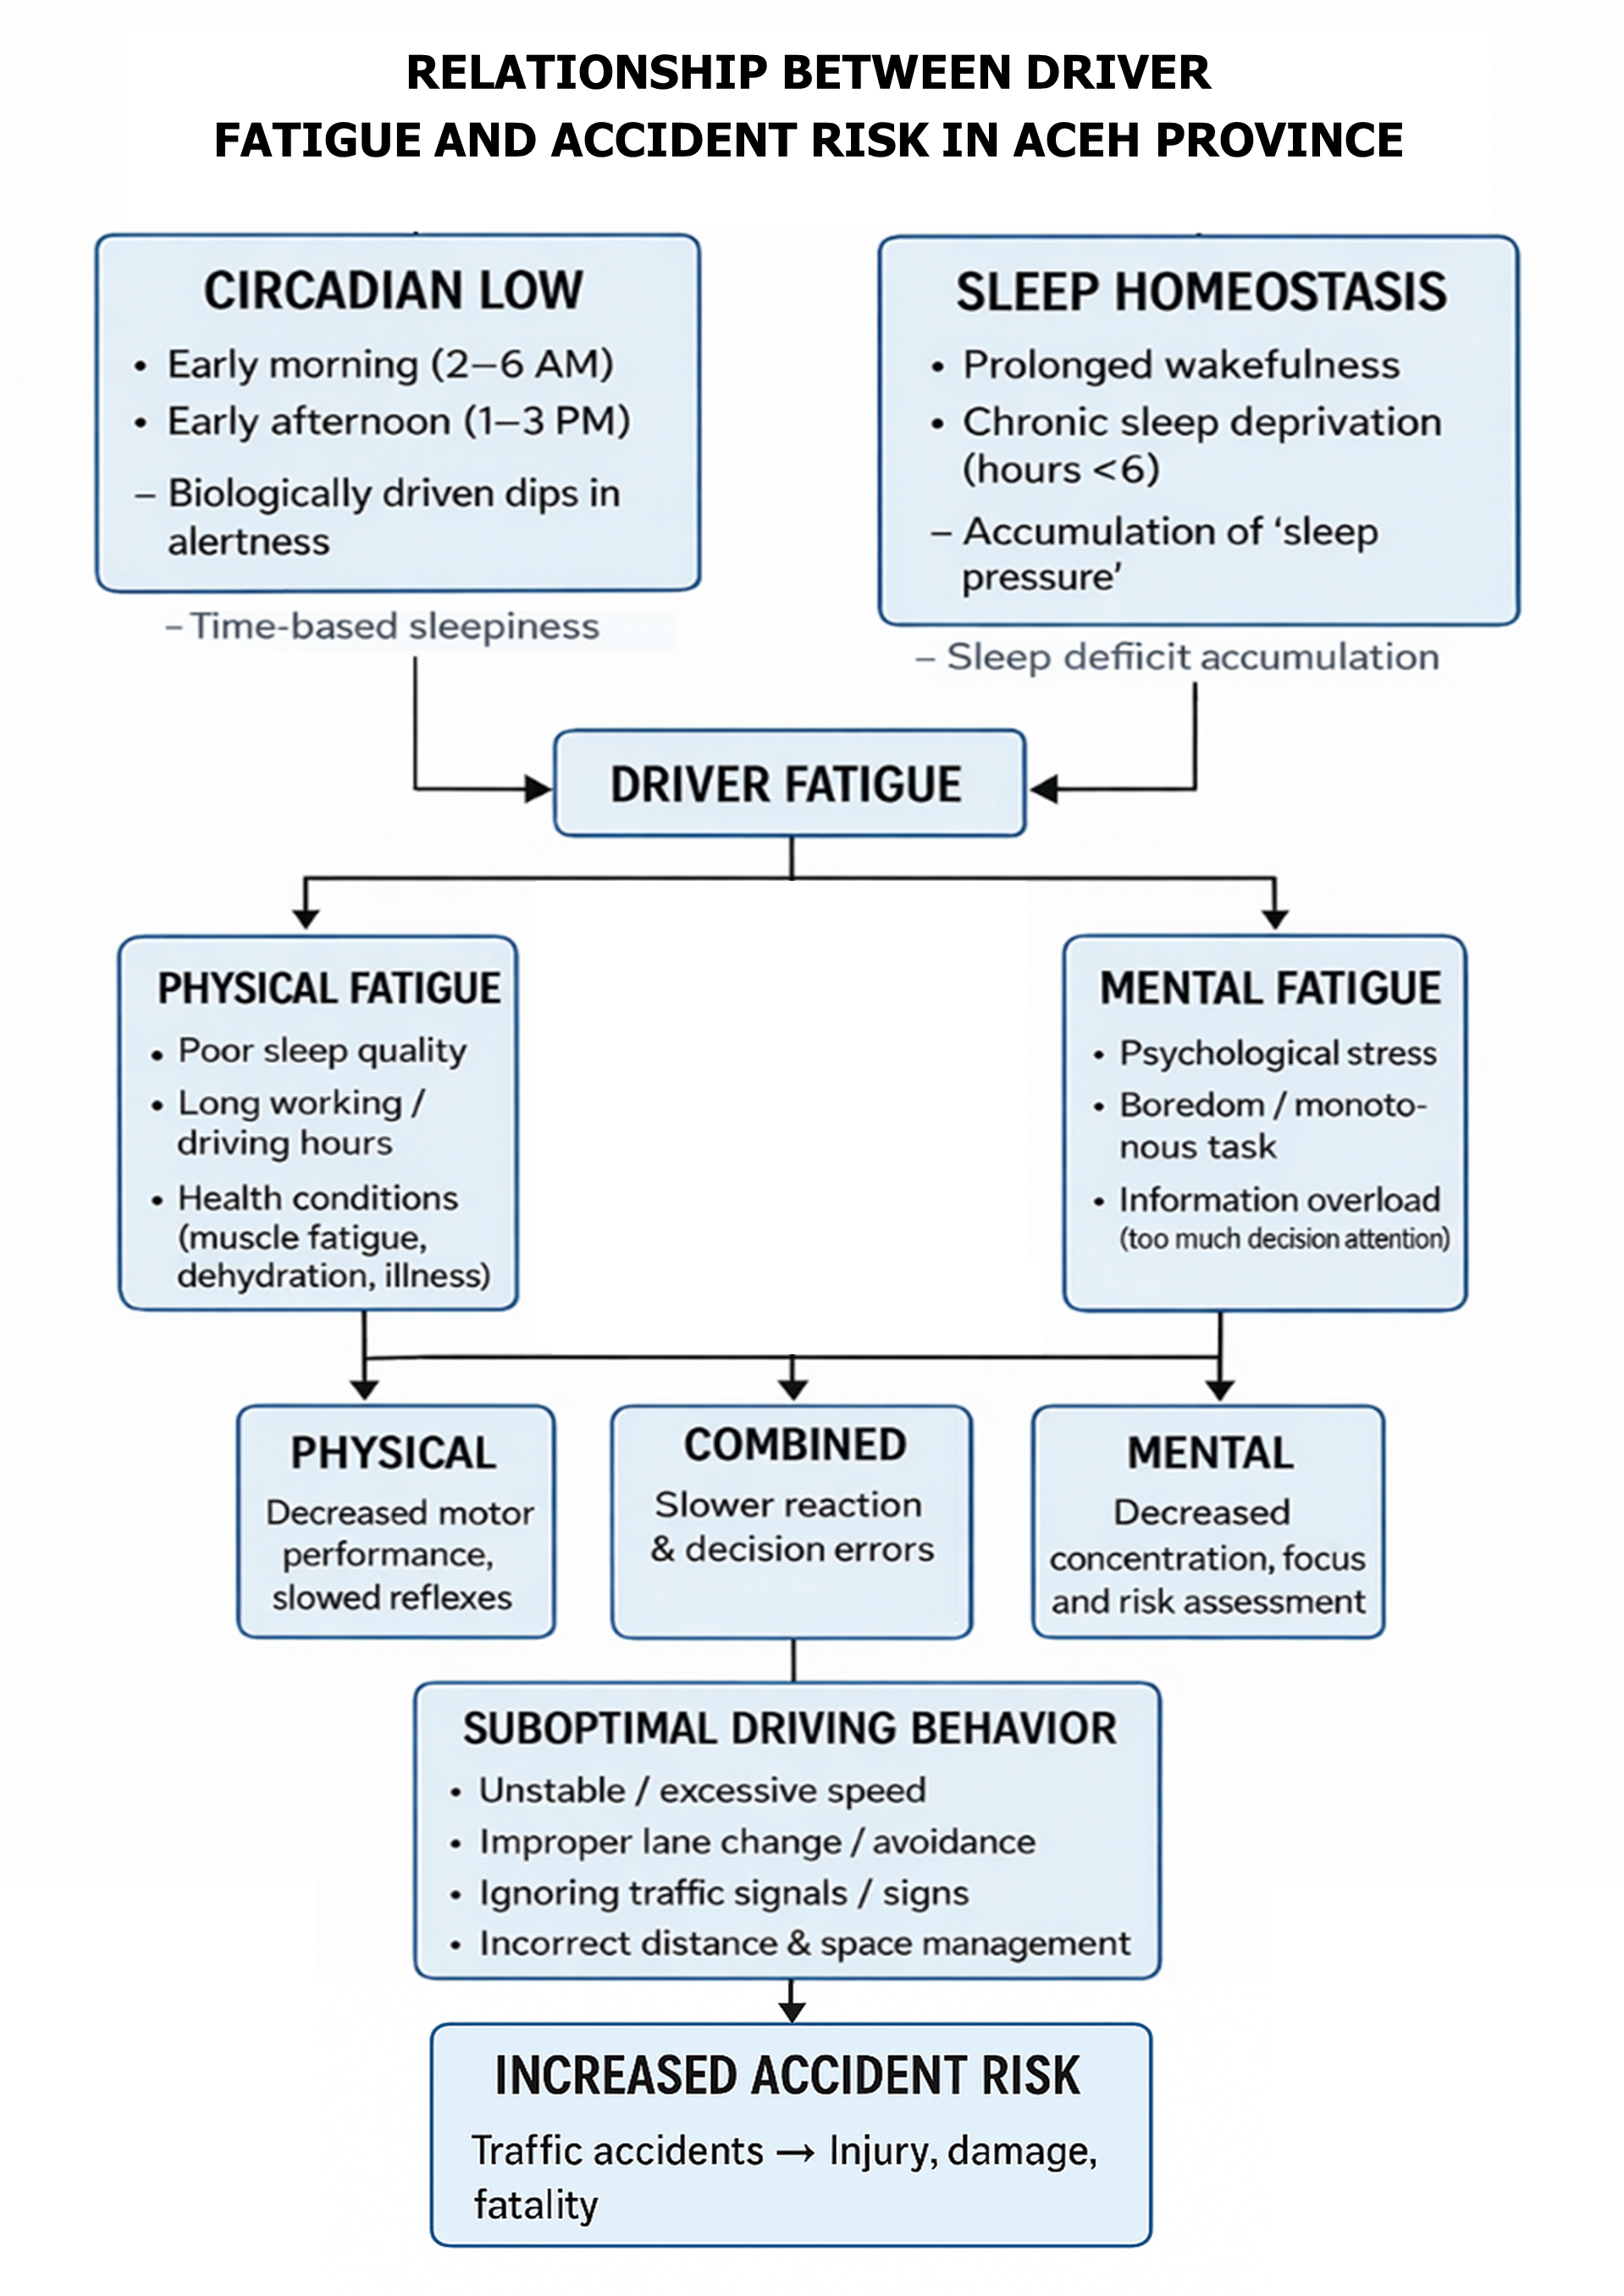
Figure 1 presents a conceptual framework illustrating how driver fatigue influences driving speed and ultimately contributes to traffic accidents. Driver fatigue emerges from the cumulative interaction of multiple internal and external factors. Notably, circadian low phases and sleep homeostatic pressure function as fundamental biological regulators of driver fatigue, primarily inducing mental fatigue, which may subsequently precipitate physical fatigue. Through these interconnected mechanisms, fatigue degrades driving behaviour particularly speed regulation thereby increasing the risk of traffic accidents.
In Aceh Province, the westernmost province of Indonesia, a similar concern has emerged. Transportation activities in this region are heavily dependent on land transport, both for passenger mobility and commodity distribution (Fithra et al., 2019; Saleh et al., 2025). Key routes, such as Banda Aceh–Medan Highway, serve as vital corridors for the movement of people and goods, including the supply of raw materials to North Sumatra Province. Travel along this route typically takes 8–12 hours, traversing long, straight roads with minimal visual variation on some road segments. Such conditions create a monotonous environment that can induce fatigue and reduce driver alertness.
For drivers of passenger and freight vehicles, the pressure to meet schedules and economic targets often compels them to continue driving despite feeling fatigued. This fatigue directly affects the driver’s ability to regulate vehicle speed. Specifically, the combination of physical and mental fatigue slows reaction times and impairs sensorimotor coordination, leading to speed fluctuations and an increased risk of losing vehicle control. On long-distance routes such as Banda Aceh–Medan, the monotonous and straight road conditions make drivers particularly susceptible to lapses in attention, causing vehicles to unintentionally exceed safe speeds.
Previous studies have generally examined driver fatigue through partial or fragmented approaches, focusing either on the prevalence and subjective perception of fatigue (Alonso et al., 2016), the relationship between workload and fatigue (Selan et al., 2024), or the physiological interaction between physical and mental fatigue using multimodal measurements (Jin et al., 2024). Most of these studies have been conducted in generalized contexts, simulated environments, or regions with traffic characteristics and infrastructure that differ substantially from those found in Indonesia.
In contrast to prior research, the present study explicitly addresses the conceptual integration of mental and physical fatigue and examines their combined implications for operational driving behaviour, particularly speed fluctuations and vehicle control. Fatigue is not conceptualized merely as a physiological or psychological state, but rather as a dynamic mechanism that mediates the relationship between driving demands and safety risk through observable changes in drivers’ operational behaviour.
Furthermore, this study introduces contextual novelty by applying a driver fatigue framework to real-world conditions in Aceh Province, which are characterized by long-distance travel, monotonous road environments, and relatively low public awareness of fatigue-related driving risks, particularly among the local communities. This context has received limited attention in previous literature. Accordingly, the study contributes to expanding the understanding of driver fatigue in regions with distinct geographical and social characteristics, while providing empirical evidence to support transportation safety improvements in Aceh.
3. Methods
This study employed a quantitative approach with an explanatory research design, utilizing a survey method to analyze the effects of physical and mental fatigue on driving speed behaviour among drivers traversing the main Banda Aceh–Medan route.
This route was selected because it constitutes one of the primary transportation corridors in northern Sumatra, characterized by high traffic volumes and diverse road conditions, ranging from urban areas to hilly terrain. Moreover, Banda Aceh–Medan route is frequently used by long-distance drivers, such as freight and passenger transport operators, who are likely to experience both physical and mental fatigue due to prolonged travel durations. These conditions render the route particularly relevant for examining driving speed behaviour and the factors that influence it.
3.1 Samples
Data were collected directly from four-wheeled vehicle drivers, including both private and commercial vehicles, who were either currently traveling on or had recently traversed Banda Aceh–Medan route. Purposive sampling was employed, with the following criteria for respondent selection:
-
Drivers who had been operating a vehicle for a minimum of four consecutive hours,
-
Possessed a valid driver’s license,
-
Were traveling on or had travelled along Banda Aceh–Medan route at the time of the study.
A total of 400 respondents participated in this study, in accordance with the guidelines recommended by Hair et al. (2010) and Kinnear and Taylor (1996) for obtaining a representative sample in quantitative research. To assess tendencies in physical and mental fatigue levels, respondents were categorized into two groups: professional drivers, consisting of public transport and freight vehicles, and non-professional drivers, comprising private vehicle users.
It should be noted that under Indonesian traffic regulations, vehicle speed limits are determined based on road classification. In this study, Banda Aceh–Medan route is classified as an interprovincial arterial road, with a minimum speed limit of 60 km/h and a maximum of 100 km/h. Although these regulatory limits apply uniformly along the corridor, actual operating speeds differ in practice between buses and passenger cars due to variations in vehicle dimensions and weight, acceleration capability, manoeuvrability, and operational characteristics.
Buses generally exhibit lower acceleration rates and are more strongly influenced by traffic conditions and road geometry, whereas passenger cars offer greater flexibility and acceleration capacity, enabling more stable speed maintenance. Nevertheless, all respondents traveled along the same roadway corridor and were exposed to identical geometric design standards, traffic control devices, and posted speed limit signage throughout Banda Aceh–Medan Highway.
Accordingly, this study does not focus on absolute speed levels, but rather on self-reported speed regulation behaviour, including speed instability, unintentional speeding, and unconscious acceleration or deceleration. These behavioural indicators are considered comparable across vehicle types and are used to capture the effects of physical and mental fatigue on driving behaviour rather than differences arising solely from regulatory speed thresholds or vehicle performance characteristics.
3.2 Research variables
This study examines three primary variables:
-
Physical Fatigue (X1) as an independent variable,
-
Mental Fatigue (X2) as an independent variable, and
-
Driving Speed (Y) as the dependent variable.
Both independent variables are hypothesized to influence drivers’ speed behaviour along the main Banda Aceh–Medan route. Each variable is operationalized through specific indicators, measured using a 5-point Likert scale. All indicators are assessed using self-reported measures that capture drivers’ perceived performance degradation related to physical fatigue, mental fatigue, and fatigue-induced driving behaviour across different driver groups. The indicators were adapted from the Fatigue Assessment Scale (FAS) developed by Michielsen et al. (2003) and from the scale proposed by the Research Committee on Industrial Fatigue of the Japan Society for Occupational Health as introduced by Yoshitake (1978), which have been modified to suit the driving context as presented in Table 1.
| Variables | Indicators |
|---|---|
| Physical Fatigue (X₁) | KF1: Headache during prolonged driving |
| KF2: Pain in specific body parts (e.g., back) while driving | |
| KF3: Shoulder stiffness during driving | |
| KF4: Dizziness during long trips | |
| KF5: Sleepiness after several hours of driving | |
| KF6: Tremors in limbs during prolonged driving | |
| KF7: Easily tired while driving | |
| KF8: Eyelid spasms after long driving periods | |
| KF9: Difficulty focusing/mental confusion while driving | |
| Mental Fatigue (X₂) | KM1: Difficulty maintaining concentration on long trips |
| KM2: Nervousness in dense traffic conditions | |
| KM3: Difficulty sustaining attention during prolonged driving | |
| KM4: Forgetting important items during driving (e.g., traffic signs) | |
| KM5: Difficulty controlling oneself while driving | |
| KM6: Unintentionally leaving the lane | |
| KM7: Delayed reactions to traffic | |
| KM8: Feeling mentally exhausted during long-distance driving (bored) | |
| KM9: Reduced discipline in challenging road situations | |
| Driving Speed (Y) | KC1: Difficulty maintaining a stable speed |
| KC2: Driving too slowly due to loss of focus or energy | |
| KC3: Exceeding speed limits unintentionally due to inattention | |
| KC4: Unconsciously accelerating and decelerating the vehicle |
3.3 Data analysis
The collected data were analyzed in a stepwise manner to ensure quality, validity, and reliability before testing the structural model. The analysis was conducted using Structural Equation Modeling (SEM). The steps included:
-
Construct validity and reliability testing using Confirmatory Factor Analysis (CFA).
-
Multicollinearity test to ensure that no latent variables were excessively correlated (correlation values between latent variables should not exceed ±0.90).
-
Heywood case examination, which occurs when standardized loadings exceed 1 or error variances are negative.
-
Goodness of Fit (GoF) Test to evaluate the extent to which the model fits the empirical data.
Construct validity was assessed using CFA to confirm that the indicators accurately represent the latent variables. Reliability was evaluated using Composite Reliability (CR) and Average Variance Extracted (AVE). The criteria for validity and reliability are summarized in Table 2:
| Type | Criteria | Cut-off Standard |
|---|---|---|
| Convergent Validity | Factor Loading | ≥ 0.50 |
| Construct Reliability | Composite Reliability (CR) | ≥ 0.70 |
| Convergent Validity | Average Variance Extracted (AVE) | ≥ 0.50 |
The Goodness of Fit was evaluated to determine the degree of fit between the structural model and the empirical data. Multiple GoF indices were applied to provide a comprehensive assessment, as shown in Table 3:
| GoF Index | Variables | Cut-off Standard |
|---|---|---|
| RMSEA | The Root Means Square Error of Approximation Index | <0.100 |
| CFI | The Comparative Fit Index | >0.900 |
| GFI | The Adjusted GoF | >0.900 |
| AGFI | The Adjusted GoF Index | >0.900 |
| PCFI | The Parsimonious Normed Fit Index | >0.500 |
4. Results
4.1 Driver characteristics
The research data were obtained from 400 respondents, divided into two main groups based on their profession as professional drivers, i.e., respondents working as public transportation drivers or cargo vehicle drivers and non-professional drivers, i.e., respondents using private vehicles who do not work as drivers. Details of the respondents’ characteristics are presented in Table 4 below:
| Category | Subcategory / Range | Frequency (n) | Percentage (%) |
|---|---|---|---|
| Age | 17–25 years | 78 | 19.50 |
| 26–33 years | 103 | 25.80 | |
| 34–40 years | 82 | 20.50 | |
| 41–50 years | 108 | 27.00 | |
| 51– >60 years | 29 | 7.25 | |
| Type of drivers | Professional driver | 200 | 50.00 |
| Non-professional | 200 | 50.00 | |
| Gender | Male | 363 | 90.75 |
| Female | 37 | 9.25 |
In this study, the measured levels of fatigue between professional drivers and non-professional drivers were compared to identify the tendencies of different types of fatigue experienced by each group. The results of this comparison are presented in Table 5 below.
| Type | PF Score | MF Score | Duration (%) | Travel Time | ||
|---|---|---|---|---|---|---|
| Professional Driver | 19.00 | 14.79 | 4 – <6 hours | 19.5 | Morning (05:01 – 10:59) | 11.0 |
| 6 – <8 hours | 13.5 | Afternoon (11:00 – 14:59) | 2.5 | |||
| 8 – <10 hours | 19.5 | Evening (15:00 – 18:59) | 13.5 | |||
| ≥10 hours | 47.5 | Night (19:00 – 23:59) | 70.0 | |||
| Midnight (00:00 – 05:00) | 3.0 | |||||
| Non-professional Driver | 15.53 | 19.80 | 4 – <6 hours | 90.5 | Morning (05:01 – 10:59) | 41.5 |
| 6 – <8 hours | 0.0 | Afternoon (11:00 – 14:59) | 15.5 | |||
| 8 – <10 hours | 5.5 | Evening (15:00 – 18:59) | 16.0 | |||
| ≥10 hours | 4.0 | Night (19:00 – 23:59) | 23.0 | |||
| Midnight (00:00 – 05:00) | 4.0 | |||||
Based on Table 5, professional drivers have a physical fatigue score of 19.00, which falls into the moderate category, while non-professional drivers have a score of 15.53, categorized as low. This indicates that professional drivers experience higher physical strain. According to Davidović et al. (2018), professional driver fatigue is influenced by long working hours, inadequate rest periods, and job-related pressures.
In this study, nearly half of the professional drivers worked for ≥10 hours per day, with most trips occurring at night. The combination of long working hours and nighttime driving makes their bodies more susceptible to physical fatigue due to continuous work and disruption of the circadian rhythm. In contrast, most non-professional drivers only drove for 4-<6 hours per day, with the majority of trips taking place in the morning, resulting in relatively lower physical fatigue levels.
Regarding mental fatigue, professional drivers scored 14.79, classified as low, whereas non-professional drivers scored 19.80, considered moderate. This suggests that non-professional drivers experience higher mental workload, possibly due to variations in routes and unpredictable traffic conditions, while professional drivers are more accustomed to routine routes and schedules, resulting in a lighter mental load. Differences in work patterns are also reflected in the distribution of travel time and duration. Professional drivers primarily drive at night for long durations, whereas non-professional drivers tend to drive from morning to evening for shorter periods, reducing the risk of physical fatigue.
4.2 Structural model testing
Before the model was analysed further, several tests were conducted to assess its suitability. Based on the results of the Confirmatory Factor Analysis (CFA), it was found that one indicator in the X1 variable i.e. Physical Fatigue, namely KF4, and one indicator in the X2 variable i.e. Mental Fatigue, namely KM9, had factor loading values below 0.5. This indicates that these two indicators do not adequately reflect their respective latent constructs, and therefore, they are considered invalid and need to be removed (dropped) from the model. Meanwhile, for the Y variable i.e. Driver Speed, all indicators had factor loading values greater than 0.5, so all indicators were considered valid and could be used in the subsequent analysis.
Next, construct reliability tests were conducted to assess the internal consistency of the indicators in reflecting the latent variables. Construct reliability can be measured using two main metrics: Composite Reliability (CR) and Average Variance Extracted (AVE). According to Hair et al. (2010), a construct is considered to have good reliability if CR ≥ 0.70 and AVE ≥ 0.50. The results of the construct reliability calculations for each variable can be seen in Table 6–8 below.
| Indicators | Variables | Estimate | Squared Estimate | 1- Squared Estimate | |
|---|---|---|---|---|---|
| KF8 | 🡨 | X1 | 0.655 | 0.429 | 0.571 |
| KF7 | 🡨 | X1 | 0.661 | 0.437 | 0.563 |
| KF6 | 🡨 | X1 | 0.801 | 0.642 | 0.358 |
| KF5 | 🡨 | X1 | 0.700 | 0.490 | 0.510 |
| KF3 | 🡨 | X1 | 0.840 | 0.706 | 0.294 |
| KF2 | 🡨 | X1 | 0.815 | 0.664 | 0.335 |
| KF1 | 🡨 | X1 | 0.651 | 0.424 | 0.576 |
| Total Construct (TC) | 5.123 | ||||
| Measurement Error Sum (MES) | 3.209 | ||||
| Composite Reliability (CR) | TC2 / (TC2+ MES) | 0.891 | |||
| Total Squared Construct (TSC) | 3.791 | ||||
| Average Variance Extracted (AVE) | TCS2 / (TCS2+ MES) | 0.817 | |||
Based on Table 6, variable X1 (Physical Fatigue) has a Composite Reliability (CR) value of 0.891 and an Average Variance Extracted (AVE) value of 0.817. Both values exceed the minimum thresholds, indicating that the Physical Fatigue construct demonstrates good reliability.
| Indicators | Variables | Estimate | Squared Estimate | 1- Squared Estimate | |
|---|---|---|---|---|---|
| KM9 | 🡨 | X2 | 0.639 | 0.408 | 0.591 |
| KM7 | 🡨 | X2 | 0.693 | 0.480 | 0.519 |
| KM6 | 🡨 | X2 | 0.657 | 0.431 | 0.568 |
| KM5 | 🡨 | X2 | 0.746 | 0.556 | 0.443 |
| KM4 | 🡨 | X2 | 0.768 | 0.590 | 0.410 |
| KM3 | 🡨 | X2 | 0.737 | 0.543 | 0.456 |
| KF2 | 🡨 | X2 | 0.622 | 0.386 | 0.613 |
| KF1 | 🡨 | X2 | 0.719 | 0.517 | 0.483 |
| Total Construct (TC) | 5.581 | ||||
| Measurement Error Sum (MES) | 4.086 | ||||
| Composite Reliability (CR) | TC2 / (TC2+ MES) | 0.884 | |||
| Total Squared Construct (TSC) | 3.913 | ||||
| Average Variance Extracted (AVE) | TCS2 / (TCS2+ MES) | 0.789 | |||
Based on Table 7, variable X2 (Mental Fatigue) shows a CR value of 0.884 and an AVE value of 0.789. Since both values meet the reliability criteria, the Mental Fatigue construct is considered reliable.
| Indicators | Variables | Estimate | Squared Estimate | 1- Squared Estimate | |
|---|---|---|---|---|---|
| KC1 | 🡨 | Y | 0.813 | 0.661 | 0.339 |
| KC2 | 🡨 | Y | 0.854 | 0.729 | 0.271 |
| KC3 | 🡨 | Y | 0.848 | 0.719 | 0.281 |
| KC4 | 🡨 | Y | 0.872 | 0.760 | 0.240 |
| Total Construct (TC) | 3.387 | ||||
| Measurement Error Sum (MES) | 1.130 | ||||
| Composite Reliability (CR) | TC2 / (TC2+ MES) | 0.910 | |||
| Total Squared Construct (TSC) | 2.870 | ||||
| Average Variance Extracted (AVE) | TCS2 / (TCS2+ MES) | 0.879 | |||
Based on Table 8, variable Y (Driving Speed) obtained a CR value of 0.910 and an AVE value of 0.879, indicating a very high level of reliability.
Moreover, all standardized loading estimates were below 1, confirming that there is no indication of a Heywood Case (HC). Thus, all constructs in this research model X1 (Physical Fatigue), X2 (Mental Fatigue), and Y (Driving Speed) meet the reliability and validity criteria. It can therefore be concluded that the measurement model demonstrates strong internal consistency and is suitable for further structural analysis.
Consequently, the multicollinearity test was conducted to determine whether there were excessively strong correlations among the latent variables in the model. Table 9 presents the results of the multicollinearity assumption test.
| Variables | X2 | X1 | Y |
|---|---|---|---|
| X2 | 1.000 | ||
| X1 | 0.814 | 1.000 | |
| Y | 0.756 | 0.569 | 1.000 |
Based on the correlation analysis among the latent variables shown in Table 9, all correlation values are below the threshold of ± ±0.90, indicating that no multicollinearity issue exists among the latent variables in the model.
The Goodness of Fit (GoF) test then was conducted to assess the extent to which the estimated model is able to represent the observed data as a whole. The results of the model fit evaluation are presented in Table 10 below.
| Parameter | Result | Criteria |
|---|---|---|
| RMSEA | 0.097 | Good Fit |
| CFI | 0.883 | Marginal Fit |
| GFI | 0.822 | Marginal Fit |
| AGFI | 0.873 | Marginal Fit |
| PCFI | 0.769 | Good Fit |
Overall, the Goodness of Fit results indicate that the model demonstrates an acceptable level of fit (marginal fit). Therefore, it can be concluded that the proposed model is adequately representative of the empirical data and is suitable.
4.3 The effect of fatigue on driving speed
To determine the extent to which each indicator represents its corresponding latent construct and to test the significance of each indicator’s contribution to its variable, Table 11 presents the estimation weights and t-values for each indicator under the variables of physical fatigue, mental fatigue, and driving speed stability, respectively.
| Variable | Indicator | Notation | Estimate | t-value |
|---|---|---|---|---|
| Physical Fatigue | Eyelid spasms after long driving periods | KF8 | 1.000 | |
| Easily tired while driving | KF7 | 0.661 | 8.163 | |
| Tremors in limbs during prolonged driving | KF6 | 0.801 | 9.685 | |
| Sleepiness after several hours of driving dizziness during long trips | KF5 | 0.700 | 8.585 | |
| Shoulder stiffness during driving | KF3 | 0.840 | 9.831 | |
| Pain in specific body parts (e.g., back) while driving | KF2 | 0.815 | 9.721 | |
| Headache during prolonged driving | KF1 | 0.651 | 8.199 | |
| Mental Fatigue | Delayed reactions to traffic | KM7 | 1.000 | |
| Unintentionally leaving the lane | KM6 | 0.746 | 8.707 | |
| Difficulty controlling oneself while driving | KM5 | 0.768 | 9.775 | |
| Forgetting important items during driving (e.g., traffic signs) | KM4 | 0.737 | 9.980 | |
| Difficulty sustaining attention during prolonged driving | KM3 | 0.622 | 9.576 | |
| Nervousness in dense traffic conditions | KM2 | 0.719 | 8.076 | |
| Difficulty maintaining concentration on long trips | KM1 | 0.639 | 9.326 | |
| Reduced discipline in challenging road situations | KM9 | 0.639 | 8.513 | |
| Driving Speed | Difficulty maintaining a stable speed | KC1 | 1.000 | |
| Driving too slowly due to loss of focus or energy | KC2 | 0.854 | 14.028 | |
| Exceeding speed limits unintentionally due to inattention | KC3 | 0.848 | 13.737 | |
| Unconsciously accelerating and decelerating the vehicle | KC4 | 0.872 | 14.453 |
All indicators in Table 11 meet the required criteria, with t-values substantially higher than the minimum threshold of 1.96. This indicates that each indicator significantly represents its respective latent variable physical fatigue, mental fatigue, and driving speed stability.
The structural model diagram illustrating the relationships between physical fatigue (X1), mental fatigue (X2), and driving speed stability (Y) after the model validation and fit testing is presented in Figure 2 below.
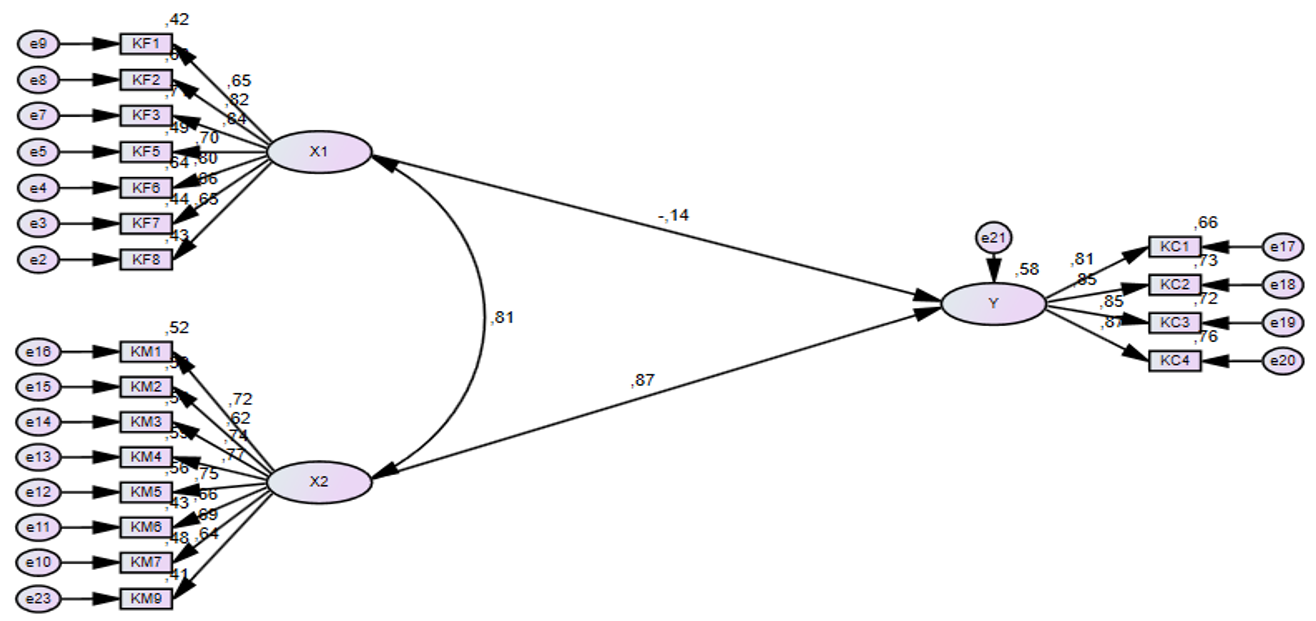
Based on the structural model illustrated in Figure 2, it was found that physical fatigue (X1) exerts a negative influence on driving speed (Y) with a standardized coefficient of -0.14. In contrast, mental fatigue (X2) has a positive and statistically significant influence on driving speed, with a standardized coefficient of 0.87. The significance of these relationships can be observed from the probability (p) values, both of which are smaller than 0.001, as presented in Table 12, indicating that the relationships are statistically significant.
| Variables | Estimate | S.E | C.R | P | ||
|---|---|---|---|---|---|---|
| Y | 🡨 | X1 | -0.136 | 0.171 | -1.107 | 0.00003 |
| Y | 🡨 | X2 | 0.867 | 0.258 | 5.889 | 0.00000 |
| Squared Multiple Correlation (SMC) | ||||||
| Y | 0.578 | |||||
The Squared Multiple Correlation (SMC) value for variable Y is 0.578, which indicates that approximately 57.8% of the variance in driving speed can be explained jointly by physical and mental fatigue. Since this value exceeds 50%, it can be concluded that the combined influence of both variables on driving speed is substantially strong.
The findings of this study suggest that physical fatigue tends to reduce a driver’s ability to maintain stable speed, whereas mental fatigue increases speed variability due to attentional lapses and decreased alertness. This demonstrates that fatigue is not solely a matter of physical exhaustion, but also a complex cognitive process that directly affects a driver’s capacity to control speed and respond appropriately to the driving environment.
This condition highlights that fatigue represents not only a decline in physical energy but also involves decision-making cognitive dysfunctions that impair vigilance, attention, and situational awareness. The deterioration of these mental faculties contributes to greater fluctuations in driving speed, thereby increasing the risk of traffic accidents.
Therefore, interventions aimed at reducing traffic accident risks must be taking into consideration for both physical and mental aspects of driver fatigue. A comprehensive and integrated approach is essential to enhance driver alertness, cognitive control, and the ability to maintain consistent vehicle operation across varying road conditions.
5. Discussions
This study examined the effects of physical and mental fatigue on driving speed behaviour along Banda Aceh–Medan Highway, emphasizing self-reported fatigue-related performance degradation under real-world driving conditions. The findings confirm that fatigue is a multidimensional phenomenon that affects driving behaviour through cognitive, physiological, temporal, and contextual mechanisms rather than through physical exhaustion alone.
An important dimension underlying both physical and mental fatigue in this study is biological sleepiness, which is closely related to circadian rhythm regulation and sleep homeostatic pressure. Indicators such as sleepiness after prolonged driving, eyelid spasms, delayed reactions, and difficulty maintaining attention reflect well-established manifestations of biologically driven fatigue (Van Dongen et al., 2003). These symptoms typically emerge during circadian low phases, particularly at night and in the early morning hours, when alertness and decision-making control are physiologically reduced.
Consistent with Valdez (2018), biological sleepiness diminishes tonic alertness and impairs sustained attention, thereby reducing drivers’ ability to continuously monitor speed. This mechanism explains why mental fatigue in the present study shows a stronger association with speed instability than physical fatigue. Rather than consciously choosing to speed, fatigued drivers may experience degraded speed perception and involuntary fluctuations in acceleration and deceleration, increasing accident risk (Williamson et al., 2011; Ma et al., 2018).
Although time-of-day effects were not modeled as a latent variable, they were captured descriptively through respondents’ reported travel periods (morning, afternoon, evening, night, and midnight). This constitutes a methodological limitation of the study, as temporal effects were not examined causally within the structural model. Nevertheless, this approach was adopted to preserve model parsimony within the SEM framework while still allowing meaningful contextual interpretation of fatigue accumulation.
The descriptive results indicate that professional drivers predominantly operate during nighttime hours and for extended durations, whereas non-professional drivers are more likely to travel during daytime periods with shorter driving durations. This temporal pattern aligns with previous research showing that nighttime driving substantially increases fatigue-related performance degradation due to circadian misalignment and accumulated sleep debt (Philip et al., 2005; Gunawardane & Dharmaratne, 2014).
Thus, while time of day was not treated as an explanatory construct in the structural model, its descriptive inclusion provides critical insight into when fatigue is most likely to impair driving speed behaviour, particularly among professional drivers. This supports earlier findings that fatigue-related crashes are disproportionately concentrated during nighttime and early morning hours (Fell & Black, 1997; WHO, 2023).
The study also highlights behavioural differences arising from different vehicle types, particularly between buses and passenger cars. Although Indonesian speed regulations are based on road classification rather than vehicle type, actual operating speeds and speed regulation behaviour differ due to vehicle mass, acceleration capability, manoeuvrability, and operational constraints.
Buses and freight vehicles generally exhibit slower acceleration and greater sensitivity to traffic flow and road geometry, which may amplify the effects of physical fatigue through prolonged postural strain and muscular discomfort (Alonso et al., 2016). In contrast, passenger cars allow greater flexibility and smoother speed maintenance, but this same flexibility may increase vulnerability to mental fatigue–induced speed variability, especially under monotonous driving conditions (May & Baldwin, 2009).
By focusing on self-reported speed regulation behaviour rather than absolute speed levels, this study isolates fatigue-related behavioural degradation that is comparable across vehicle types. This approach is consistent with prior research emphasizing that fatigue primarily affects how speed is controlled, rather than the nominal speed itself. However, it should be explicitly acknowledged as a limitation that this study focuses on a single long-distance corridor, namely Banda Aceh–Medan route. While the corridor represents a typical interprovincial travel context in Indonesia, the findings may not be fully generalizable to regions with different traffic patterns, road geometries, or socio-cultural driving characteristics.
As shown in Table 5, Individual differences play a significant role in fatigue development and behavioral response. The findings reveal that professional drivers tend to experience higher physical fatigue due to long working hours and nighttime operation, while non-professional drivers exhibit higher mental fatigue. This distinction is consistent with previous studies showing that professional drivers often develop chronic fatigue but may underestimate its severity due to habituation and experience-based coping strategies (Davidović et al., 2018; Peng et al., 2020) and greater susceptibility to acute cognitive fatigue among non-professional drivers (Anund et al., 2018).
Non-professional drivers, by contrast, are more susceptible to acute mental fatigue, which manifests rapidly as attentional lapses, delayed reactions, and unstable speed control (Anund et al., 2018; Mahajan & Velaga, 2022). These individual differences underscore the importance of distinguishing driver categories when assessing fatigue-related safety risks, rather than assuming homogeneous fatigue responses across populations.
Another important limitation, concerns the reliance on self-reported measures of fatigue and performance degradation. Although subjective fatigue assessments are widely used and have been shown to correlate with objective driving performance indicators, they remain susceptible to individual perception and reporting bias. This limitation implies that the results reflect perceived rather than directly observed driving behaviour.
In addition, external factors such as traffic density, weather conditions, and localized road surface characteristics were not explicitly controlled, which represents a further limitation of the study. These contextual variables may have influenced both perceived fatigue and speed regulation behaviour and should be considered in future research designs.
5.1 Relevance to mitigation strategies
Despite these limitations, the findings provide meaningful insights for fatigue mitigation strategies. First, the dominant role of mental fatigue highlights the need for interventions that target cognitive alertness, such as fatigue awareness training, scheduled rest breaks, and real-time fatigue monitoring systems based on behavioural indicators (May & Baldwin, 2009; Hou et al., 2024). Second, the descriptive time-of-day findings support targeted enforcement and policy measures during high-risk periods, particularly nighttime operations for professional drivers. These may include stricter driving-hour regulations, mandatory rest periods, and improved rest-area availability along long-distance corridors such as Banda Aceh–Medan.
Third, vehicle-specific considerations suggest that fatigue mitigation strategies should be tailored to operational contexts. For example, bus and freight operators may benefit from ergonomic interventions to reduce physical strain, while private vehicle users may require greater emphasis on recognizing early signs of mental fatigue and biological sleepiness.
Finally, the use of self-reported performance degradation measures provides a practical and scalable approach for fatigue assessment in regions where advanced monitoring technologies are not yet widely available. When combined with policy enforcement and infrastructure support, such measures can form an effective foundation for improving road safety in developing-region transport corridors.
6. Conclusions
This study emphasizes that driver fatigue both physical and mental plays a crucial role in influencing driving stability and performance. Fatigue is not merely a condition of reduced physical energy but also involves cognitive and psychological aspects that directly affect a driver’s ability to maintain concentration, alertness, and control over vehicle speed. Therefore, comprehensive management of driver fatigue is essential to minimize the risk of traffic accidents.
Based on the analysis and field findings, several recommendations can be proposed. Firstly, the implementation of a driver fatigue management system is necessary to detect early signs of fatigue through behavioural and physiological indicators such as eye movements, yawning frequency, or steering patterns. Secondly, optimization of work schedules and rest periods is crucial, particularly for professional drivers who operate for extended hours or during nighttime. Thirdly, training and awareness programs should be developed to help drivers recognize symptoms of fatigue and take preventive measures independently.
However, this study has several limitations that should be acknowledged. It has not yet been able to fully describe the causal relationship between fatigue and driving behaviour. Subsequently, some of the data were obtained through subjective self-assessments, which may have been influenced by individual perceptions of fatigue. Additionally, the study focused on a single travel corridor and a specific group of drivers, meaning the findings may not fully represent other regions or contexts. Additionally, external factors such as traffic density, weather conditions, and road quality were not directly controlled, which may have affected the measurements of fatigue and speed.
For future research, it is recommended to adopt a longitudinal or experimental approach to better understand the dynamics of fatigue over time. The use of objective measurement tools, such as heart rate sensors, eye-tracking devices, or electroencephalography (EEG), is also encouraged to improve the measurement accuracy of fatigue among drivers on the study corridor. Expanding the research to include a broader sample and more diverse driving conditions would strengthen the generalizability of the findings and provide a more robust scientific basis for future transportation safety policies.
Acknowledgment
We sincerely thank all the respondents who participated in this study for their valuable time and contributions that made this research possible.
Competing interests
The authors report no competing interests.
CRediT contribution
Yusria Darma: Conceptualization, Funding acquisition, Supervision, Writing—review & editing. Sofyan M Saleh: Methodology, Validation. Juliana Fisaini: Formal analysis, Project administration. Sugiarto Sugiarto: Software, Validation. Puteri Rezeki Saida: Data curation, Investigation, Software. Faiza Mauladea: Project administration, Visualization, Writing—original draft.
Data availability
The data are available on request to the authors.
Ethics
We confirm that the participants have been given the opportunity to ask questions about the research, and if there are questions they have been answered to the best of our ability so that they are willing to participate voluntarily and without coercion.
Funding
This research was funded by Universitas Syiah Kuala (Grant: 493/UN11.L1/PG.01.03/14873-PTNBH/2025).
Generative AI use in writing
During the preparation of this manuscript, the authors utilized ChatGPT (GPT-5 mini, OpenAI) to assist in drafting and refining the written content for clarity and coherence. The output was reviewed and revised by the authors, who take full responsibility for the content of the publication.
Prior dissemination
The authors declare that this work is original and has not been previously published or presented.
Editorial information
Handling editor: Sonja Forward, The Swedish National Road and Transport Research Institute (VTI), Sweden.
Reviewer: Anna Anund, The Swedish National Road and Transport Research Institute (VTI), Sweden.
Submitted: 8 November 2025; Accepted: 2 March 2026; Published: 13 March 2026.