Prevalence of drink driving in road traffic in Denmark
Abstract
Driving under the influence of alcohol (DUI) is among the riskiest traffic behaviours road users can conduct. To combat drink driving, clarifying its prevalence is paramount. The objective of this study is to map DUI prevalence in Denmark and separate DUI prevalence into geography (police districts), time of day and day of the week, gender and road user modes. In April 2018 to December 2019, 116,378 DUI breath test samples were taken in all (12) Danish police districts. For each sample, road user mode, gender, age was recorded, and the road user was screened for breath alcohol concentration (BrAC). All road users subject to the legal blood alcohol content (BAC) limit of 0.5 g/L were included in the study, i.e. drivers of passenger cars, vans, lorries, buses, motorcycles, tractors and mopeds. DUI prevalence for drivers “on wheels” was compared to DUI prevalence for drivers in injury accidents (IA). Overall DUI prevalence was 0.18% (95% CI: 0.16%–0.21%). Significantly more male than female drivers were DUI (0.23% (95% CI: 0.19%–0.26%) and 0.09% (95% CI: 0.06%–0.12%), respectively). DUI prevalence in injury accidents was disproportionately high in the younger age groups and decreasing with age, suggesting higher BACs and/or a higher accident risk. Moped riders had a significantly higher DUI prevalence (2.87%) than any other road user group. Moreover, the share of DUI injury accidents including moped riders was disproportionately high (23.0%) compared to their share of traffic (0.5%).
1. Introduction
About 20,000 road users are killed annually in the European Union (EU 2024). It has been estimated that about 25% of the road fatalities are alcohol-related (EC 2018). This results in about 5,000 road users getting killed annually in alcohol-related accidents.
In Denmark, according to official statistics about 1,850 road users are killed or severely injured each year (Statistics Denmark 2025). Of these, about 10% are involved in alcohol-related accidents. The more severe the accident is, the higher the alcohol involvement; thus, about 20% of road deaths occur in alcohol-related accidents.
Driving under the influence of alcohol (DUI) is among the riskiest traffic behaviors road users can conduct. The elevated accident risk has been widely documented in the literature (Elvik et al. 2019, Høye & Hesjevoll 2023). The documentation includes studies with epidemiological design from the Grand Rapids study (Borkenstein et al. 1974) to the EU integrated research project DRUID (Hels et al. 2013) as well as experimental studies (reviewed by Krüger et al. (1993), Schnabel et al. (2010)) and reviews of driving performance (Dong et al. 2024). Drinking alcohol has an effect on a wide variety of physiological and psychological functions. The review by Schnabel et al. (2010) mentions eight driving performance categories including reaction time, psychomotor skills and visual function. Moreover, Schnabel et al. (2010) report effects such as subjective feelings of fatigue and intoxication. Impairment of the various functions begins at different BAC levels and increases with different patterns: at low BACs (up to 0.4-0.5 g/L), psychomotor functions are more impaired than cognitive functions, and performance in simple tasks is less impaired than in complex tasks. General objective impairment, i.e., all performance categories together, however, increase linearly with BAC (within the interval 0.01 to 0.12 g/L).
Studies with epidemiological design report significantly elevated risk from a BAC of about 0.5 g/L and upwards (Borkenstein et al. 1974, Hels et al. 2013). Even though some functions are impaired at a lower concentration, road users are probably able to compensate, but only up to a certain level (Schnabel et al. 2010). The shape of the impairment function with increasing BAC varies individually with e.g. age, gender (Hels 2013) and drinking habits (Schnabel et al. 2010).
In Denmark, until 1976 there was no legal blood alcohol limit, but the driver must not have “consumed alcohol to such an extent that he is unable to operate the vehicle in a fully safe manner” (Journal of the Danish Parliament 2026). The driver could be subjected to a clinical examination, and it was up to a court to determine whether the driver was under the influence. Since 1976, Denmark has had a firm legal BAC limit when driving a motorized vehicle. In 1976, the limit was set to 0.8 g/L; in 1998, the limit was lowered to 0.5 g/L. This is higher than for our Scandinavian neighbours: Sweden and Norway both have legal limits of 0.2 g/L. In Germany – as in Denmark and most other western European countries – the legal limit is 0.5 g/L.
The purpose of the present study is:
-
to clarify overall DUI prevalence among motor vehicle drivers in Denmark,
-
to follow up on the previous roadside surveys in order to shed light on developments (DUI prevalence in Denmark was recorded in previous roadside surveys in 2007/2008 (0.48%, N = 3,002, 95% CI: 0.23%–0.73%, Hels et al. 2011) and in 1985–1987 (1.14%, N = 60,539, 95% CI: 1.06%–1.22%, Behrensdorff et al. 1989)) and, more generally, to gain a better understanding of the prevalence of drink driving,
-
to provide knowledge about where and when enforcement of drink driving is most important.
In order to combat drink driving clarifying its prevalence is paramount. In this paper, drink driving prevalence in Denmark is mapped geographically through representative sampling all over the country. Moreover, DUI prevalence is separated into time of day and day of the week, gender, road type and road user modes.
2. Materials and methods
In April 2018 to December 2019, a roadside survey of DUI prevalence was conducted: 116,378 DUI breath test samples were taken in all (12) police districts of Denmark. The fraction of samples in each police district was planned from an algorithm that weighted three factors equally: the number of inhabitants in the police district (weight 33%, Statistics Denmark 2018), transport work (km) in the police district (weight 33%, Transport DTU 2016) and number of injured road users in DUI accidents 2012–2016 in the police district (weight 33%, The Danish Road Directorate 2018) (Table 1). Thus, the planned fraction of samples in e.g. North Jutland was (0.09*0.33 + 0.10*0.33 + 0.16*0.33) = 0.12.
In the study design, the distribution of samples by road type, time of day, day of the week, and month was planned on the basis of the distribution of traffic.
This information was found in the “Mastra” database, which contains data from all traffic counting stations operated by The Danish Road Directorate, as well as corresponding data from most municipalities (The Danish Road Directorate 2025a). Traffic distribution by road type was given directly, whereas for distribution by time, data were extracted from a number of permanent counting stations, distributed across the road types used and weighted in accordance with the distribution of traffic by road type. Hourly extracts were then produced covering an entire year. This then allowed the distribution of traffic by month, day of the week, and hour to be calculated.
Details of sample distribution are found in Appendix tables A1 to A4. The distribution of samples in the various strata was supposed to mirror the distribution of actual vehicle kilometers driven. Thus, the overall sample was supposed to be representative for Danish traffic. Eventually, the overall sample turned out to be oversampled for urban roads and undersampled for rural roads and motorways. This skewness was accounted for by weighting the results with the weighting factors presented in Table A1.
| Police district | Population | Population fraction | Yearly transport work mio. km/year | Fraction of transport work | Injured in DUI accidents 2012-2016 | Fraction of injured | Planned fraction of samples | Actual fraction of samples | Actual number of samples |
|---|---|---|---|---|---|---|---|---|---|
| North Jutland | 524 660 | 9% | 4 761 | 10% | 350 | 16% | 12% | 12% | 13 480 |
| East Jutland | 593 651 | 10% | 4 322 | 9% | 175 | 8% | 9% | 9% | 9 935 |
| Central and West Jutland | 586 365 | 10% | 5 421 | 11% | 342 | 15% | 12% | 12% | 13 389 |
| South East Jutland | 481 389 | 8% | 5 740 | 12% | 155 | 7% | 9% | 12% | 14165 |
| South Jutland | 440 095 | 8% | 4 144 | 9% | 174 | 8% | 8% | 7% | 8118 |
| Funen | 496 093 | 9% | 4 344 | 9% | 239 | 11% | 9% | 9% | 10 271 |
| South Zealand and Lolland-Falster | 376 976 | 7% | 4 199 | 9% | 184 | 8% | 8% | 7% | 8 393 |
| Central and West Zealand | 457 764 | 8% | 5 182 | 11% | 151 | 7% | 9% | 8% | 9 832 |
| North Zealand | 593 498 | 10% | 3 637 | 8% | 118 | 5% | 8% | 7% | 8 001 |
| Western Copenhagen | 414 049 | 7% | 3 424 | 7% | 96 | 4% | 6% | 5% | 6 180 |
| Copenhagen | 774 312 | 13% | 1 730 | 4% | 214 | 10% | 9% | 11% | 13 378 |
| Bornholm | 39 718 | 1% | 268 | 1% | 28 | 1% | 1% | 1% | 1 236 |
| Total | 5 778 570 | 100% | 47 172 | 100% | 2 226 | 100% | 100% | 100% | 116 378 |
Within each stratum, samples were taken randomly: During a session, all passing drivers were to be waved in. When there was no longer sufficient space/capacity at the site, no further drivers were to be waved in for a breath test. Breath samples were collected by the police. In Denmark, the police have a legal authority to require samples from all road users regardless of suspicion of DUI. Breath samples were taken with Lion Alcometer 700 or Alco Sensor FST. Samples were taken in two steps: Initial breath screening outcome (N = 116,378) was either “negative” (no alcohol detected in the breath, N = 114,390) or “positive” (any alcohol detected in breath, N = 1,988). In case of a negative breath screening outcome, no further test was conducted. In case of a positive screening outcome, a more precise breath test was subsequently conducted with one of the two alcometers mentioned above and the reading converted by the police officer from breath alcohol concentration (mg/L) to blood alcohol concentration (BAC, g/L) by multiplying breath alcohol concentration by 2,000. In case of a BAC indication below or at 0.5 g/L, no further test was conducted, and the indicated BAC was noted (listed as “Positive ≤ 0.5 g/L” in the tables). If the driver showed an indication of an illegal alcohol concentration (i.e., BrAC above 0.25 corresponding to BAC above 0.5 g/L), the study protocol was marked “case”, and the usual legal procedure was followed: the driver was charged with drink driving and taken into custody of the police to a medical doctor for a blood sample. The alcohol concentration in the blood sample formed the basis for the DUI charge and was noted by the police in the police record. In a subsequent step, the blood sample alcohol concentration was transferred to the data set. This was done for each case individually by researchers who identified the individual driver by police district, date, time, driver gender, age and transport mode.
For each sample, the following data were recorded in the survey protocol by the police at the roadside: date and time, police district, road type, road user mode, gender, age. All road users subject to the legal BAC limit of 0.5 g/L in the Road Traffic Act (§53) were included in the study, i.e., drivers of passenger vehicles, vans, lorries, buses, motorcycles, tractors and mopeds. Definitions of the road user categories can be found in Retsinformation (2024) and The Danish Road Directorate (2017). The survey protocol was filled out by the police on paper and subsequently digitalized by a professional firm. The final data set was set up by researchers.
DUI prevalence for drivers “on wheels” was compared to police recorded DUI personal injury alcohol-related accidents in the period July 2018 to June 2019. Out of the 116,378 samples included in the study, 102,048 samples were taken in the period July 2018 to June 2019 (= 88%). Therefore, this data period was selected for the accident data.
For a risk of 1.00, DUI prevalence for a group of drivers “on wheels” will be similar to the fraction of drivers in injury accidents DUI for the same group. For an elevated risk in a group of drivers, the fraction of drivers in injury accidents DUI will be higher. The higher the risk, the higher the fraction of DUI accidents relative to the prevalence “on wheels”.
The definition of injury accident followed The Danish Road Directorate (2025b): “A road accident where there is at least one personal injury: Injury is a condition that typically requires treatment by a physician or dentist, or that has resulted in hospitalization, including admission for observation”. Alcohol-related accidents were accidents in which the driver was measured with a blood alcohol concentration above 0.5 g/L, or where the police assessed that the driver was under the influence of alcohol (The Danish Road Directorate 2025b). In injury accidents, it is standard police procedure to assess whether the driver is under the influence of alcohol or other psychoactive substances. Where suspicion arises, a blood sample is typically taken.
The number of alcohol-related and non-alcohol-related injury accidents by gender, driver age, driver mode, and time is displayed in the Appendix, tables B1 through B4.
Prevalence of roadside survey DUI in the various transport modes was compared with the fraction of alcohol-related injury accidents in the total number of injury accidents. Any excess occurrence in the accident data relative to the roadside survey indicates an increased risk of having an accident when driving under the influence of alcohol.
95%–confidence limits for DUI prevalence were calculated according to Statology (2025). Non-overlapping 95%–confidence limits were considered significantly different at 5% level.
The BAC–levels for different age groups were tested for significance with an ANOVA–test (SAS software 9.4).
3. Results
Out of the 116,378 samples in the prevalence study, 235 drivers (weighted: 210.35) had a BAC above the legal limit of 0.5 g/L, corresponding to DUI in 0.2% of the drivers (weighted: 0.18%, Table 2).
The prevalence of drivers with a BAC above the legal limit was lowest in the police district Copenhagen (0.08%) and Western Copenhagen (0.07%); significantly lower than the overall prevalence (Table 2). The highest prevalence was found in the police district Bornholm (0.59%); however, the confidence interval is wide because of a relatively small sample size.
Significantly more male than female drivers had a BAC above the legal limit (Table 3). The difference in male/female fraction of injury accidents involving DUI was significant as well (cf. Table B1, 6.7% and 2.0%, respectively, Χ2 = 35.7, df = 1, P<0.0001).
| Police district | Total number of samples | Weighted number of samples | Positive ≤0.5 g/L | >0.5 g/L | 95% CI | Prevalence >1.0 g/L |
|---|---|---|---|---|---|---|
| North Jutland | 13 480 | 13 113.03 | 155.20 (1.18%) | 26.34 (0.20%) | 0.12%–0.28% | 15.68 (0.12%) |
| East Jutland | 9 935 | 11 131.71 | 110.61 (0.99%) | 17.85 (0.16%) | 0.09%–0.23% | 6.89 (0.06%) |
| Central and West Jutland | 13 389 | 13 680.69 | 297.17 (2.17%) | 39.58 (0.29%) | 0.20%–0.38% | 22.13 (0.16%) |
| South East Jutland | 14 165 | 14 762.97 | 194.34 (1.32%) | 28.11 (0.19%) | 0.12%–0.26% | 10.86 (0.07%) |
| South Jutland | 8 118 | 9 680.74 | 88.94 (0.92%) | 10.72 (0.11%) | 0.04%–0.18% | 3.37 (0.03%) |
| Funen | 10 271 | 10 451.59 | 236.35 (2.26%) | 17.34 (0.17%) | 0.09%–0.24% | 8.84 (0.08%) |
| South Zealand and Lolland-Falster | 8 393 | 9 610.78 | 131.35 (1.37%) | 13.68 (0.14%) | 0.07%–0.22% | 9.46 (0.10%) |
| Central and West Zealand | 9 832 | 11 579.68 | 156.12 (1.35%) | 22.79 (0.20%) | 0.12%–0.28% | 6.79 (0.06%) |
| North Zealand | 8 001 | 8 623.71 | 85.96 (1.00%) | 18.76 (0.22%) | 0.12%–0.32% | 9.91 (0.11%) |
| Western Copenhagen | 6 180 | 5 603.68 | 75.51 (1.35%) | 3.72 (0.07%) | 0.00%–0.13% | 2.36 (0.04%) |
| Copenhagen | 13 378 | 7 211.95 | 65.38 (0.91%) | 5.98 (0.08%) | 0.02%–0.15% | 1.35 (0.02%) |
| Bornholm | 1 236 | 927.48 | 22.87 (2.47%) | 5.48 (0.59%) | 0.10%–1.08% | 0.45 (0.05%) |
| Total | 116 378 | 116 378 | 1 619.80 (1.39%) | 210.35 (0.18%) | 0.16%–0.21% | 98.10 (0.08%) |
| Gender | Total number of samples | Weighted number of samples | Positive ≤0.5 g/L | >0.5 g/L | 95% CI | Prevalence >1.0 g/L |
|---|---|---|---|---|---|---|
| Female | 36 634 | 36 558.83 | 178.01 (0.49%) | 32.37 (0.09%) | 0.06%–0.12% | 13.42 (0.04%) |
| Male | 78 393 | 78 430.10 | 1 422.02 (1.81%) | 177.98 (0.23%) | 0.19%–0.26% | 84.68 (0.11%) |
| Unknown | 1 351 | 1389.07 | 19.76 (1.42%) | 0 (0.00%) | – | 0 (0.00%) |
| Age group (years) | ||||||
| 15-17 | 221 | 188.30 | 0.90 (0.48%) | 0 (0.00%) | 0.00%–0.00% | 0 (0.00%) |
| 18-24 | 9 137 | 8 718.40 | 105.97 (1.22%) | 10.91 (0.13%) | 0.05%–0.20% | 4.32 (0.05%) |
| 25-44 | 42 078 | 41 928.75 | 467.39 (1.11%) | 52.84 (0.13%) | 0.09%–0.16% | 25.89 (0.06%) |
| 45-64 | 47 851 | 48 453.38 | 751.08 (1.55%) | 117.37 (0.24%) | 0.20%–0.29% | 54.96 (0.11%) |
| 65-74 | 12 541 | 12 627.16 | 226.17 (1.79%) | 27.51 (0.22%) | 0.14%–0.30% | 12.93 (0.10%) |
| 75+ | 4 532 | 4 444.39 | 68.29 (1.54%) | 1.71 (0.04%) | 0.00%–0.10% | 0 (0.00%) |
| Unknown | 18 | 17.60 | 0 (0.00%) | 0 (0.00%) | 0.00%–0.00% | 0 (0.00%) |
| Road type | ||||||
| Urban road | 43 810 | 19 784.26 | 358.56 (1.81%) | 51.48 (0.26%) | 0.19%–0.33% | 27.55 (0.14%) |
| Rural road | 46 257 | 58 189.00 | 864.21 (1.49%) | 110.70 (0.19%) | 0.15%–0.23% | 51.58 (0.09%) |
| Motorway | 26 311 | 38 404.74 | 397.02 (1.03%) | 48.17 (0.13%) | 0.09%–0.16% | 18.98 (0.05%) |
| Total | 116 378 | 116 378 | 1 619.80 (1.39%) | 210.35 (0.18%) | 0.16%–0.21% | 98.10 (0.08%) |
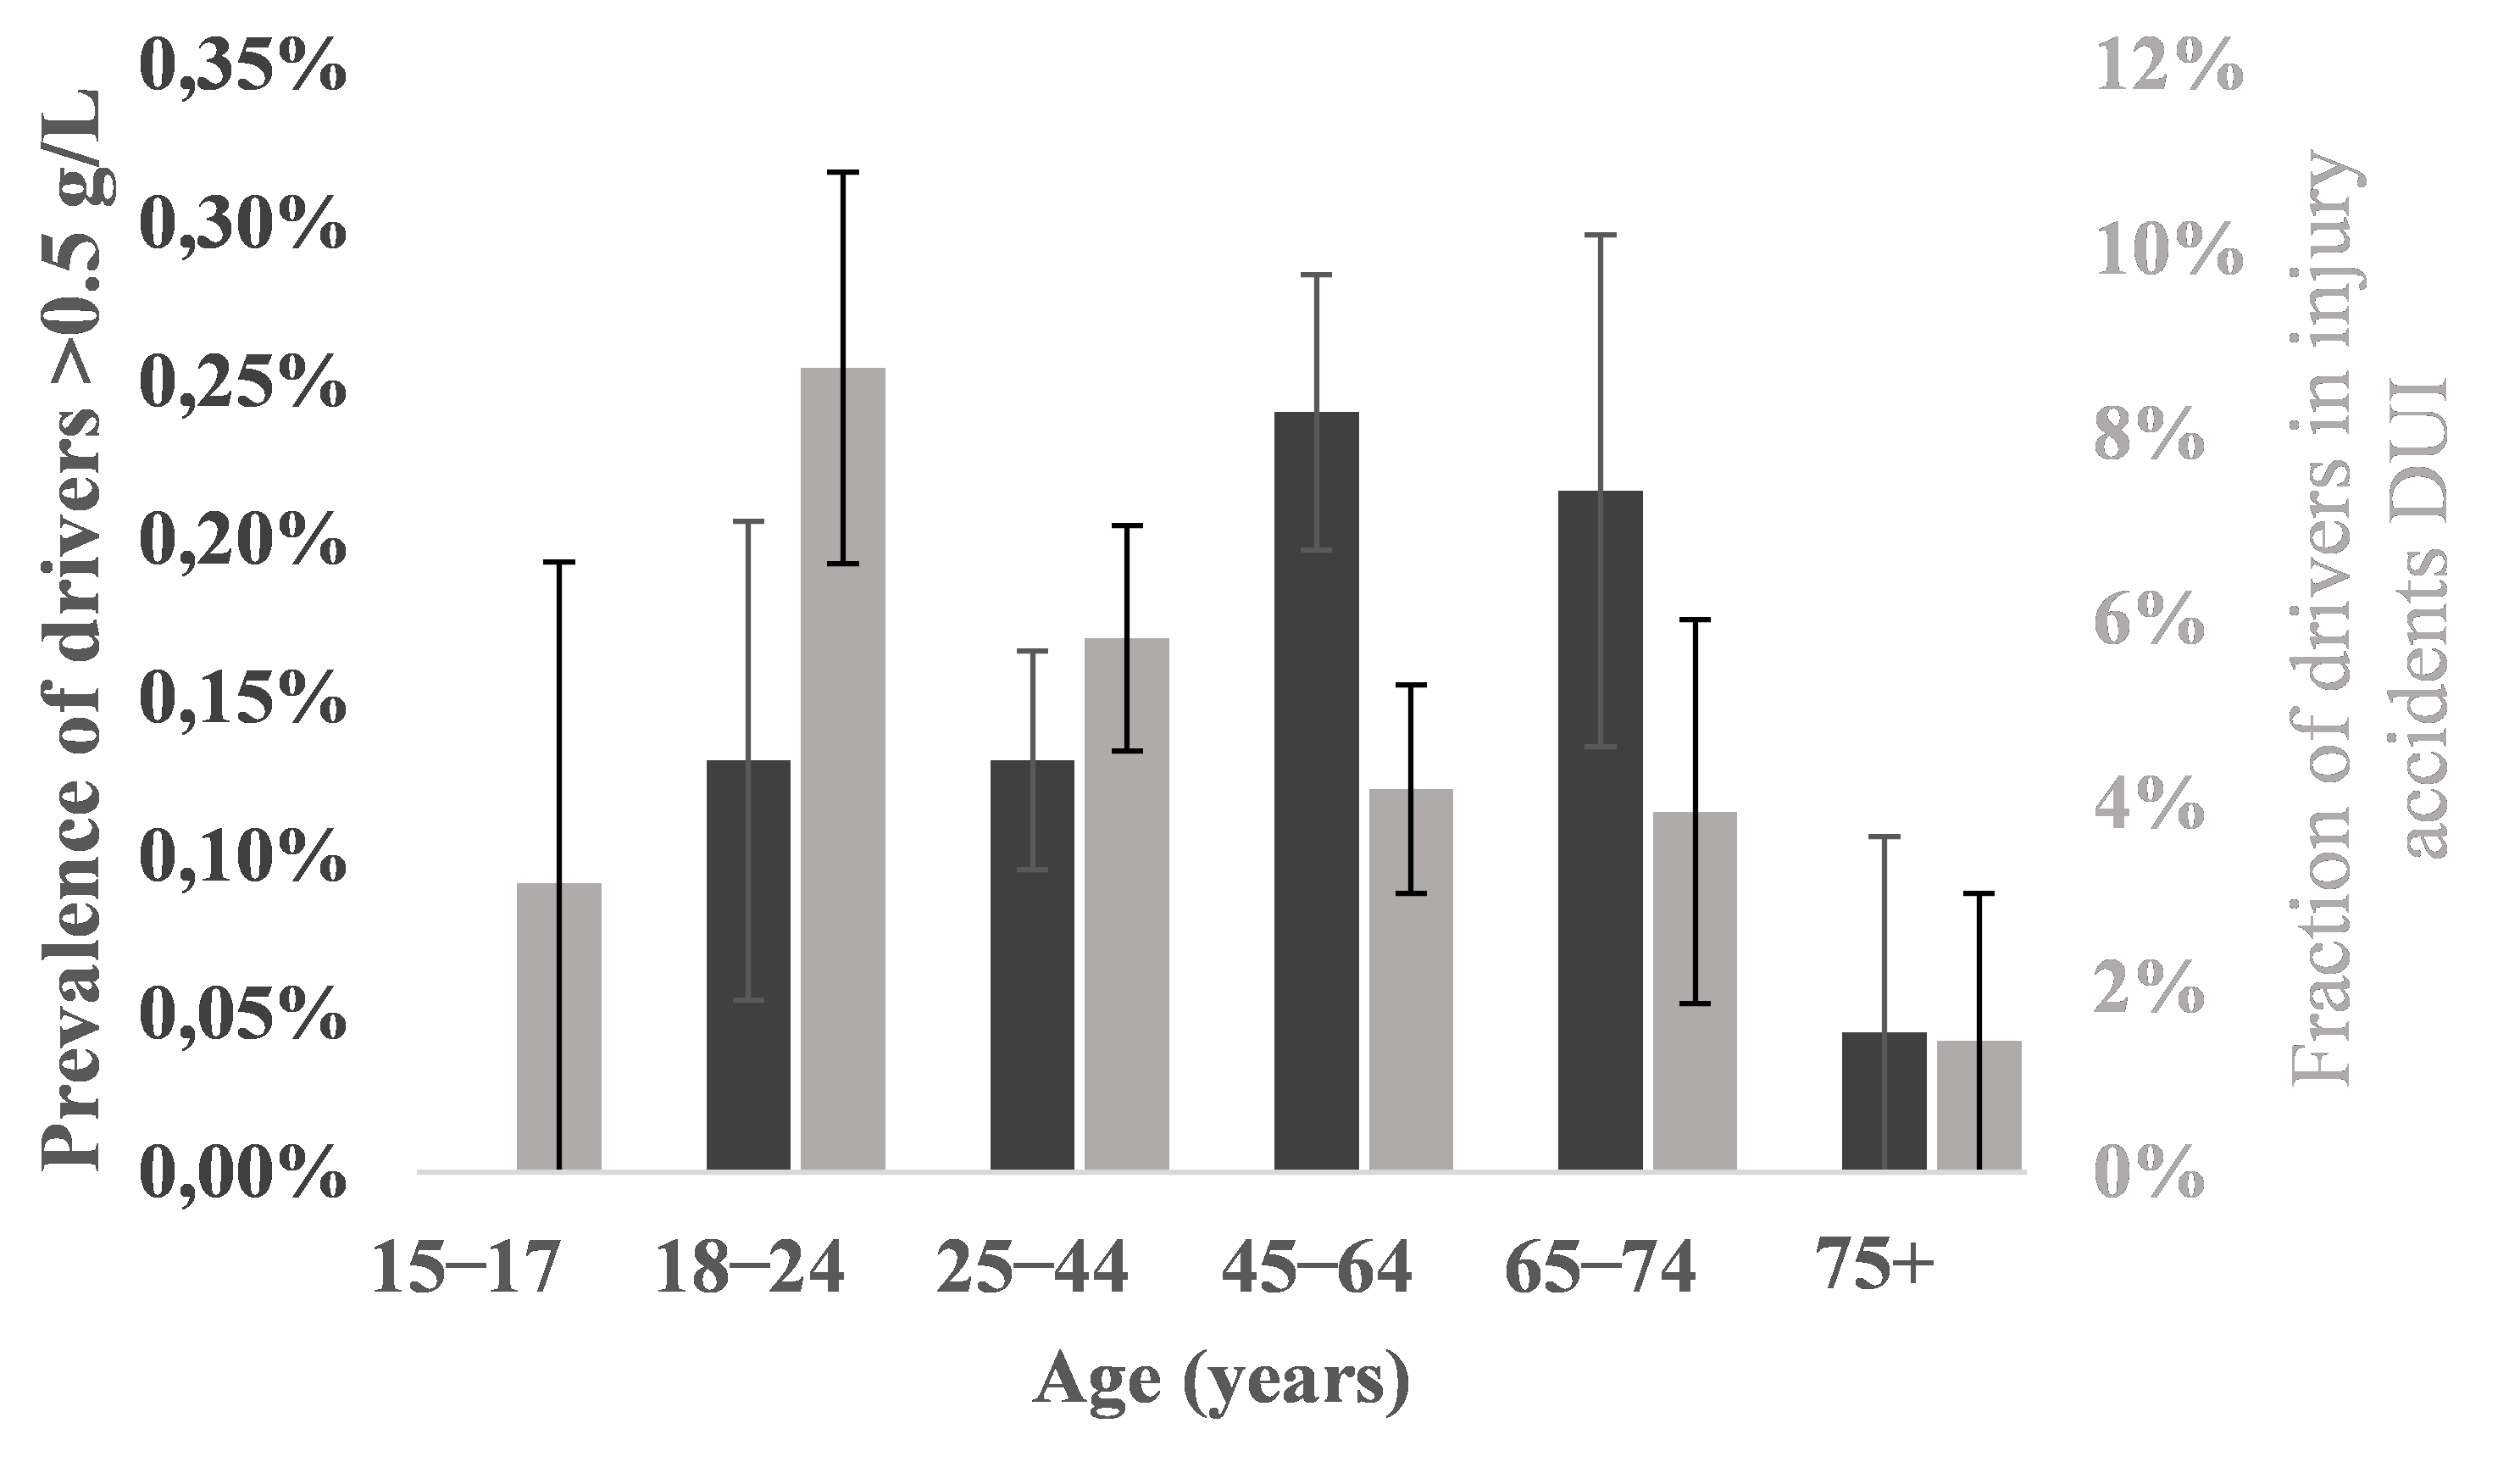
Middle-aged drivers (aged 45–64 and 65–74) represented the groups with the highest DUI prevalence, including prevalence of BACs above 1.0 g/L (Table 3, Figure 1); thus, DUI prevalence in the 45–64 years of age group was significantly higher than DUI prevalence in the groups 15–17, 25–44 and 75+. Fraction of DUI injury accidents was disproportionately high in the younger age groups, especially drivers aged 18-24 and disproportionately low in age groups 45–64 and 65–74 (Figure 1, Table B2). This higher value of the coarse risk measure could be due to higher BACs in the younger age groups. There was no significant difference, however, in any of the age group BAC-levels (weighted data, ANOVA, N = 235, df = 4, P < 0.72).
DUI prevalence in urban roads was significantly higher than in motorways and insignificantly higher than in rural roads (Table 3). Urban roads also had the highest prevalence of BACs above 1.0 g/L (0.14%).
Moped riders had a significantly higher DUI prevalence (2.87%), including prevalence of BACs above 1.0 g/L (1.85%), than any other road user group (Table 4). The DUI prevalence of moped riders was 19 times that of drivers of passenger cars. Moreover, the share of DUI injury accidents including moped riders was disproportionately high (23.0%) compared to their share of traffic (0.5%, Table 4) which was also the case for motorcycles, although to a lesser extent (6.7% and 0.7%, respectively). DUI prevalence of drivers of vans was significantly higher than that of drivers of passenger cars, yet their share of DUI injury accidents was considerably lower (i.e., 7.2%) than their share of traffic (14.8%).
| Transport mode | Total number of samples | Weighted number of samples | Positive ≤0.5 g/L | >0.5 g/L | 95% CI | Share of traffic (n=116 378) | Share of DUI IA (n=209) | Prevalence >1.0 g/L |
|---|---|---|---|---|---|---|---|---|
| Passenger car | 94 226 | 93 228.66 | 1 143.30 (1.23%) | 141.85 (0.15%) | 0.13%–0.18% | 80.1% | 61.2% | 61.99 (0.07%) |
| Van | 16 655 | 17 270.58 | 402.23 (2.33%) | 52.12 (0.30%) | 0.22%–0.38% | 14.8% | 7.2% | 25.85 (0.15%) |
| Truck | 2 765 | 3 303.59 | 10.97 (0.33%) | 0 (0.00%) | 0.00%–0.00% | 2.8% | 0.0% | 0 (0.00%) |
| Bus | 557 | 551.72 | 0.45 (0.08%) | 0 (0.00%) | 0.00%–0.00% | 0.5% | 0.0% | 0 (0.00%) |
| Motorcycle | 783 | 760.01 | 11.22 (1.48%) | 0.45 (0.06%) | 0.00%-0.23% | 0.7% | 6.7% | 0 (0.00%) |
| Moped | 686 | 554.93 | 45.04 (8.12%) | 15.93 (2.87%) | 1.48%–4.26% | 0.5% | 23.0% | 10.26 (1.85%) |
| Tractor | 209 | 204.85 | 171 (0.83%) | 0 (0.00%) | 0.00%–0.00% | 0.2% | 0% | 0 (0.00%) |
| Other/no info | 497 | 503.66 | 488 (0.97%) | 0 (0.00%) | 0.00%–0.00% | 0.4% | 1.9% | 0 (0.00%) |
| Total | 116 378 | 116 378 | 1 619.80 (1.39%) | 210.35 (0.18%) | 0.16%–0.21% | 100.0% | 100.0% | 98.10 (0.08%) |
DUI prevalence was significantly higher in the evening and the night (16:00–03:59) than in the morning (04:00–09:59, Table 5). The night’s (22:00–03:59) prevalence of BACs above 1.0 g/L was the highest, and the share of DUI injury accidents was disproportionately high, i.e., 29.2%, despite the fact that the weighted share of DUI samples in the same period (mirroring the share of traffic) made up only 5.85%. Contrarily, the day’s share (10:00–15:59) of DUI IAs was disproportionately low, i.e., 17.2%, compared to the share of DUI samples (42.46%).
| Time of day | Total number of samples | Weighted number of samples | Positive ≤0.5 g/L | >0.5 g/L | 95% CI | Share of samples (n=116 378) | Share of DUI IA (n=209) | Prevalence >1.0 g/L |
|---|---|---|---|---|---|---|---|---|
| 04:00-09:59 | 25 891 | 26 454.53 | 203.72 (0.77%) | 32.34 (0.12%) | 0.08%–0.16% | 22.73% | 16.3% | 17.95 (0.07%) |
| 10:00-15:59 | 47 851 | 49 409.04 | 636.29 (1.29%) | 77.31 (0.16%) | 0.12%–0.19% | 42.46% | 17.2% | 30.68 (0.06%) |
| 16:00-21:59 | 35 608 | 33 711.65 | 643.26 (1.91%) | 78.43 (0.23%) | 0.18%–0.28% | 28.97% | 37.3% | 37.60 (0.11%) |
| 22:00-03:59 | 7 028 | 6 802.78 | 136.53 (2.01%) | 22.27 (0.33%) | 0.19%–0.46% | 5.85% | 29.2% | 11.86 (0.17%) |
| Day of week | ||||||||
| Monday | 16 337 | 16 659.70 | 201.31 (1.21%) | 25.40 (0.15%) | 0.09%–0.21% | 14.32% | 7.66% | 9.31 (0.06%) |
| Tuesday | 17 672 | 18 191.88 | 214.32 (1.18%) | 26.76 (0.15%) | 0.09%–0.20% | 15.63% | 10.05% | 13.07 (0.07%) |
| Wednesday | 18 964 | 19 388.56 | 241.60 (1.25%) | 24.99 (0.13%) | 0.08%–0.18% | 16.66% | 6.22% | 14.23 (0.07%) |
| Thursday | 19 250 | 19 614.21 | 252.05 (1.29%) | 28.36 (0.14%) | 0.09%–0.20% | 16.85% | 11.96% | 14.28 (0.07%) |
| Friday | 18 177 | 17 115.82 | 298.39 (1.74%) | 38.72 (0.23%) | 0.16%–0.30% | 14.71% | 22.49% | 16.24 (0.09%) |
| Saturday | 13 491 | 13 340.27 | 256.25 (1.92%) | 35.10 (0.26%) | 0.18%–0.35% | 11.46% | 25.36% | 17.24 (0.13%) |
| Sunday | 12 487 | 12 067.57 | 155.89 (1.29%) | 31.02 (0.26%) | 0.17%–0.35% | 10.37% | 16.27% | 13.72 (0.11%) |
| Total | 116 378 | 116 378 | 1 619.80 (1.39%) | 210.35 (0.18%) | 0.16%–0.21% | 100.0% | 100.0% | 98.10 (0.08%) |
DUI was most frequent on the weekend: Friday (0.23%), Saturday (0.26%), and Sunday (0.26%). These three days also had the highest prevalence of BACs above 1.0 g/L and a disproportionately high share of injury accidents compared to their share of the weighted samples.
4. Discussion
The overall prevalence of DUI in this roadside survey was 0.18% (95% CI: 0.16%–0.21%). This is significantly lower than the prevalence recorded in a roadside survey in 2007/2008 (0.48%, N = 3,002, 95% CI: 0.23%–0.73%, Hels et al. 2011), which is again significantly lower than prevalence in 1985–1987 (roadside survey, 1.14%, N = 60,539, 95% CI: 1.06%–1.22%, Behrensdorff et al. (1989)). All three studies were roadside surveys, in which the prevalence of DUI was estimated based on breath tests administered by the police and blood samples taken by physicians. In alle three studies, participation was mandatory. In the present study, the number of samples was higher than in the previous studies; this is reflected in the narrow confidence interval. The results are comparable, and it can be concluded that DUI has decreased significantly in Denmark over the years.
In general, the study design was set up so that the number of samples in the various strata mirrored the distribution of vehicle kilometers driven on the roads. Thus, the overall sample was designed to be representative for Danish traffic as a whole. The distribution of samples fitted the design well except for the road type stratum where urban roads were oversampled and highways and motorways undersampled. This sampling skewness was corrected by weighting the results. Thus, it is fair to assume that the weighted samples and the results were representative of the traffic.
DUI prevalence in injury accidents in Denmark is in principle dependent on the police’s suspicion. Although this is the case, the level of underreporting is presumably quite modest (Central and West Zealand Police District, pers. com.) This is supported by the police’s strong ability to identify impaired drivers. During the study period, approximately 116,378 randomly selected road users were stopped over a period of 1.5 years. 205 (weighted number: 210.35) of these had an illegal BAC. In the same period, the police initiated approximately 10,000 cases of drink driving (based on illegal blood alcohol concentration). All of these cases were identified on the basis of suspicion (with the exception of the 200+ from the study). Although underreporting is modest, it is nevertheless unlikely that the coverage of DUI in injury accidents is 100%. A small residual level of underreporting is unlikely to have any material impact on the conclusions regarding risk in the present article.
Rasmussen (2018) documents based on a review of existing literature that throughout the years, DUI has become less socially acceptable in Denmark. This is most likely the primary reason for the decrease in DUI. It might be hypothesized that the reduction of the legal blood alcohol concentration limit in 1998 from 0.8 g/L to 0.5 g/L would have led to an increase in DUI, as levels that were previously permissible became unlawful. However, the opposite has occurred. One possible explanation is that drivers may have over adjusted to the new legislation by reducing prevalence of alcohol-impaired driving.
In Norway, Gjerde et al. (2013) recorded in a roadside survey a DUI prevalence of 0.2% above 0.2 g/L in 2008–2009. This result was repeated in 2016–2017 in a follow-up roadside survey (Furuhaugen et al. 2018). The legal limit of DUI in Norway is 0.2 g/L, and since DUI prevalence above 0.2 g/L was 0.2%, DUI prevalence above 0.5 g/L has most likely been lower.
In 2007–2009, average DUI prevalence (any concentration above cut off limit 0.1 g/L) in Europe was estimated in roadside surveys at 3.5% in the DRUID project (DRiving Under the Influence of Drugs, alcohol and medicine). Denmark was among the countries with a DUI prevalence below European average (together with Norway, Finland, The Netherlands, Poland, Czech Republic, Hungary) while Lithuania and Spain had a European average DUI prevalence, and Belgium, Portugal and Italy had above average DUI prevalence (Houwing et al. 2011). In 2022, ETSC estimated that 1.5–2% of kilometers travelled in the EU are driven with an illegal blood alcohol concentration (ETSC 2022). The results of the present study indicate that DUI prevalence in Denmark is about one tenth of that.
In the US (legal limit: 0.8 g/L), DUI is (self)reported somewhat higher, albeit decreasing: 11.8% in 2012–2014, and 8.5% in 2016–2017 (Oh et al. 2020).
In a survey questionnaire on self-reported behaviour, 15.4% of the car drivers in Europe, 17.5% in America, and 11.3% in Asia/Oceania declared to have been driving after drinking alcohol at least once in the last 30 days (Meesmann et al. 2024).
Relatively high prevalence is reported from other parts of the world, e.g., Bhutan (roadside survey, 4.2% of 1,596 drivers above the legal limit of 0.8 g/L, Tenzin et al. 2020), Ghana (roadside survey, 6% of 789 drivers above the legal limit of 0.8 g/L, Damsere-Derry et al. 2016) and Australia (13% of recent drinkers (self)reported DUI in 2010, Matthews et al. 2014). Measured prevalence for DUI depends heavily on the method chosen and the questioning technique. Even among roadside surveys, it is clear that DUI prevalence in Denmark is well below average—in Europe as well as in the rest of the world.
One geographical pattern was clear: Copenhagen and Western Copenhagen had the lowest prevalence of DUI (0.08% and 0.07%, respectively). We speculate that this could be because the network of public transport is dense, so when going home from a(n) (social) event including alcohol, going by public transport is convenient. Thus, the DUI motivation could be lower in Copenhagen, and this could be reflected in low DUI prevalence. Jackson and Owens (2011) found a similar pattern in Washington DC, USA: Areas where bars were within walking distance to transit stations experienced decreases in DUI arrests. We expected the same pattern in other large towns in Denmark (Aarhus (East Jutland), Odense (Funen), Aalborg (North Jutland)), but the pattern was not consistent. This may be because the police district of Copenhagen consists exclusively of the city whereas the districts of East Jutland, Funen and North Jutland comprise both urban and rural areas.
The results revealed a significant DUI prevalence gender and age difference: Male DUI was significantly more prevalent as female DUI. It is well known that the typical DUI offender is a male driver. Thus, results from the DRUID project revealed that in 11 out of 12 participating European countries, male DUI was more prevalent than female DUI. In most of these countries, including Denmark, the difference was very large. Only in Italy, female DUI was more prevalent than male DUI (Houwing et al. 2011). In the Danish prevalence survey from 1985-1987, male DUI prevalence above 0.5 g/L was 1.45%, female DUI prevalence was 0.24% (Behrensdorff et al. 1989). DUI is a typical road traffic risk taking activity. Sagberg et al. (2015) conclude based on a thorough review of the literature that “existing studies indicate a general tendency for men to adopt a riskier driving style than women”. The authors explain this partly by innate biological factors and partly by sociocultural factors.
Middle-aged drivers (45–64) had the highest DUI prevalence (0.24%) followed by drivers aged 65–74 (0.22%). This is consistent with earlier results (Hels et al. 2011), though age in this study was differently grouped. DUI drivers aged 18-24 and 25–44 had a disproportionately high fraction of drivers DUI in injury accidents, whereas for drivers aged 45-64 and 65-74 the opposite was true. This suggests that accident risk of DUI varies with age group. BAC-levels were not significantly different between age groups, so this may result from a systematic variation with age group in background variables like driving pattern, driving style, driving routine and/or driving experience. Hels et al. (2013) concluded in an epidemiological case-control study that DUI risk of severe driver injury decreased significantly with age. This seems consistent with our findings. Decreasing driving risk with age in a more general perspective is widely accepted and explained well by Sagberg et al. (2015) as a shifting balance between excitatory and inhibitory motives with age: Young drivers have a stronger excitatory dominance stemming from biological dispositions (e.g. higher testosterone level for young male drivers) and peer pressure and weaker inhibitory motives due to less driving experience and a lower level of cognitive maturity resulting in weaker risk perception. On the other hand, older drivers have more defensive driving styles because of weaker excitatory motives (biological factors related to aging, sociocultural norms) and stronger inhibitory motives (compensation for biomechanical and/or perceptual impairments) for risky behavior.
DUI prevalence of moped riders (2.87%) was significantly higher than any other road user group, and with this group’s small share of traffic (0.5%), its share of DUI injury accidents was disproportionately high (23.0%). In Denmark, some of the moped riders are car drivers who have been convicted their loss of driver’s license due to DUI (HVU 2018). Members of this group are characterized as often being addicted to alcohol (HVU 2018). This explains some of the high DUI prevalence including prevalence of BACs above 1.0 g/L (1.85%). Due to their alcohol addiction, they probably have high BAC when driving which increases accident risk. Since moped riders are unprotected, they are physically vulnerable which together with increased accident risk is most likely the explanation for their high share of injury accidents. Motorcycle riders are also physically unprotected two wheelers, and they too have a disproportionately high share of DUI injury accidents, albeit not to the same extent as moped riders.
It is clear from the results that DUI primarily took place on weekends and in the night (22:00–03:59) and the evening (16:00–21:59). This is in accordance with earlier Danish prevalence surveys (in the 1985–87 study, DUI was most prevalent early weekend mornings and Friday afternoons (Behrensdorff et al. 1989); in the DRUID survey, illicit BACs were mainly found on weekend days and nights (Hels et al. 2011)). Injury accidents were overrepresented in the early mornings as well. The high DUI prevalence in the morning is probably because most of DUI originates at a social activity during the evening and night. The overrepresentation of injury accidents suggests that the BACs may be high and/or the effect of alcohol adds up with an effect of sleep deprivation in the early morning resulting in a documented elevation of risk separate from the risk of DUI (Ramaekers et al. 2012). These results indicate that enforcement of DUI primarily should take place in the evening and in the night, although a high level of unpredictability should be maintained in the enforcement.
5. Conclusion
This study mapped driving under the influence of alcohol (DUI) prevalence by drivers of passenger cars, vans, lorries, buses, motorcycles, tractors and mopeds in Denmark 2018-2019. 116,378 DUI breath test samples were taken in a representative design in all (12) Danish police districts. DUI prevalence for drivers “on wheels” was compared to DUI prevalence for drivers in injury accidents.
Main findings:
-
Overall DUI prevalence in Denmark was 0.18% (95% CI: 0.16%–0.21%).
-
Overall DUI prevalence in Denmark has been declining over the years from the mid-1980s (1.15%) to 2007/2008 (0.48%) to 2018/2019 (0.18%, this study).
-
DUI prevalence was lowest in the police district Western Copenhagen (0.07%, city) and Copenhagen (0.08%, city), highest in police district Bornholm (0.59%, rural area).
-
DUI prevalence was highest in the night (22:00–03:59, 0.33%) and secondly in the evening (16:00–21:59, 0.23%).
-
Significantly more male than female drivers were DUI (0.23% and 0.09%, respectively).
-
Middle-aged drivers (aged 45-64) were the group with the highest DUI prevalence (0.24%).
-
DUI prevalence in injury accidents was disproportionately high in the younger age groups suggesting a systematic variation in background variables like lack of driving routine, riskier driving pattern and/or driving style.
-
Moped riders had a significantly higher DUI prevalence (2.87%) than any other road user group. Moreover, the share of DUI injury accidents including moped riders was disproportionately high (23.0%) compared to their share of traffic (0.5%).
CRediT contribution
Tove Hels: Conceptualization, Formal analysis, Funding acquisition, Methodology, Supervision, Validation, Visualization, Writing—original draft. Lars Klit Reiff: Conceptualization, Data curation, Formal analysis, Funding acquisition, Investigation, Methodology, Project administration, Validation, Visualization, Writing—review & editing. Harry Lahrmann: Writing—review & editing. Tanja Kidholm Osmann Madsen: Writing—review & editing.
Acknowledgement
We gratefully acknowledge countless police officers who as a part of their duty collected breath alcohol samples around the clock according to the study design. We gratefully acknowledge the Danish National Police for their commitment to integrating evidence-based approaches into policing practice. We thank Inge Behrensdorff, Inger Marie Bernhoft and Jørgen Christensen for earlier DUI prevalence surveys in Denmark.
Declaration of competing interests
The authors report no competing interests.
Declaration of generative AI use in writing
The authors declare that no generative AI was used in this work.
Ethics statement
There was no requirement for ethical approval.
Funding
This work was funded by the Danish National Police as part of their strategic efforts in the field of road safety.
Editorial information
Handling editor: Aliaksei Laureshyn, Lund University, Sweden.
Reviewers: Bernhard Schrauth, Friedrich-Alexander University of Erlangen-Nuremberg, Germany; Alena Høye, Institute of Transport Economics (TØI), Norway.
Submitted: 20 October 2025; Accepted: 18 January 2026; Published: 30 January 2026.