Intelligent speed assistance: an on-road evaluation
Abstract
Although approximately 29% of traffic fatalities involve excessive speed, individual vehicle technology that can reduce speeding has not been widely studied or implemented in the United States (U.S). Starting in 2022, NYC DCAS conducted the largest public pilot of active Intelligent Speed Assistance (ISA) in the U.S., with approximately 400 vehicles equipped with a device that prevents acceleration when the vehicle is traveling faster than a preset threshold over the speed limit (typically 11 mph). Using an “opportunity to speed” framework (i.e., only account for driving time when a driver is traveling at least 5 mph below the speed limit), an analysis of 270 vehicles equipped with ISA showed there was a 64.18% relative decrease in the time driven >11 mph over the posted speed limit following ISA activation compared to before activation. This decrease in time spent speeding was not seen in non-equipped control vehicles. Speeding drive time reduction ranged from ~50% on 25 mph local roads, which have speed safety cameras set to the same enforced speed threshold, to 77% reduction on 50 mph roads. In addition, the impact of ISA on speeding behaviour of habitual speeders in 130 vehicles was similar to that on the primary cohort, indicating active ISA is effective at significantly reducing severe speeding across a wide range of drivers and fleets.
1. Introduction
Despite speeding being a contributing factor in approximately 29% of crashes (NHTSA, 2025), interventions to prevent speeding in the United States are largely limited to traffic enforcement, education and public service campaigns. Other measures, such as traffic calming infrastructure, are effective, yet expensive and slow to implement (Distefano & Leonardi, 2019). Intelligent Speed Assistance (ISA) is a vehicle technology that actively prevents a vehicle from accelerating beyond a particular speed threshold. Unlike traditional speed governors or limiters that cap top speed regardless of the local speed limit, ISA is dynamic. Using GPS mapping or speed limit sign reading technology, ISA can limit the speed of the vehicle to either the local speed limit or to a user-defined threshold above the local speed. Although ISA holds promise for increasing safe driver behaviour, a widescale field evaluation has not yet been conducted in the United States (U.S.). The current research aims to evaluate the effectiveness of ISA installed on 400 New York City fleet vehicles over a multi-year period.
1.1 Background
Since 2022, the National Roadway Safety Strategy (NRSS) objectives follow a Safe System Approach consisting of five key elements: Safer People, Safer Vehicles, Safer Speeds, Safer Roads, and Post-Crash Care (U.S. DOT, 2025). ISA has the potential to improve road safety via two of these key elements (Safer Speeds and Safer Vehicles).
ISA is classified as either a “passive” or “active” system, as shown in Table 1. Passive ISA allows drivers to override the system and drive faster than the local speed limit, but drivers are alerted as they exceed the speed limit by a certain amount. Active ISA cannot be overridden except in limited cases, such as with the press of an override button or with kickdown of the accelerator pedal, which removes the ISA limitations for a defined period. However, note that active ISA is distinct from static speed limiter/governors that enforce a maximum speed regardless of the current speed limit (i.e., a vehicle may be limited to 65 mph whether it is a 70-mph speed limit or a 30-mph limit).
| Type | ISA –Active | ISA –Passive | Speed Limiter/Governor |
|---|---|---|---|
| Override capabilities | Limited time override option, either button or accelerator press | Advisory can be completely overridden or ignored by driver | Enforced speed limit cannot be overridden |
| Mechanism | Utilizes local speed limit based on geospatial or road sign detection data | Utilizes local speed limit based on geospatial or road sign detection data | Maximum speed limit consistent regardless of local speed limit |
| Driver Feedback | Lack of acceleration, haptic, auditory, visual | Haptic, auditory, visual | None |
| Maturity | Developing | High | High |
| Implementation | NYC, Ventura County, Somerville, MA; London, UK | European Union | Commercial truck and bus fleets |
One advantage of aftermarket ISA devices is that they are fast to install and modify on fleets to meet individual safety needs and operating contexts. Drivers or fleet managers can change parameters such as override settings and speed thresholds depending on the purpose and desired behavioural outcomes.
For over a decade, passive ISA has been examined as a possible way to reduce speeding in North American drivers (Merrikhpour et al., 2014; Reagan et al., 2013). The reported effectiveness of passive ISA amongst this population has been mixed. For example, although a field test of an auditory passive ISA system conducted in Michigan demonstrated small reductions in speeding 5 mph or more over the speed limit, providing drivers financial incentives for driving the speed limit was more effective (Reagan et al., 2013). Similarly, the SafeMiles trial in Winnipeg, Manitoba, evaluated a feedback-reward system on 37 drivers, finding that the combination of real-time warnings and incentives effectively reduced both speeding and tailgating behaviors, with the effects declining but persisting above baseline after the interventions were removed. Over the past several years, active ISA technology has become more visible to the public in the United States, with both road safety organizations and municipal and state governments promoting its deployment. In January 2024, NTSB issued a safety recommendation to require all new vehicles to be equipped with either a passive or an active ISA system (NTSB, 2024). The recommendation was put forward in response to a high-profile multivehicle crash in which nine people were killed after a driver ran a red light, traveling at 103 mph on local streets. It was later revealed the driver had a history of speeding. Although this crash represents an extreme form of speeding behaviour, the NTSB report concluded that ISA could prevent speeding recidivism and crashes involving habitual speeders (NTSB, 2023).
ISA has also been recommended from a policy perspective to reduce speed violation recidivism, The District of Columbia and the states of Virginia and Washington passed the first US legislation regarding ISA starting in February 2024 (FIA Foundation, 2024). The laws require the vehicles of drivers convicted of speeding or reckless driving to be equipped with active ISA systems. Relatedly, a New York State senate bill was proposed that would require drivers who accumulate six or more speeding tickets in one year (or 11 or more points on their license in 18 months) to have an ISA device installed on their vehicle (Senate Bill S7621). To date, at least three municipal fleets in the USA have rolled out pilots on active ISA: Ventura County, CA, Somerville, MA, and, most extensively, New York City.
Although public sector ISA implementation has only recently begun in the United States, Europe and the UK are significantly further along in the process of implementing ISA in fleet and new vehicles. According to NHTSA, ISA has been widely tested and is being implemented in Europe and other countries that have adopted the Safe System approach (Venkatraman et al., 2021). For example, Transport for London (TfL) has incorporated ISA into both its transit bus and fleet vehicles. Since 2019, all new London buses are required to be equipped with active ISA as part of a wider bus safety standard that also aims to improve direct and indirect vision for drivers, install audible warnings to alert pedestrians, and redesign buses to reduce the impact of collisions (TfL, 2024). As of August 2024, approximately 4,500 buses, or half of the fleet, were fitted with ISA. In addition, 360 TfL fleet vehicles have been equipped with aftermarket active ISA.
In July 2022, passive or active ISA systems in passenger vehicles sold in the European Union became mandatory for all new vehicle models (European Commission (2022), European Union (2021)). Further, starting in July 2024, all new vehicles sold in the EU have been required to be equipped with passive or active ISA. The regulations require either passive or active ISA installations, with vehicle manufacturers having four options for feedback: cascading acoustic warning, cascading vibration, haptic feedback through the acceleration pedal, or speed control function. In the case of active ISA, it can be temporarily overridden by pressing on the accelerator. Importantly, any ISA system in the EU must be configured to turn on every time the vehicle is turned on, and it may not be permanently disabled by the driver.
However, ISA in the EU is not new. Tens of millions of vehicles are operating with some form of ISA across the EU, as more than a decade before ISA became mandatory on new vehicles in Europe, Euro NCAP added ISA in its five-star safety ratings of vehicles in 2009, awarding additional points to vehicles with systems where speed limit information is directly linked to the warning and speed limitation function (Schram et al., 2013).
1.2 ISA Effectiveness
The EU-funded project PROSPER considered ways that advanced driving assist features and technology related to speed limitation could improve safety (Morsink et al., 2008). The PROSPER project calculated expected crash reductions for six countries, projecting reductions in fatalities between 19% and 28%, depending on the country, in a market-driven scenario of ISA adoption (i.e., if ISA was optional for consumers). Higher reductions were predicted for a regulated scenario (i.e., if ISA was required for consumers), between 26-50%. Benefits were generally projected to be larger on urban roads than on highways and larger if active forms of ISA were to be applied (Beyst, 2004).
Trials with ISA have been carried out in at least ten European countries: Austria, Belgium, Denmark, Finland, France, Hungary, The Netherlands, Spain and Sweden (Goodwin et al., 2006). An earlier study in the Netherlands found that ISA could reduce the number of hospital admissions by 15% and the number of deaths by 21% (van Loon & Duynstee, 2001). Further, a study in the United Kingdom estimated not only the reduction in crashes due to ISA, but also the reduction in CO2 emissions and cost savings (Lai et al., 2012). The authors estimated that ISA could reduce crashes on 70 mph roads by 33% while reducing CO2 emissions by 5.8%. Finally, the analysis suggested that the benefit-to-cost ratio from implementing ISA would range from 3.4 to 7.4, with the monetary savings of avoided fatal and serious crashes paying back implementation costs within 15 years.
As previously mentioned, TfL has implemented active ISA across nearly 5,000 buses and fleet vehicles. Based on the agency’s evaluation study, TfL buses equipped with ISA saw large reductions in speeding on the two analysed routes. For example, in 20 mph zones, the time spent speeding decreased from 14.91% to 0.95% on one route and 17.77% to 3.32% on the other. TfL fleet vehicles also demonstrated a reduction in the rate of speeding events, triggered by any recorded amount of time driven over the speed limit, per 1,000 miles of driving. The largest reduction was found in higher speed limit zones, with an 89% reduction in speeding events per 1,000 miles in 60 mph zones and 72% reduction in 50 mph zones, with a slightly smaller decrease seen in lower speed limits (e.g., a 60% reduction in 20 mph zones) (Dodd, 2022).
1.3 Project purpose
While the effectiveness of ISA has been tested in Europe, extensive, empirical testing of ISA has not yet been conducted in the United States. The goal of the evaluation of New York City’s ISA pilot is to assess the potential of ISA technology to address both the Safer Vehicles and Safer Speeds elements of the Safe System approach in a U.S. context. Specifically, the pilot’s purpose is to test the effectiveness of active ISA in reducing dangerous speeding in a public sector fleet. Speeding is a staff safety, public safety, and reputational issue for all fleets. Data on the benefits, best practices, and transition into ISA adoption to address these issues can be valuable for a wide range of fleet operators in both the public and private sectors. As a secondary benefit, an ISA pilot in a large fleet setting offers the opportunity to test the technology on a wider range of vehicle types, sizes, and applications than would be possible in the general vehicle population.
To examine the potential benefit of active ISA on fleet vehicles in the United States, the speeding behaviour of drivers using ISA-enabled vehicles was compared to the speeding behaviour of drivers using vehicles without ISA.
2. Method
2.1 Design and Vehicle sample
The pilot was designed to assess the robustness of ISA in reducing speeding risk across a wide range of vehicle types, agencies, and application. The current project relied solely on naturalistic observations of fleet drivers and did not involve interventions beyond ISA implementation and preliminary training on the device. Note that the ISA devices were installed on New York City government property, not drivers’ personal vehicles. Although most NYC fleet drivers use the same government vehicle consistently, there are some instances where a driver may operate a different vehicle (e.g., if a vehicle is in the repair shop or out of service). As a result, analyses were conducted based on vehicles, not on individual drivers.
The current analysis examines a primary cohort of 540 vehicles, and a habitual speeder cohort of a separate group of 130 vehicles. The NYC pilot evaluation is therefore based on data collected from 670 total fleet vehicles.
2.1.1 Primary cohort
The primary cohort dataset consisted of 540 vehicles operating in New York City, including 270 treatment vehicles with ISA installed and activated and 270 matched control vehicles without ISA. ISA devices on treatment vehicles were activated between July 13, 2022, and February 16, 2024. Most control vehicles (160) were selected based on the make, model, year and utilizing agency to control for possible confounding factors. When that was not possible, vehicles were matched based on make, model, and year of vehicle or make and model of vehicle. In two cases, vehicles were matched via utilizing agency and vehicle weight class. Details of this breakdown are provided in Table 2. Of the 540 primary cohort vehicles, 440 were vehicles operated by the City of New York, and 100 vehicles were school buses operated by NYCSBUS (50 school buses equipped with ISA, 50 school buses functioning as control vehicles).
| Matching characteristics | Number of matched control-ISA vehicle pairs |
|---|---|
| Make, model, year, and utilizing agency | 160 |
| Make, model, and year | 99 |
| Make and model | 9 |
| Utilizing agency and vehicle weight class | 2 |
| Total | 270 |
A 60-day pre-ISA activation period was selected for each ISA treatment vehicle, ending on the last day of driving prior to ISA activation, and a 60-day post-ISA activation period was selected beginning on the day after ISA activation. The same date ranges were selected for the corresponding control vehicles. For example, if ISA was installed on a particular vehicle January 1, the pre-ISA activation period would be November 2 to December 31 and the post-ISA activation period would be January 1 to March 1. The analysis time frames were the same for each matching control vehicle. Although control vehicles did not have ISA installed, the time periods are still referred to as pre-ISA activation and post-ISA activation periods.
Of the 270 treatment vehicles, 26 vehicles had no driving data for the pre-ISA period, as they were purchased shortly before ISA installation. These vehicles were removed for comparison between pre- and post-ISA.
Near-real-time location and speed data were obtained for each control and treatment vehicle from the Geotab telematics platform for both the pre- and post-ISA activation periods. Because obtaining second-by-second speed data for 540 vehicles was not possible, a Geotab event-reporting log record totalling 51 million rows was used. An event corresponding to each row in the log record was created each time that a vehicle initiated a change in direction or speed, typically once every few seconds while the vehicle was moving. Each event reported the duration, location latitude/longitude, instantaneous speed (in integer km/hr), and speed limit. The location, instantaneous speed, and posted speed limit data for the 60-day pre-/post-ISA periods were extracted for each vehicle. Data were analysed for a total of 894,938.3 miles across the four groups.
2.1.2 Habitual speeder cohort
In addition to the 540 vehicles analysed as the primary cohort, a further 130 vehicles were identified as having a history of being driven at excessive speeds. Habitual speeder status was determined based on either the prior issuance of automated speeding tickets to these vehicles or on multiple severe speeding alerts flagged via telematics. ISA was installed and activated on habitual speeder vehicles in August 2024. Analyses were conducted on this habitual speeding cohort by comparing speeding behaviour from the 30 days prior to ISA installation to speeding behaviour in the 30 days following installation, using a similar Geotab event-reporting log record consisting of 8.7 million rows. The vehicles drove a combined 76,188 miles in the 30 days prior to ISA installation and 65,992 miles in the 30 days after installation.
2.2 Equipment settings
Aftermarket active ISA devices manufactured by the supplier MAGTEC were deployed in the NYC Fleet ISA pilot. The MAGTEC “SafeSpeed” devices work by limiting the driver’s ability to accelerate when the vehicle is traveling faster than a predetermined threshold above the posted speed limit, where the speed limit is based on a GPS mapset. The speed threshold is customizable and can be set on a vehicle by-vehicle basis. In the pilot, most miles using the ISA devices were programmed to limit driving speed to 11 mph or above the actual speed limit; this was later adjusted to 10 mph over the limit to help prevent speed safety camera tickets. DCAS chose to implement the system at a 10-11 mph threshold for most miles driven in the pilot to assist with driver adoption and transition to the technology. The system employed by DCAS was found to operate well at all speed limits and all thresholds above the speed limits found in the City.
Drivers using ISA-enabled vehicles also had access to a dashboard-mounted button that could temporarily override the speed threshold for an adjustable duration, which was programmed to 15 seconds. The override button was implemented to ensure that drivers could exceed the threshold in case of emergencies, malfunction, or in circumstances where it could be unsafe for the driver to drive significantly slower than surrounding traffic, for example when merging onto a highway.
2.3 Training
Drivers of ISA enabled vehicles were trained in the functionality of ISA. Drivers of the first 50 pilot vehicles were given one hour of classroom training along with up to one hour of field training to test the device with a technician. During the demo, drivers could ask the technician questions about the system and how to override the ISA if necessary. NYC School Bus Umbrella Services (NYCSBUS) drivers received a similar hour-long classroom training. Other drivers of ISA enabled vehicles received a one-page handout that explained the ISA functionality along with how to use the override button.
2.4 Data corrections and processing
Although speed limits were obtained from the Geotab database, New York City roadways present challenges in determining speed limits from GPS data. For example, some limited-access highways with higher posted road speeds run parallel to local service roads with lower speed limits. In addition, on- and off-ramps (whose speed limits differ from main roads) are located close together. Because of these complexities, there were known errors in the speed limit designations from Geotab, with lower speed limits sometimes applied to vehicles when they were on a higher-speed arterial.
To correct these instances of erroneous speed limits, polygons representing regions of speed limits from 30 to 50 mph were created using NYC Open Data Vision Zero View Speed Limits (NYC, 2025). Locations found within these polygons were assigned the highest corresponding speed limit. There is a city-wide speed limit of 25 mph unless otherwise posted, so any locations outside of these polygons were presumed to have speed limits no higher than 25 mph, and Geotab-designated speed limits were used for these locations. Analyses were limited to within New York City limits to assure confidence in the speed limit data. This restriction is also representative of the driving behaviour of the study vehicles, as approximately 92% of the driving time of the 540 vehicles occurred within New York City limits. As will be seen later in the report, restriction of the analysis to locations within the five boroughs of NYC likely underestimates the effectiveness of ISA, which was found to increase on higher speed limit roads.
The distribution of driving in the pilot across speed limit zones was analysed and found to vary depending on the metric used. For example, forty-five percent of driving distance in the pilot occurred in 50 mph zones, whereas 47 percent of driving time occurred in 25 mph zones, reflecting the lower speeds. These distributions are summarized in Table 3 and Table 4. Note that distance and time percentages for the 25-50 mph zones do not sum to 100%, as a small fraction of driving in the pilot occurred in speed limits below 25 mph, including city park roads and paths, parking lots, and yards.
| Speed Limit Zone | < 25 mph | 25 mph | 30 mph | 35 mph | 40 mph | 45 mph | 50 mph | Total drive time (hr) |
|---|---|---|---|---|---|---|---|---|
| ISA pre | 457.51 | 8949.18 | 1177.56 | 342.73 | 1018.77 | 1380.14 | 4834.81 | 18160.70 |
| ISA post | 790.98 | 6340.97 | 1001.31 | 307.18 | 851.48 | 1108.80 | 3451.38 | 13852.10 |
| Control pre | 268.99 | 7001.37 | 1318.56 | 391.15 | 1052.19 | 1123.44 | 4026.08 | 15181.78 |
| Control post | 1706.00 | 6483.28 | 886.85 | 294.83 | 1333.19 | 987.25 | 2982.00 | 14673.40 |
| Total | 3223.48 | 28774.80 | 4384.28 | 1335.89 | 4255.63 | 4599.63 | 15294.27 | 61867.98 |
| Percentage of time spent in SLZ | 5% | 47% | 7% | 2% | 7% | 7% | 25% | 100% |
| Speed Limit Zone | < 25 mph | 25 mph | 30 mph | 35 mph | 40 mph | 45 mph | 50 mph | Total drive distance (mi) |
|---|---|---|---|---|---|---|---|---|
| ISA pre | 2663.52 | 60063 | 13090 | 3568 | 20781 | 19272 | 105629 | 225066 |
| ISA post | 1549.14 | 39544 | 10910 | 2906 | 18689 | 15913 | 80046 | 169557 |
| Control pre | 1606.91 | 52226 | 13525 | 5634 | 16825 | 13959 | 86658 | 190434 |
| Control post | 2769.01 | 51777 | 12359 | 4162 | 21803 | 14553 | 74950 | 182374 |
| Total | 8588.58 | 203611 | 49884 | 16270 | 78097 | 63697 | 347283 | 767431 |
| Percentage of distance spent in SLZ | 1% | 27% | 7% | 2% | 10% | 8% | 45% | 100% |
2.5 Opportunity to speed framework
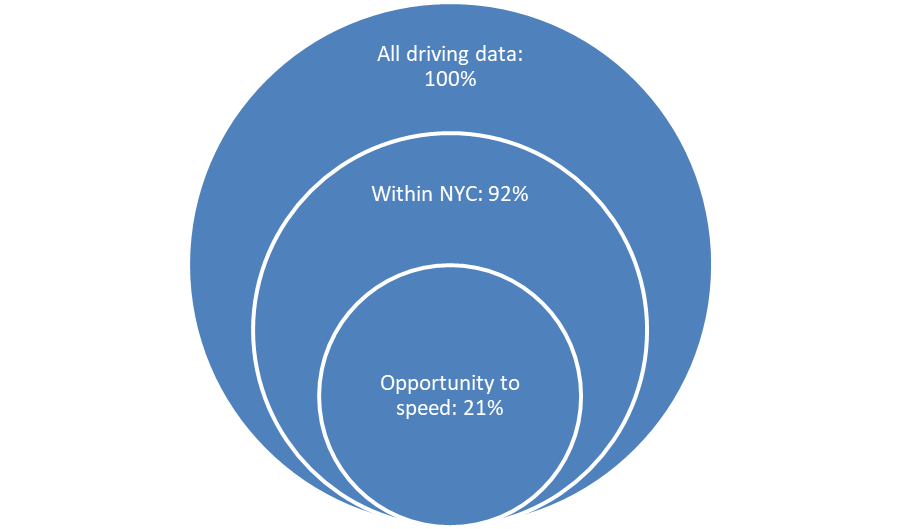
There are times when a driver may wish to speed, but because of congested traffic, traffic signals, or road geometries they physically cannot speed. In the current pilot, this would potentially result in a large proportion of recorded drive time where ISA is not engaged because the driver already cannot travel at their intended speed. Given that heavy traffic and signalized intersections are a reality of driving within New York City, analyses were conducted using an “opportunity to speed” framework. This method has been used previously in a NHTSA analysis of naturalistic driving data to control for traffic conditions when analysing speeding behaviours (Richard et al., 2020). Only time spent driving at speeds 5 mph below the speed limit and faster were included in the analysis. As in the Richard et al. (2020) study, this represents time when the driver was inferred to be in free-flow or open-road traffic and therefore reasonably had the opportunity to speed. As shown in Figure 1, 20.75% of recorded driving time met all criteria for inclusion in the study: within the borders of NYC and faster than 5 mph below the speed limit.
The proportion of time representing opportunity to speed remained relatively consistent across the speed limit zones (13-21%), as seen in Table 5. Note that percentages for the 25-50 mph zones do not sum to 100% given that a small fraction of driving occurred in zones with speed limits below 25 mph, including on park roads and paths, parking lots, and surface streets with speed limits that were potentially lowered to 20 mph during the study period. The opportunity to speed percentage was higher in the <25 mph zone than in all other zones. However, given that the speed limits could not be readily verified for this small subset of driving (comprising approximately two percent of total drive time) analyses focused on the 25-50 mph zones.
| Speed Limit Zone | < 25 mph | 25 mph | 30 mph | 35 mph | 40 mph | 45 mph | 50 mph | Total drive time (hr) |
|---|---|---|---|---|---|---|---|---|
| ISA pre | 430 | 1656 | 233 | 43 | 275 | 204 | 843 | 3683 |
| ISA post | 366 | 1067 | 170 | 30 | 240 | 153 | 619 | 2646 |
| Control pre | 633 | 1619 | 222 | 89 | 213 | 123 | 675 | 3574 |
| Control post | 985 | 1305 | 182 | 44 | 186 | 114 | 579 | 3395 |
| Total | 2415 | 5646 | 808 | 207 | 914 | 594 | 2716 | 13299 |
| Percentage of total opportunity-to -speed driving time | 75% | 20% | 18% | 15% | 21% | 13% | 18% | 21% |
To normalize for differences in miles driven, analyses were conducted on the percent of total driving time spent speeding over the limit, rather than the absolute times driven. When comparing time periods, only vehicles that were actively collecting data in the 60 days prior to ISA installation were included.
2.6 Analysis
The ISA devices were set to a threshold of 11 mph over the posted speed limit and to a global maximum speed of 65 mph. Thus, a vehicle traveling less than 11 mph over the posted speed limit, though it was speeding, was considered within the enforced speed threshold; and travel at a speed greater than 11 mph over the posted speed limit was considered to be severe speeding.
To determine the effect of ISA, a paired t-test was used to compare the percent of time each individual vehicle spent severely speeding (>11 mph over the speed limit) before and after the activation of ISA on that vehicle. Thirty-nine out of the 270 vehicles with ISA were removed from this portion of the analysis due to having insufficient driving data before installation and activation. The remaining 231 vehicles were used on a second paired t-test to compare the percent of time an individual vehicle spent speeding between 0 and 11 mph over the speed limit before and after the activation of ISA on the vehicle. At these speeds, the ISA devices were not limiting vehicle speed.
To compare patterns in the reduction of time spent speeding, the total number of seconds spent speeding at each 1-mph increment above the speed limit was summed across all vehicles within the four treatments: pre-ISA activation time period in ISA vehicles, pre-ISA activation time period in control vehicles, post-ISA activation time period in ISA vehicles, and post-ISA activation time period in control vehicles. These speeding time totals were then divided by the total time that all vehicles within a treatment were driving with opportunity to speed.
To estimate the magnitude of the effect of ISA, the percentage change in the time spent driving above the allowed speed threshold was determined for both the control and ISA vehicles. These percentage changes were also determined for driving in specific speed limit zones from 25 mph to 50 mph to determine if ISA had differing levels of effectiveness on public roads with different speed limits.
The same analysis was largely repeated for the additional cohort of 130 habitual speeding vehicles, including t-tests to compare pre- and post-ISA activation in the percentage of time spent speeding both between 0-11 mph over the speed limit and above 11 mph over the speed limit, and visualizations of the percentage of time spent at each 1 mph interval over the speed limit from pre- to post-ISA activation.
3. Results
3.1 Primary cohort
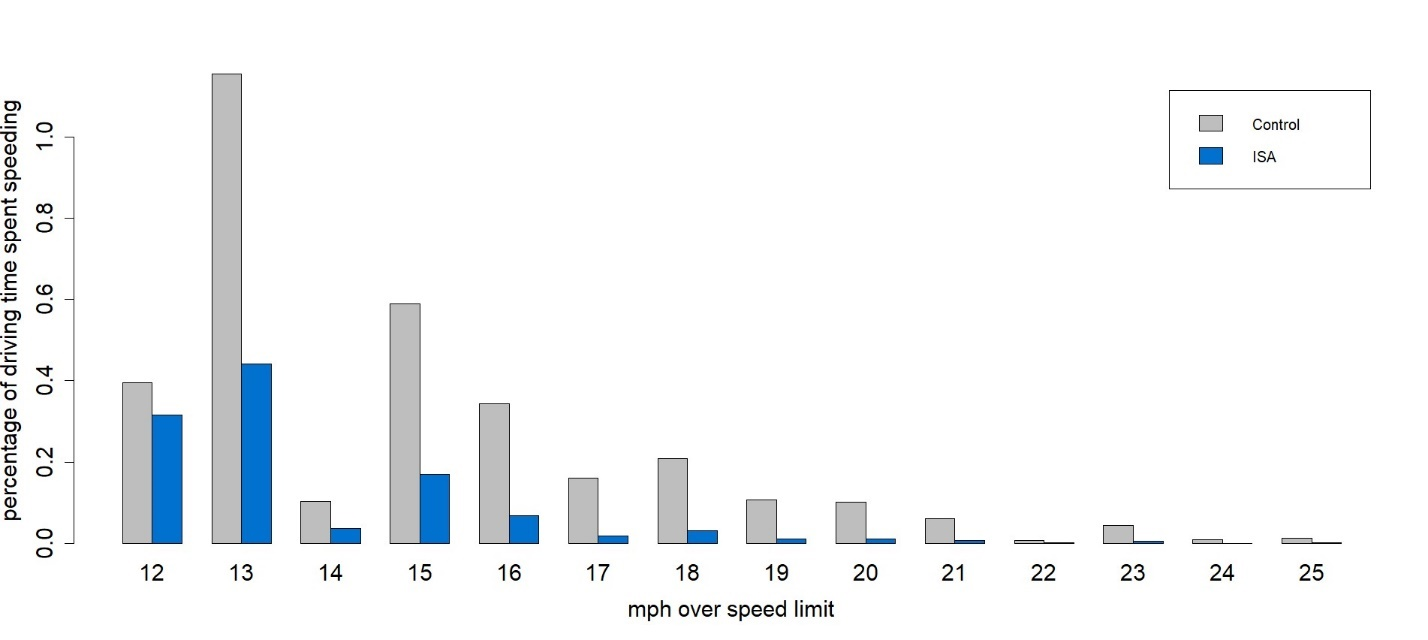
Vehicles equipped with ISA spent a smaller proportion of time traveling more than 11 mph over the speed limit after ISA was enabled compared to before it was enabled, t(230) = 8.922, p < .001. In contrast, there was no difference between the two time periods for ISA vehicles in terms of the proportion of time spent traveling up to 11 mph over the speed limit, t(230) = 0.0229, p = .982. This finding indicates that the installed ISA device successfully limited speeding above the enforced speed limit. Figure 2 shows the detailed differences in percentage of speeding for the ISA group both before and after ISA was enabled. The figure displays one mph increments above the speed threshold, from 12 mph to 25 mph over the speed limit. While speeding was similar between the two time periods up to 11 mph (and in some cases, the post-ISA period showed higher rates of speeding below the enforced threshold), speeding by >11 mph over the limit in the post-ISA period dropped sharply in comparison to the pre-ISA period. Note that some speed increments (e.g., 14 mph) above the speed limit appear to have lower prevalence compared to other values. This may be an artifact of conversion from native km/h units in the telematics log record to mph for analysis purposes.

It is important to note that, even before the ISA system was enabled, speeding above 11 mph over the speed limit was rare within the sampled NYC fleet vehicles. Before ISA was enabled, 3.17% of driving time was >11 mph over the speed limit when drivers likely had the opportunity to speed. After ISA was enabled on the 270 primary cohort vehicles, 1.14% of driving time was 11 mph or greater over the speed limit, representing a 64.18% relative decrease in time spent speeding. Note that this approximately one-percent speeding rate with ISA was only in time periods when drivers had the opportunity to speed. Of the total driving time within NYC, representing 894,938 miles driven with ISA over the study period, 99.74% was within the enforced speed limit.
Importantly, the 64.18% reduction effect was only seen in the ISA group, as the matched control vehicles were driven >11 mph over the posted speed limit 3.13% of the time in the pre-ISA period and 3.43% of the time in the post-ISA period, consistent with a 9.71% relative increase in time spent speeding by the control group. In combination, these findings suggest that the decrease in time spent speeding in the ISA group was due to the installation of the ISA device, not extraneous factors such as time, weather, or vehicle type. Figure 3 shows the percent of drive time spent above the enforced speed limit in the ISA and control groups, at which the ISA device engaged and prevented an increase in speed.
In addition to global comparisons between the control and ISA-enabled vehicles, the effect of ISA on speeding behaviours when driving on roads with different speed limits was analysed between pre- and post- ISA treatment periods.
Table 3 shows the average percentage of time each vehicle spent driving >11 mph over the speed limit in different speed limit zones, for both the control group and the ISA group. Paired t-tests by vehicle were conducted for proportion of time spent speeding in each speed limit. Although the proportion of time the control group spent driving >11 mph over the posted speed limit decreased slightly (with the exception of the 35-mph zone), none of the decreases were statistically significant. In contrast, in the ISA group, there were significant decreases (p < .01) in each speed limit zone. The largest speeding decreases were seen in the 45 mph and 50 mph zones, with a relative speeding decrease of 73.11% and 77.34% respectively.
| Speed Limit Zone | 25 mph | 30 mph | 35 mph | 40 mph | 45 mph | 50 mph |
|---|---|---|---|---|---|---|
| Pre-ISA Control (No ISA) | 0.89% | 3.26% | 4.94% | 8.20% | 4.88% | 4.48% |
| Post-ISA Control (No ISA) | 0.83% | 3.16% | 6.99% | 8.06% | 4.05% | 4.43% |
| Speeding Relative Change Control (No ISA) | -7.18% | -2.94% | +41.34% | -1.76% | -17.11% | -1.08% |
| Speed Limit Zone | 25 mph | 30 mph | 35 mph | 40 mph | 45 mph | 50 mph |
| Pre-ISA Treatment (ISA Off) | 0.76% | 3.54% | 5.22% | 7.23% | 3.44% | 3.93% |
| Post-ISA Treatment (ISA On) | 0.38% | 2.35% | 2.92% | 3.50% | 0.93% | 0.89% |
| Speeding Relative Change Treatment (ISA-enabled) | -49.56%* | -33.62%* | -44.05%* | -51.54%* | -73.11%* | -77.34%* |
3.2 Habitual speeder cohort
In addition to examining how ISA impacts the speeding behaviours of drivers in general, this study investigated the effectiveness of ISA for “habitual” or high-risk speeders. As part of its ISA rollout, DCAS installed ISA on 130 additional vehicles that had been designated as habitual speeders based on speed safety camera violations and/or excessive speeding alerts received by the DCAS Fleet Office of Real Time Tracking (FORT), which monitors telemetry from all fleet vehicles in real-time, including speed data. The goal of DCAS with this habitual speeder cohort was to utilize ISA to improve safe driving among the most challenging set of vehicles in the fleet.
Note, that due to the limited amount of driving data available (30 days before ISA installation and 30 days after ISA installation), these results should be treated as preliminary.
The impact of ISA on habitual speeders was found to be comparable to the impact on the main cohort of vehicles, demonstrating the technology’s effectiveness in curbing even severe, habitual speeding behaviour. Habitual speeders exhibited a 49.22% decrease in the percentage of time speeding >11 mph over the speed limit after ISA was installed, t(112) = 6.40, p < 0.0001. As seen in Table 7, decreases were observed in all speed limit zones, but the largest decreases occurred in the higher speed limit zones. Although the three lowest speed zones (25 mph, 30 mph, and 35 mph zones) have no statistically significant decrease, speeding in these zones still decreased after ISA implementation.
| Speed Limit Zone | 25 mph | 30 mph | 35 mph | 40 mph | 45 mph | 50 mph |
|---|---|---|---|---|---|---|
| Pre-ISA July 2024 | 0.38% | 1.36% | 5.06% | 6.44% | 4.64% | 3.61% |
| Post-ISA August 2024 | 0.36% | 1.30% | 3.72% | 2.88% | 1.36% | 1.07% |
| Speeding Relative Change Habitual Speeders | -4.97% | -4.35% | -26.48% | -55.23%* | -70.71%* | -70.23%* |
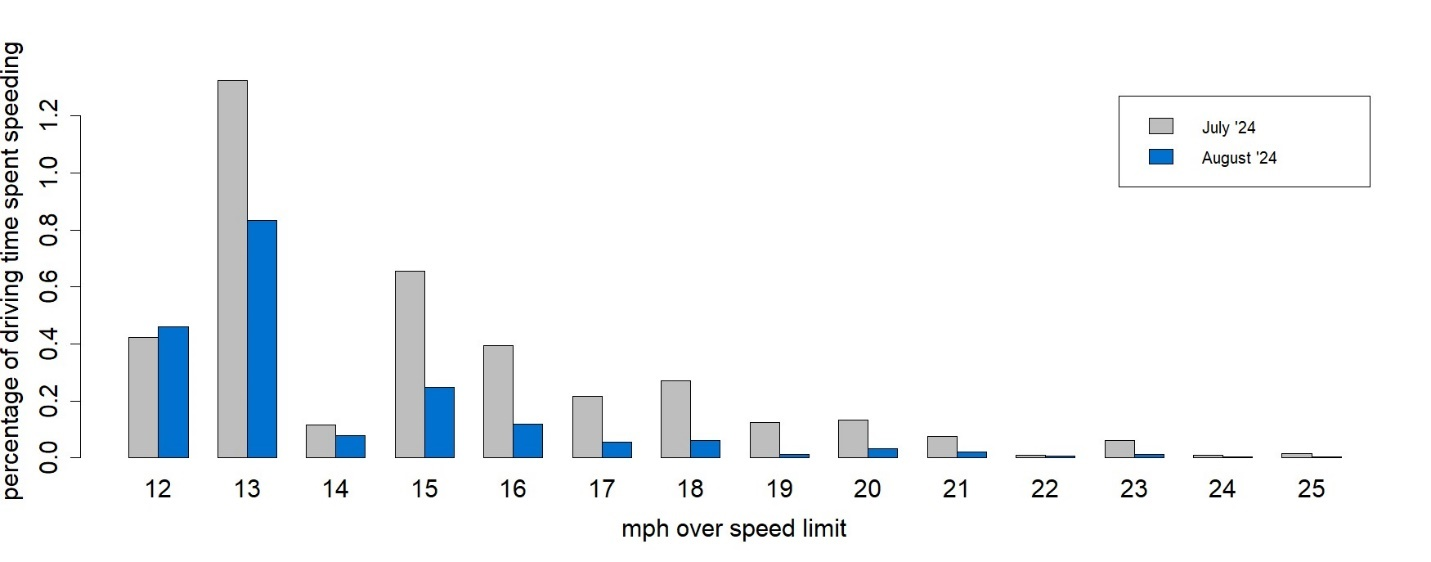
Unlike in the primary cohort, there was a slight increase in speeding between 1 and 11 mph above the speed limit after the ISA device was installed, t(112) = -3.5071, p < .001 (Figure 4).
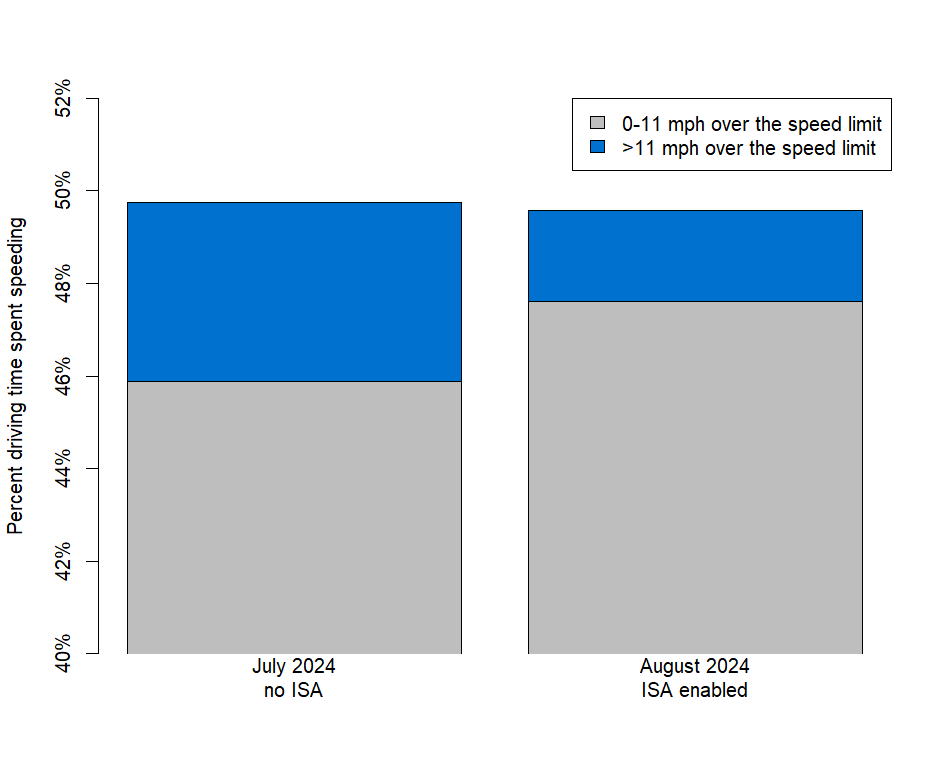
Figure 5 illustrates the detailed impact of enabling ISA device on the habitual speeder group, in the 12-25 mph range over the speed limit, speeds at which the ISA device engaged and thus prevented an increase in speed.
4. Discussion
Vehicles equipped with ISA spent a smaller percentage of time traveling more than 11 mph over the speed limit after ISA was enabled compared to before it was enabled. This effect was not seen in the equivalent control vehicles. In addition, ISA was effective at reducing severe speeding (>11 mph over the speed limit) even in vehicles that had a history of speed tickets and violations. However, ISA appeared to be most effective in areas with higher speed limits. Note that while ISA was effective at reducing speeding beyond the designated threshold, there were limited situations where a vehicle could travel above the threshold (e.g., if the driver pressed the manual override button or if they entered a lower speed limit area from a higher speed limit area). Although these findings demonstrate that ISA is an effective tool to reduce severe speeding in fleets, there are several questions that need to be considered, namely, why ISA was most effective at higher speed limits and how public perception and acceptance may affect widescale deployment and adoption of the technology in the United States.
4.1 Speed limit zones and thresholds
As discussed previously, the post-ISA reduction in driving 11 mph or more over the posted speed limit was most pronounced on the higher speed roads, up to 77%. In contrast, the speeding reduction of about 50%, while still significant, was smallest on the lowest speed roads.
The study team hypothesizes two related explanations for this pattern. First, it is more difficult to drive >11 mph over the speed limit on local NYC streets than on higher-speed arterials or highways since only the local streets have speed safety cameras, and they present more friction: traffic lights, stop signs, (double) parking, and interaction with people walking, biking, etc. Second, prior research suggests that drivers tend to speed in proportion to the speed limit, not by a constant amount such as 5 or 15 mph above. In a 2024 study, 49% of surveyed drivers responded that they had exceeded the speed limit by 15 mph on a freeway in the past month, but only 36% responded that they had exceeded the speed limit by 10 mph, a smaller amount, on a residential street (AAA FTS, 2024). The presently studied ISA system’s 11 mph threshold could therefore be expected to curtail speeding by the surveyed drivers when on the freeway but not on the residential street.
It is worth noting that the specific 11 mph threshold utilized in this pilot was selected by NYC DCAS to align with the trigger threshold of the city’s existing automated speed safety cameras. Consistency with established enforcement parameters was deemed important for driver acceptance, particularly within a unionized workforce context where introducing new monitoring technology can be sensitive. However, this fixed 11 mph margin allows for a high percentage of speeding on lower-speed roads (e.g., 44% over the limit in a 25-mph zone) before the system intervenes. The lower the posted speed limit, the larger the percentage over that speed limit the driver must exceed before ISA intervenes. On 20 mph local streets, a driver can operate 55% over the posted speed limit, whereas, on 50 mph highways, a driver can only operate 22% over the speed limit.
The larger percent above the speed limit that the threshold allows on lower-speed streets may help explain the lower baseline of >11 mph severe speeding on NYC’s 25 mph and 30 mph streets, as compared to the baseline speeding rates on NYC’s 35+ mph roads. This disparity likely contributes to the lower effectiveness of the system observed in lower speed zones and underscores the value of testing proportional thresholds in future iterations, as discussed next.
Since driving 31 mph in a 20-mph zone increases the risk of death to a person struck by the vehicle far more than does driving 61 mph in a 50-mph zone, speeding 11 mph over the limit on local streets may be seen as the more severe behaviour to mitigate in an urban context (Tefft, 2013). To reflect this, fleets looking to deploy ISA with a nonzero speed threshold should consider a proportional speed threshold rather than a constant threshold. While the current ISA system used by NYC DCAS permits two separate thresholds (city/highway), as future systems allow, fleets could deploy a threshold that is always the same percent above the posted speed limit—for example, 10% or 20%. This would test the hypothesis that a proportional enforced speed limit approach will better align with how drivers tend to speed, result in even larger speeding reductions, and produce greater safety benefits on local streets.
4.2 Driver and stakeholder acceptance
Although the current study was unable to solicit feedback from drivers using the ISA technology, several studies have looked at public opinion on ISA. This is a key consideration in ensuring that the technology is accepted and used by fleet drivers. The Insurance Institute for Highway Safety (IIHS) published a nationally representative survey study that investigated U.S. driver acceptability of various hypothetical ISA systems (Reagan & Cicchino, 2025). The study included passive ISA that only alerted the driver, accelerator pedal feedback that provided resistance when the driver was traveling over the speed limit, and an active ISA that would prevent accelerating over the speed limit. Overall, nearly two-thirds or 63.8% of 1,802 respondents agreed that passive ISA would be acceptable, 50% of respondents agreed that accelerator pedal feedback would be acceptable, and 51.5% of respondents agreed that active ISA would be acceptable. Perhaps unsurprisingly, drivers who reported frequently speeding were less likely to find the ISA systems acceptable compared to drivers who rarely speed. Although the public appears to be nearly evenly split on current perception of active ISA, it is important to note that most people have not yet experienced ISA firsthand. The opportunity to directly experience a new technology like ISA can help to diffuse concerns and increase user acceptance (Reagan, 2024). Even without such direct experience, the rates of acceptance reported by IIHS, especially for passive ISA, may be higher than some fleet managers and policymakers had previously assumed.
Another recent study investigated the perspectives of non-driver stakeholders on ISA adoption by interviewing representatives from a range of UK stakeholder groups, including policy and road infrastructure providers, road safety, the insurance industry, vehicle manufacturing and technology, police, driver training, and motoring organizations. Interviews explored perspectives around effective ISA systems, whether and how to introduce ISA, and barriers to ISA adoption (Day et al., 2024). Approximately 75% of these stakeholders were in favour of adopting ISA in UK vehicles; of these, one third preferred active ISA and one third preferred passive. ISA was described as having the potential to reduce road crashes, improve speed compliance, protect vulnerable road users, and change ingrained speeding behaviours. Concerns around ISA included technical inaccuracies, reduced driver control, driver restrictions and system complexity.
One strategy that could accelerate ISA acceptability with fleet drivers and the wider public is addressing misconceptions regarding ISA. For example, there are system fail-safes in place that ensure that if GPS signal is lost and if the posted speed limit cannot be established the ISA device will default to either no limit or to a preset top speed. In addition, some drivers unfamiliar with the technology may assume that the ISA device will suddenly brake as their vehicle enters a new speed limit zone. However, current active ISA devices only reduce acceleration, causing vehicles to coast down to the enforced speed without braking. The current NYC ISA pilot could be useful in providing real-world context to the public on how the devices work to assist drivers and address concerns and misconceptions surrounding the technology.
4.3 Limitations and future research
Although the current study was the first wide-scale evaluation of ISA devices in a public fleet in the United States, there are limitations to the evaluation. First, speeding data were analysed on a vehicle-by-vehicle basis, not a driver-by-driver basis. Although drivers typically drive the same vehicles every day, there are occasions when a driver may use a different vehicle (e.g., their usual vehicle is in maintenance). Therefore, we can only draw associations between ISA installation and the vehicles. Future research could examine the influence of individual factors (e.g., age, driving experience, job function) on the reduction of speeding seen with ISA.
Second, the pilot was limited to driving conducted within New York City. Different patterns or results may be seen in other areas of the United States, specifically areas with more rural or highway driving and less traffic congestion that would present more opportunity to speed. Given that this was a naturalistic study, routes were not controlled and it is possible that there was variability in terms of how the ISA groups and control groups drove in terms of routes and job functions.
Third, the pilot only examined one enforced speed threshold chosen by NYC DCAS to maximize buy-in: 11 mph (later reduced to 10 mph) above the posted speed limit. Future deployments of ISA, both in NYC and beyond, would benefit from focus on identifying the “sweet spot” for enforced speed limit relative to the posted speed limit. As noted previously, one approach may be to make the enforced speed limit a proportional threshold, in other words, based on a percentage of the posted speed limit. Multiple configurations could be compared, and the effects on speeding and user acceptance could be measured. To maximize safety benefits, it may be optimal to design enforced speed parameters that both minimize severe speeding and are sufficiently accepted by drivers to ensure consistent use.
Another important component of ISA that has not yet been studied is establishing factors that influence driver buy-in and use of the device. While some fleet managers may be able to take a top-down approach in having ISA installed, ensuring that drivers understand the benefits of ISA may lead to quicker and more seamless adoption. Training type and duration is another factor that may influence ISA use and acceptance. In addition, future studies could be conducted on establishing the effect of an ISA-enabled vehicle on the surrounding traffic environment. While the current deployment scale in the hundreds of vehicles is unlikely to measurably affect the prevailing speed of traffic citywide, scaled-up implementation of ISA in fleet vehicles could affect traffic patterns and prevailing speeds. Traffic simulation models could be used to determine if fleets in NYC or elsewhere would be able to change corridor, neighbourhood, city, or regional speeding patterns on their own, and what speeds the ISA vehicles would need to travel to produce that effect.
4.4 Conclusion
In the current pilot, active ISA-enabled NYC fleet vehicles were shown to have nearly two-thirds less drive time speeding at severe speeds (>11 mph) compared to before the device was installed. This effect was not seen in control vehicles that did not have ISA installed. This reduction in severe speeding persisted even in vehicles associated with habitual speeders. The present study suggests that active ISA is a feasible and effective intervention to reduce risky driving behaviours. Future research should focus on factors that lead to successful ISA implementation in fleets (both public and private) and optimal speed thresholds and override parameters that enhance safety while still ensuring driver buy-in and use.
Acknowledgement
The authors wish to thank New York City (NYC) Department of Citywide Administrative Services (DCAS) Commissioner Yume Kitasei, DCAS Deputy Commissioner and NYC Chief Fleet Officer Keith Kerman, Fleet Safety Supervisor Nathaniel Koszer, Executive Director of Fleet Systems Alfredo Melian, Director of Fleet Office of Realtime Tracking Matthew Aronberg, Director of Field Operations Gary Prasad, Senior Fleet Analyst Dilshad Basheer, and Fleet Analyst Tyler Thomas for sponsorship of and feedback on the work.
Competing interests
The authors report no competing interests.
CRediT contribution
Alexander K. Epstein: Conceptualization, Funding acquisition, Methodology, Supervision, Writing—original draft, Writing—review & editing. Sarah Yahoodik: Formal analysis, Methodology, Writing—original draft, Writing—review & editing. Alyssa Brodeur: Writing—original draft, Writing—review & editing. Juwon Drake: Formal analysis, Software. Tomomi Landsman: Data curation, Formal analysis, Software, Visualization, Writing—review & editing.
Ethics
The study is exempted from requiring an ethical approval based on:
-
De-identified/anonymized secondary data. Secondary analysis of existing datasets (Geotab telematics) where individuals cannot be identified and no re-identification is possible under the investigator’s access terms.
-
Quality improvement (QI)/program evaluation. Internal QI or program evaluation designed for safety improvement rather than generalizable research may be exempt or not human-subjects research depending on intent and planned dissemination.
Funding
This research was funded by the New York City Department of Citywide Administrative Services (NYC DCAS).
Generative AI use in writing
The authors declare that no generative AI or AI-assisted tools were used in this work.
Prior dissemination
An earlier version of this paper was presented at the CARSP/ICTCT conference, held in Québec city, Canada, on 20–23 May 2025.
An earlier version of this work was also published as a government report DOT-VNTSC-NYC-24-02.
Editorial information
Handling editor: Stijn Daniels, Transport & Mobility Leuven, Belgium | University of Leuven, Belgium.
Reviewers: Attila Borsos, Széchenyi István University, Hungary; Oliver Carsten, University of Leeds, the United Kingdom.
Submitted: 27 August 2025; Accepted: 4 March 2026; Published: 13 March 2026.