A framework for reliable traffic surrogate safety assessment based on multi-object tracking data
Abstract
Multiple object tracking (MOT) systems enable the recording of traffic situations and the movements of road users in high detail. These data form the basis for safety-related analyses such as surrogate safety assessment (SSA), which often involves detecting, quantifying, and analysing conflict situations. Due to the rarity of actual conflicts even occasional data errors can significantly affect SSA outcomes. Consequently, high-quality data are essential. However, a gap remains between MOT and SSA research, particularly regarding the impact of data quality on the reliability of SSA results. This study addresses that gap by proposing a framework that explicitly accounts for the effects of data quality to ensure reliable SSA outcomes. Since it treats the data-generating MOT system as a black box, the framework can also be applied by practitioners using historical datasets or in cases of restricted access to the MOT system. Using the surrogate safety measures (SSMs) time-to-collision (TTC) and post-encroachment time (PET), we illustrate how data inaccuracies affect conflict detection and show how the proposed framework can reveal critical data limitations. We also demonstrate its ability to identify the need for data correction methods and to analyse the effects of such methods on SSA outcomes. Finally, our findings underline the importance of scenario-specific data evaluation for ensuring reliable SSA results and suggest that robustness against data inaccuracies should be considered a key criterion when selecting SSMs.
1. Introduction
1.1 Motivation
Roadside multiple object tracking (MOT) systems have proven capable of capturing the movements of all road users in great detail. These data are used in various traffic research applications. For example, MOT systems can enhance infrastructure-to-vehicle communication by providing extended perception or real-time warnings about dangerous situations (Jandial et al., 2020; Shi et al., 2022; Vignarca et al., 2023). Furthermore, the large volume of high-resolution trajectory data allows researchers to conduct behavioural and safety analyses, such as surrogate safety assessment (SSA). SSA involves the use of surrogate safety measures (SSMs) to estimate conflict risks based on observed movements. Given the rarity and underreporting of actual crashes, SSA provides a useful alternative or complement to accident-based analysis (Johnsson et al., 2018).
Multiple factors contribute to the reliability of SSA, including the suitability of the selected SSMs for capturing the critical characteristics of conflict situations, as well as the validity of their relationship with actual crash occurrences. Most importantly, however, the reliability of SSA depends on the quality of the underlying data: Unless the input data meet the requirements of the chosen SSMs, even a well-designed assessment may yield misleading results.
Although MOT is closely linked to traffic safety research through its practical applications, Abdel-Aty et al. (2023) note that video processing (or computer vision, in a sensor-agnostic sense) and traffic safety modelling remain largely separate research domains. Their review paper aims to provide guidance across both fields, focusing on computer vision techniques and surrogate traffic safety indicators. Yet, one critical question remains broadly underexplored across the combined literature of both fields: How can practitioners and researchers evaluate the suitability of MOT data for specific SSA scenarios and determine whether preprocessing or correction methods can improve the reliability of results?
While MOT research prioritises algorithm development and generic benchmarking, traffic safety research is concerned with application-specific data reliability. A general validation of an MOT system does not automatically translate to a specific installation. Factors such as sensor placement, mounting height, distance, or occlusion may vary significantly, affecting data quality at the site level. Even minor inaccuracies in MOT data can significantly distort the calculated values of SSMs and consequently SSA outcomes, especially in dense traffic situations. Due to the rarity of actual conflicts, even occasional errors can have a disproportionate effect. Therefore, scenario-specific data validation is essential—especially since different SSA approaches may prioritise different aspects of data quality. This work addresses precisely this gap by proposing a framework for conducting reliable SSA that includes application-specific data quality evaluation.
1.2 Objectives
The main goals of this work are to highlight the importance of assessing MOT data quality in the context of SSA, to discuss the related challenges, and to propose and test a suitable process for ensuring the reliability of SSA outcomes. In particular, we aim to examine whether preprocessing or correction methods can mitigate quality-related issues and how their impact on SSA outcomes can be systematically evaluated.
Since SSMs differ in how strongly they rely on motion attributes such as speed or heading, their susceptibility to typical MOT artefacts varies. Understanding these differences is essential for determining which SSMs can be applied reliably given the data quality of a specific installation.
In many cases, the underlying MOT systems are inaccessible to practitioners—especially when working with existing or historical datasets. For this reason, the proposed process treats the MOT system as a black box and relies solely on the data it produces. It can therefore be applied to data from any MOT system, regardless of the specific sensor technology, processing algorithms, or environmental conditions of the installation. In its presented form, the process requires information on object bounding boxes in addition to object positions for visualisation. Other requirements only originate from the specific SSA approach to be evaluated, e.g., the existence of specific motion attributes or the frequency of measurements. The process assumes that data are produced by a generally functioning MOT system, i.e., that objects are detected and tracked correctly in most cases. It is not applicable for evaluating the overall performance of an MOT system, such as its detection or tracking accuracy, but rather serves as an extension for assessing data quality with respect to a specific SSA application. The process is designed as an iterative procedure that enables the repeated adaptation of data correction techniques and their evaluation with respect to SSA outcomes.
Our work focuses on data from MOT systems that are typically installed at specific locations of interest. Arun et al. (2021) report that approaches building on traffic conflicts defined via the proximity of road users are most appropriate for such facility-based SSAs. Therefore, the proposed process is implicitly designed for proximity-based SSMs and tested accordingly.
Specifically, this work provides answers to the following research questions:
Q1: How can practitioners effectively evaluate MOT data quality for a specific SSA scenario when the MOT system is treated as a black box?
Q2: How does the robustness of proximity-based SSMs to MOT data imperfections influence their suitability for reliable SSA in real-world applications?
Q3: How can data correction methods be systematically evaluated for their effectiveness in improving SSA reliability?
Q4: Which types of data inaccuracies can be effectively mitigated using existing data correction techniques?
The core of this work is the proposed process, explicitly addressing research questions Q1 and Q3. Although not the primary focus, research questions Q2 and Q4 are addressed through insights derived from applying this process to real-world data, thereby extending our understanding of the practical implications of data inaccuracies and correction methods in SSA.
Section 2 summarises related work on the reliability of SSA and on the evaluation of MOT data quality. In Section 3, we propose a process for reliably conducting SSA based on MOT data while treating the data generating system as a black box. Section 4 reports on the experimental application of the proposed process to a real-world dataset that shows the need for application-specific quality evaluation as well as the practicability and usefulness of the process. Section 5 concludes the work by summarising the results in relation to the research questions outlined above.
2. Related work
In the following discussion of related work, we focus on two main topics. First, which aspects contribute to the reliability of SSA and how are they addressed in traffic safety research. Second, how is the data quality aspect addressed in the computer vision and MOT research fields. For the former, we mainly refer to three survey papers (Abdel-Aty et al., 2023; Arun et al., 2021; Johnsson et al., 2018), that already summarise the comprehensive literature that addresses various aspects of SSA.
2.1 Reliability of surrogate safety assessment
Several aspects affect the reliability of SSA and need to be considered in any application:
Choice of surrogate measures:
Various SSMs have been proposed in the literature over several decades designed to address very specific settings or designed as universally applicable measures (Johnsson et al., 2018). Considerations on the suitability of SSMs include differences in road geometry—leading to different causes and characteristics of conflicts, differences in the conflict types—especially longitudinal conflict risks in car-following scenarios versus lateral conflict risks in crossing or angled situations, and differences in traffic conditions (Abdel-Aty et al., 2023).
Moreover, different measures capture different aspects of a situation. SSMs based on evasive actions, such as decelerating or swerving, will miss critical situations in which road users did not take any action. Zheng et al. (2014) argue that many crashes happen without any evasive action. Conversely, outcome-focused measures, such as some proximity-based ones, might under-report the criticality of a situation because strong evasive actions reduce the criticality of the outcome but are not considered by the measure (Johnsson et al., 2018).
Johnsson et al. (2018) state that while various indicators capture different dimensions of traffic risk, no single measure can capture all relevant aspects. Consequently, the choice of a suitable SSM or combination of measures needs to depend on the concrete scenario and objective of the analysis. If the wrong characteristics of traffic situations are analysed because the wrong measures have been selected, SSA outcomes might not be reliable.
Previous research such as Lu et al. (2021) has also investigated the robustness of various SSMs against data imperfections. To the best of our knowledge, however, robustness is usually not considered as a selection criterion for SSMs.
Threshold selection:
While SSMs usually operate on a continuous scale, practical applications often require a binary classification of situations as either safe or critical. The choice of thresholds will impact the reliability of SSA outcomes. Thresholds vary widely across studies—even for the same SSM in similar scenarios (Johnsson et al., 2018). This has led to efforts to empirically determine appropriate threshold values. Various approaches have been proposed, as summarised in the review paper by Arun et al. (2021). However, the authors warn about relying on any kind of correlation with historical crash data, given concerns over the quality of such data. Based on reviewed literature, Abdel-Aty et al. (2023) provide a table of preferred thresholds for seven common SSMs distinguishing intersection and freeway scenarios.
Validation of SSMs as risk predictors:
As stated above, different SSMs address different characteristics of traffic situations and road user interactions. Even though these measures per se can provide valuable insights, their ultimate purpose is to serve as surrogates for actual risk. Here, Johnsson et al. (2018) distinguish between crash risk and injury risk, leading to an additional aspect of SSA: Should the objective be to estimate the risk of any type of crash regardless of severity or to estimate the risk of (severe) injury? In either case, the validity of SSMs as risk predictors contributes to the reliability of SSA outcomes.
A large body of work attempts to validate SSMs by comparing them to crash statistics or near-crash datasets. Arun et al. (2021) categorise validation strategies into three groups:
correlation with observed crash frequency,
variance analysis of observed and estimated crashes, and
comparisons using crash modification factors.
Johnsson et al. (2021) propose a relative validation approach that avoids the need for crash data. Sengupta et al. (2024) use statistical and machine learning models to predict expert-confirmed conflicts based on post-encroachment time (PET), road user behaviour, and environmental variables. This model-based approach offers an alternative approach to SSM validation: If such a model demonstrates strong predictive power, the combination of variables can be seen as a crash surrogate, subject to the theoretical relationship between the subjective expert-definition of conflicts and crashes. Nikolaou et al. (2023) highlight that different types of road users should be distinguished when validating the relationship between SSMs and crashes.
Subjectivity in traditional methods
Johnsson et al. (2018) state that it has historically been common to use subjective components and trained observers in SSA and that these pose the most apparent reliability concern. Additionally, such approaches cannot be adopted in automated systems. As this work focuses on MOT-based SSA, we will not further elaborate on the topic and refer the interested readers to Johnsson et al. (2018).
Quality of automated data collection
MOT systems, in contrast, enable automated and objective facility-based observation of traffic dynamics. However, the effects of data quality on the reliability of SSA outcomes are rarely discussed in the literature.
Abdel-Aty et al. (2023) discuss general issues in video-based trajectory data generation and suggest to carefully examine trajectory data prior to SSM calculation. However, their review paper does not address concrete effects of data errors on SSA outcomes or which methods could be used to examine the quality of a given data set with respect to a particular SSA approach.
Rath et al. (2024) compare the detection quality of LiDAR-based and video-based MOT systems in the context of safety assessment involving vulnerable road users (VRUs) but do not actually compare the calculated SSMs between the sensor types. Hence, the effects of data quality on SSA remain unclear.
Moreover, several works exist that calculate SSMs from MOT trajectories in practical applications but do not specifically evaluate the quality of the data used with respect to the particular application or do not report on it (Darzian Rostami et al., 2020; Huang & Chen, 2025; Mansell et al., 2024; Puscar et al., 2017; Xing et al., 2019).
A lack of attention on the data quality topic in the review papers on SSA and in our own literature search suggest that evaluating the quality of an MOT trajectory dataset in the context of a specific SSA approach poses a major research gap, even though application-specific data validation is important, as motivated in Section 1.1. It seems that traffic safety researchers often assume that the available data are of sufficient quality for SSA, or that future improvements in sensing will resolve existing issues. Hence, the research focus of SSA remains on the methodological part rather than on the necessary data. Computer vision researchers, in turn, focus on the general quality of MOT systems, rather than evaluating whether the output trajectories are suitable for a specific application such as SSA (see Section 2.2).
Following these insights from related work on SSA reliability, our work focuses on how a reliable SSA can be conducted given an MOT dataset and a scenario of interest. We consider the selection of suitable SSMs and thresholds, and especially the validation of data quality.
2.2 MOT data and quality
The literature on MOT data quality can be separated into two main strands. First, how are MOT algorithms and systems evaluated and benchmarked in general, and second, how are particular installations and datasets evaluated in practice.
The evaluation of MOT algorithms is typically conducted by comparing the objects detected and tracked in a sequence of frames (images or point clouds) to a ground truth (Jiménez-Bravo et al., 2022). Various metrics exist to measure accuracy, precision, completeness and robustness of object detection and tracking (Luo et al., 2021), but these generic metrics do not necessarily reflect the specific data quality requirements of SSA applications. They typically consider the existence, location and size of bounding boxes around objects or their centre points and the stability of object identification along a sequence. However, they often do not consider speed, acceleration or heading angle directly. The latter, however, might be particularly relevant for the calculation of SSMs. The nuScenes detection task benchmark (nuScenes, 2025) is an example that does include metrics on additional object attributes including speed and heading angle.
The relevance of ground-truth-based metrics and benchmarks for the practical use case of ensuring reliable SSA is limited: On the one hand, the concrete installation of an MOT system for a specific SSA application might be subject to challenging effects such as occlusion or large sensor distances (Anuj & Krishna, 2017). Consequently, sufficient data quality for SSA cannot be guaranteed by previous benchmarking or validation of the MOT system, but depends on the concrete installation. On the other hand, validation of the MOT system and the data quality of a specific installation might not be practical due to high overhead for ground-truth-labelling objects. Moreover, raw frame data are often not available in practice, particularly in the case of historical or externally provided datasets.
Some studies have attempted to evaluate trajectory data quality while treating the MOT system as a black box. For example, Punzo et al. (2011) propose approaches based on jerk analysis, platoon consistency, and spectral characteristics—mainly in the context of traffic flow modelling. These methods check for physical plausibility rather than absolute correctness. However, it remains unclear whether these methods can sufficiently evaluate data quality in the context of SSA.
Zhao et al. (2023) suggest using SSMs such as stopping sight distance and PET to detect abnormal interactions based on the assumption that these anomalies are caused by data errors. However, since their approach may inadvertently flag actual conflicts as anomalies, relying solely on their method would not be sufficient in an SSA context—where accurate conflict detection is the primary goal, rather than solely an indicator of data quality. Thus, additional analytical steps are necessary to reliably differentiate between genuine safety-critical events and data-related artefacts.
To the best of our knowledge, no practical method exists for validating the quality of MOT trajectories for a specific SSA approach. This paper therefore proposes a practical, trajectory-based approach for assessing whether the quality of MOT data is sufficient for use in SSA—while treating the generating MOT system as a black box. It is not intended as a replacement for general system validation, but rather as a complementary, application-driven evaluation method.
Before concluding this section, we want to note that data artefacts could be minimised by deploying only high-end systems and carefully calibrating installations in principle. Yet this is not always feasible—especially when analysing historical data or working under budget constraints. If suitable methods for identifying and mitigating SSA-relevant data errors were available, even less precise datasets could still be usable.
3. Method
3.1 Overview
Figure 1 shows the main steps of our method and how they are connected. We assume a safety-relevant scenario of interest and data from MOT to be given. We define a "scenario" narrowly as a specific type of interaction between road users at a given part of the road infrastructure. For example, we would distinguish car-following interactions and lane-merging interactions as two distinct scenarios, even if they occur on the same highway section. This is because different types of interactions or different parts of the road infrastructure might require different SSMs and, even if the same SSMs are suitable, we want to evaluate the reliability of outcomes separately.

First, suitable SSMs must be selected that capture safety-relevant aspects of traffic situations relevant in the scenario. A large body of literature is available discussing various measures, which aspects they are able to capture, and in which environments they can be applied.
Second, data preprocessing steps (see Section 3.2) might be necessary, depending on both the data themselves and the selected SSMs. This includes the handling of erroneous data as well as deriving attributes necessary for the calculation of the chosen SSMs. Moreover, the selection of scenario-relevant trajectories is a necessary preprocessing step. Since MOT systems capture all objects in a scene, it is essential to identify and extract only those that are relevant to the scenario.
After preprocessing, SSMs can be calculated and their histograms analysed (see Section 3.3), before defining conflict situations based on the SSMs. Conflict definition should consider the large body of literature from previous works to utilise the knowledge they provide. However, the distribution of SSM values in the particular scenario should also be considered to address potential application-specific effects that could emerge from subtle differences between the particular scenario and the scenarios in the literature. Note that conflicts can be defined based on a single SSM, or a composite definition involving multiple SSMs can be applied.
The final step of the proposed method is to analyse the detected conflicts with respect to data quality issues that may affect the reliability of the outcomes. We propose a visual-analytics-based approach for this task (see Section 3.4). Each iteration of the process ends with one of the following outcomes:
Results indicate that data quality does not affect conflict detection. Data quality is satisfactory and SSA outcomes are reliable.
Results indicate the need for improved data preprocessing to address data quality issues. Then a concept has to be developed and changes to the data preprocessing step have to be made accordingly, before starting another iteration of the analysis process.
Results indicate that major data quality issues exist to the extent that correction methods are unlikely to raise the reliability of results to a satisfactory level. The dataset is not suitable to reliably conduct SSA in the given scenario.
In the following sections, we will elaborate the key steps of the proposed method in more detail.
3.2 Application specific preprocessing
Most preprocessing steps depend on the requirements of selected SSMs, the characteristics of MOT data, and potentially the findings from previous iterations of the proposed process. However, there is one important general task to be discussed: selecting scenario relevant data from the whole scene that an MOT system has captured. Particularly at intersections, trajectories of vehicles and road users that are not involved in the targeted interaction scenario may frequently intersect or overlap spatially with relevant trajectories, which complicates their separation. Additionally, incomplete or fragmented trajectories add another layer of difficulty to this task. We will discuss two approaches for isolating scenario-relevant trajectories: geo-fencing and clustering.
Using geo-fencing, geographic areas can be defined that relevant trajectories will intersect, i.e. some points of the trajectories are contained within the geo-fences. To isolate left-turning vehicles at an intersection, for example, one area at the entrance to the intersection and one area at the exit of the intersection will be sufficient for selecting the relevant trajectories. Depending on the scenario, more complex combinations of geo-fences might be required to isolate relevant trajectories correctly. However, a significant drawback of geo-fencing is that it relies strictly on spatial intersections with predefined zones. Consequently, incomplete trajectories—where an object is temporarily not tracked or is missed due to occlusion—may not fulfil the intersection criteria with all geo-fenced zones, resulting in their unintended exclusion from the analysis. This unintended exclusion may mask important tracking errors or biases that would otherwise be relevant for assessing data quality.
For clustering-based selection, trajectories are grouped together based on their spatial similarity, forming clusters that represent common movement patterns. A suitable distance metric to quantify trajectory similarity is the Dynamic Time Warping (DTW) distance (Berndt & Clifford, 1994), which accounts for variations in speed and timing along the trajectories. Similarity is therefore based on the shape of the trajectory paths rather than speed profiles. As a clustering mechanism, we suggest Affinity Propagation (Frey & Dueck, 2007), which identifies exemplars among the trajectories and forms clusters of similar trajectories around these exemplars without requiring the number of clusters to be specified in advance. This is particularly advantageous when the number of distinct movement patterns is unknown beforehand. Cluster exemplar trajectories can then be visualised on a map of the intersection to select the clusters—and consequently the trajectories—relevant for the scenario of interest, i.e., those clusters that represent trajectories corresponding to the targeted interaction scenario. This clustering approach therefore mitigates the risk of excluding incomplete trajectories because trajectories are clustered based on spatial similarity instead of strict spatial intersections with predefined areas. Even partial trajectories may still be correctly associated with their intended cluster or may form their own distinct cluster if incomplete trajectories occur frequently, making them easier to identify and analyse separately. The clustering approach, however, is computationally much more expensive than geo-fencing.
Given these distinct strengths and limitations of geo-fencing and clustering, we recommend a preliminary comparison of both approaches using a representative trajectory subset. If the results of both methods align closely, geo-fencing can be employed due to its simplicity and computational efficiency. If results differ significantly, clustering would provide a more robust, albeit computationally more intensive, alternative.
3.3 SSM histogram analysis
The motivation for analysing frequency histograms of calculated SSM values is two-fold: (i) to detect potential data quality issues, and (ii) to support the definition of conflict thresholds.
Investigating the distribution of SSM values represents a straightforward initial step to assess data quality specifically within the SSA context. Although raw trajectory data alone may not immediately reveal data artefacts, these can become apparent through unusual histogram shapes or an unusually high frequency of extremely low SSM values. Such initial screening is highly practical because it requires minimal analytical effort and quickly highlights potential issues needing further investigation. However, reliably interpreting these histograms remains challenging because the expected or natural shape of the distributions of a particular SSM in a particular scenario may not have been sufficiently discussed in existing literature. Moreover, critical SSM values are the analysis target in the context of SSA. Hence, using them as a quality indicator could be misleading in some cases. Therefore, conclusions need to be drawn cautiously and backed up by subsequent analysis.
In addition to screening for data quality, investigating the distribution of SSM values can inform the subsequent task of defining suitable thresholds for conflict detection. In literature, various SSM thresholds are suggested, often spanning broad ranges even within similar contexts (Arun et al., 2021). Analysing histograms of calculated SSMs for the specific application scenario provides valuable empirical context for threshold selection, complementing existing literature recommendations. For instance, clear peaks or distinct troughs separating different severity levels in the histogram may guide an empirically informed threshold choice (Yang et al., 2018). Yet, given potential uncertainties regarding typical distribution shapes for a particular scenario, such empirical thresholds should be interpreted carefully. Thus, the histogram analysis supports threshold definition, but should not be used as the sole basis for threshold selection.
3.4 Visual-analytics-based analysis of conflicts
The main objective of this step is to assess the reliability of SSA with respect to data quality. The proposed approach is based exclusively on MOT data, requiring no additional knowledge about the MOT system itself. This enables its application to historical or externally provided datasets, for which the internal structure or parameters of the data-generating system are unknown—that is, the system is treated as a black box. It is important to note that this step does not assess whether a specific SSM is appropriate for capturing traffic conflict risk in general. At this step, we assume that a suitable SSM has already been selected. Instead, the focus lies on evaluating whether the quality of the (preprocessed) data is sufficient to calculate the selected SSMs reliably.
In the absence of ground truth, the method relies on visual inspection and expert judgement. This approach builds on the principle that visual representations can support analytical reasoning by exposing patterns, inconsistencies, and errors in a way that leverages human perceptual strengths. The core idea is to evaluate a representative subset of detected conflict situations and determine how many of them are false positives caused by data errors. Based on this, the data-induced bias in SSA outcomes can be estimated.
The evaluation process consists of the following steps:
Select a representative subset of detected conflicts.
Visualise the selected conflict situations, including all attributes relevant to SSM computation.
Manually inspect each situation to determine whether a critical SSM value was due to a data error (false positive), and, if so, document the error type.
Calculate the false discovery rate (FDR), i.e., the proportion of false positives among all detected conflicts.
If the FDR is acceptably low, the dataset may be considered sufficiently reliable for SSA using the selected SSM. If not, either the data must be improved (e.g. preprocessing and correction methods), or the dataset is not suited for SSA.
In the following sections, we elaborate on the key concepts that underpin this step.
3.4.1 Representative subset
When working with large datasets, a manual evaluation of all situations is generally impractical. Therefore, a subset of the data must be selected for inspection. This subset should be representative, such that the results of the manual evaluation can be generalised to the entire dataset.
A key consideration is the temporal distribution of traffic conditions. For example, traffic density and composition vary throughout the day, which may affect both the occurrence of conflicts and the likelihood of data artefacts. To account for this variability, one suitable sampling strategy is to select short time intervals distributed evenly across the day—for instance, the first ten minutes of each hour. This ensures that the selected subset captures a representative range of traffic conditions and sensor states, while keeping the volume of data at a manageable level for manual analysis.
3.4.2 Selection of relevant situations
A major challenge in SSA reliability evaluation is the rarity of traffic conflicts. Without prior filtering, manual review would require analysing a vast number of situations—the majority of which are non-critical. To address this, we propose focusing the evaluation on those situations that fulfil the previously defined conflict criteria. In other words, we evaluate the positives: situations for which SSMs indicate a conflict. This strategy enables us to assess how many of the detected conflicts are in fact false positives caused by data artefacts. It enables the calculation of the FDR, which can serve as an indicator of SSA input data reliability.
However, this approach has an important limitation: It does not account for false negatives, i.e., actual conflicts that remain undetected due to data errors. We acknowledge this limitation and argue that in many real-world cases, false negatives are typically less impactful than false positives. To illustrate the structural effect of rare-event detection under uncertainty, consider a hypothetical case: Assume the probability of an actual conflict between any two objects is 0.01, and the probability of a severe data error that alters the conflict classification is also 0.01. Then:
The probability of a false positive = 0.99 × 0.01 = 0.0099
The probability of a false negative = 0.01 × 0.01 = 0.0001
In this example, false positives are 99 times more likely than false negatives, and their frequency is almost as high as that of true positives. The example assumes symmetric error probabilities and is not based on empirical data. Rather, it is intended to illustrate a general principle: When the event of interest is rare, even modest error rates can lead to a disproportionately high number of false positives. While we do not claim that false positives are always more frequent than false negatives in real-world settings, they are more accessible for systematic evaluation in the absence of ground truth. False positives manifest as observable artefacts, whereas false negatives remain inherently undetectable unless confirmed by external data.
False negative conflicts can occur if the MOT system fails to detect or track objects involved in a conflict, leading to their absence in the dataset. Therefore, general functionality of the MOT system is a prerequisite for applying the proposed process. Moreover, false negatives may arise if data inaccuracies cause SSM values to be overestimated, resulting in actual conflicts being classified as non-critical situations. Depending on the SSM used, such inaccuracies may include overestimated distances or imprecise relative speeds between objects. Most such inaccuracies in relevant attributes are caused by imprecise object localisations, which in turn are typically caused by imprecise bounding box annotations due to sensor limitations or occlusions.
We therefore focus our analysis on quantifying false positives as a pragmatic and analytically feasible proxy for assessing the reliability of SSA results.
3.4.3 Visualisation and manual evaluation
The proposed process relies on visual inspection of selected conflict situations in order to detect substantial data errors. To make this practical and reliable, all attributes relevant to the SSM, such as object position, size, orientation, and speed, must be shown in the visualisation. We propose to reconstruct each object's bounding box from its reported position, heading angle, length, and width. By visualising all objects per time step and reviewing sequences of frames in temporal order, we can reconstruct how the MOT system perceived the situation. This may reveal anomalies that are not easily identifiable through numerical inspection. Tools such as QGIS’s Temporal Controller allow for automated or step-wise visual playback of time-referenced geospatial data. Additional attributes (e.g. speed) can be displayed as text labels per object and timestamp.
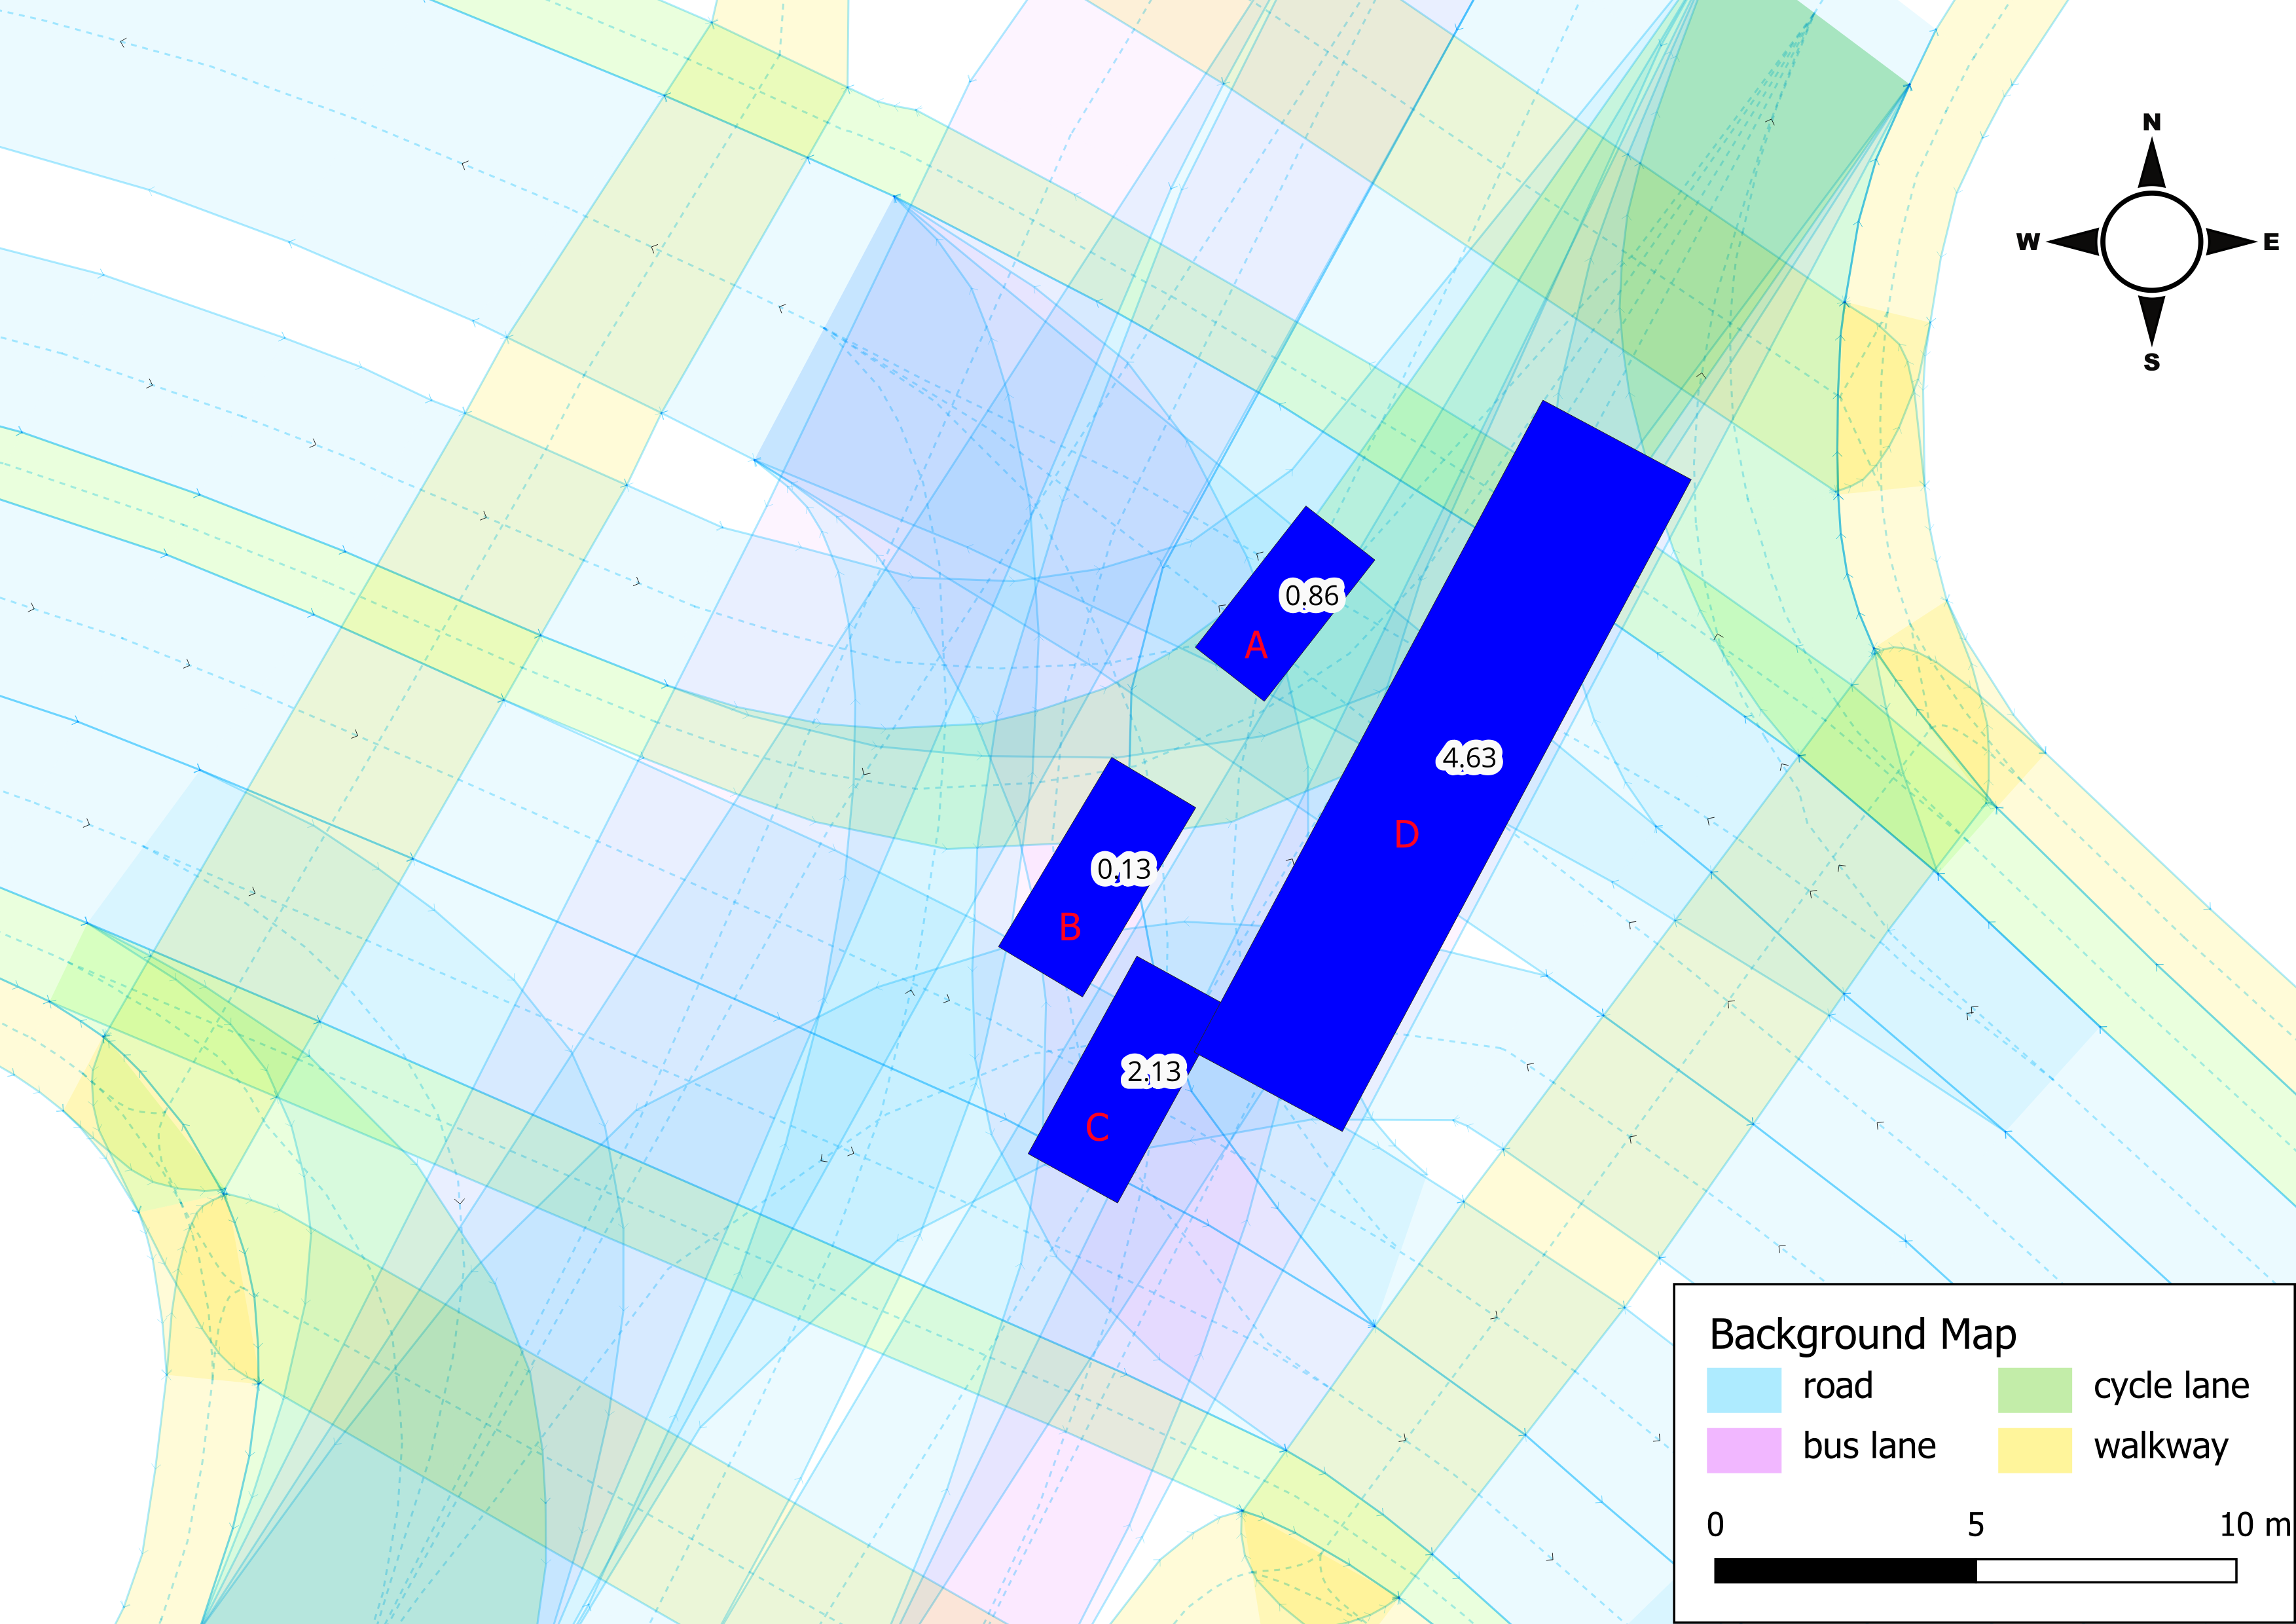
Figure 2 shows an example of such a visualisation. Vehicles A and B approach from the top-right and have a longitudinal collision risk while waiting to turn left. Vehicles C and D travel from the bottom-left to the top-right while C lets D merge. According to the perception of the MOT system, they collide. The speed of the objects (in $m/s$) is shown in text labels. A map of the intersection with lane-type semantics is used as background, depicting lanes for regular traffic in blue, cycle lanes in green, walkways in yellow, and bus lanes in pink.
To ensure reproducibility and objectivity, we define the following criteria to determine whether an identified conflict is a true positive or an artefact caused by data inaccuracies:
Position plausibility. Sudden unrealistic jumps or inconsistent positions of objects across consecutive frames (e.g., objects appearing to abruptly teleport).
Speed plausibility. Physically implausible acceleration or deceleration between frames, such as sudden drastic changes in speed that exceed realistic vehicle dynamics.
Heading consistency. Sudden or unexplained changes in the orientation of objects, inconsistent with their surrounding trajectory.
Object dimension consistency. Clearly incorrect bounding box dimensions or significant changes in object size within short time intervals.
Tracking consistency. Frequent disappearance and reappearance of objects without plausible explanations, suggesting fragmented tracking.
A conflict situation is classified as a data error (i.e. a false positive) if one or more of these criteria clearly indicate unrealistic or physically impossible object movements or characteristics. Situations are marked as suspicious if data anomalies are subtle, ambiguous, or near the threshold of plausibility, making it difficult to draw a definitive conclusion without further information. This enables a more nuanced diagnosis of borderline cases and supports later detailed investigation and interpretation. If none of these criteria indicate an issue, the conflict is considered genuine from a data quality perspective. It is important to emphasise that the visual evaluation focuses exclusively on assessing the plausibility of the data and does not involve subjective assessments of conflict severity or actual collision risk. This distinction is critical: We do not question the SSM or its threshold, but rather whether the data quality undermines its meaningfulness in that instance.
Visual inspection primarily requires clearly defined attributes that can be systematically evaluated, as listed above. These attributes are explicitly visualised per timestamp, enabling structured assessment. Nonetheless, the evaluation additionally benefits from the natural capability of human perception to quickly recognise unusual patterns and anomalies. Thus, while the predefined criteria ensure objectivity and reproducibility, human evaluators can still effectively identify subtle data inconsistencies or novel error patterns that may not fit neatly into the predefined categories. Any such additional findings, however, should be carefully documented and explicitly justified to maintain transparency.
While the approach involves manual judgement, it differs fundamentally from traditional subjective conflict assessment involving human observers. The goal is not to evaluate the severity or risk of a situation, but to determine whether the SSMs are supported by the underlying motion data. Because the evaluation is grounded in observable attributes, such as position, speed, and bounding box continuity, it remains transparent and reproducible within the scenario. This form of subjectivity is deliberate and structured, and helps reveal data artefacts that automated methods may overlook.
4. Experiments and results
In this section, we report on the application of the process proposed in Section 3 to a real-world use case. Its structure follows Figure 1.
4.1 Scenario and data
We analyse a signalised four-leg urban intersection in Salzburg, Austria, focusing on a permissive left-turn situation in which vehicles approach the intersection from the north, turn left, and must yield to through traffic coming from the south (see Figure 3). Although signalised, this situation still poses conflict potential since left-turning and through-moving vehicles receive green signals simultaneously. We conduct SSA for three specific scenarios:
lateral scenario (LAT): the interaction between one left-turning road user and one road user going straight potentially has a lateral collision risk.
straight-through following scenario (STF): the interaction between two road users going straight potentially has a longitudinal collision risk.
left-turn following scenario (LTF): the interaction between two road users turning left potentially has a longitudinal collision risk.

Several roadside LiDAR sensors (HESAI Pandar XT32), operated via the SensR perception software, are installed at the intersection to detect and track road users. The resulting object information is transmitted to a cloud-based processing platform in near real time, where it is assembled into point-trajectories—each point of which contains additional object attributes. Due to the real-time nature of the system, attributes such as object class or bounding box size may vary within a single trajectory. The dataset used for this work covers one full week, 05–11 August 2024.
Data from objects passing through the central interaction zone of the intersection are considered for subsequent analysis. We refer to this area as the area of interest (AOI), which can be seen in Figure 3. It is covered by three LiDAR sensors from different angles, which reduces occlusion effects and enables high-quality motion data. The sensors are installed at a height of approximately 4.5~m above the ground at a 20° angle. Their position is shown in Figure 3. Note that data quality could be further enhanced by using more sensors and integrating additional sensor modalities, such as cameras. However, the main purpose of the dataset within this study is to demonstrate the proposed process for assessing SSA reliability rather than to achieve the highest possible data quality. The available data from the AOI are especially suited to support analysis of the lateral scenario, which is our primary focus. Regarding longitudinal collision risks at the intersection, the AOI does not include the potentially relevant area in front of the traffic signals where dilemma-zone-related conflicts could occur. However, due to yielding to oncoming traffic in the left-turn following scenario and due to spillback effects in the straight-through following scenario, deceleration events occur within the AOI posing a risk of longitudinal collisions that is worth assessing.
4.2 SSM selection
Although various SSMs are suitable for our scenarios, we select two widely used measures for demonstrating the proposed methods: PET and time to collision (TTC).
4.2.1 Time to collision
TTC describes the time remaining until two objects would collide if they continued on their current paths while maintaining constant speed and heading (Hayward, 1971; Van der Horst, 1990). A TTC value is defined only when both objects are currently on a collision course. In practice, evasive actions usually prevent the collision, but TTC reflects how close the interaction was to becoming critical. TTC is particularly suited in car-following scenarios with a longitudinal collision risk. In turning scenarios, however, the assumption of continued movement with constant heading poses a limitation, as a road user's heading changes during a turning manoeuvre (Mohamed & Saunier, 2018). On the other hand, if a left-turning vehicle performs a risky turning-manoeuvre in the presence of oncoming traffic, the objects are on a collision course and the TTC will reflect this. While the PET is better suited for SSA in the lateral scenario, we also calculate the TTC and consider its limitations during analysis.
We calculate the TTC at every time step of the dataset and use the minimum TTC value observed during each interaction (TTCmin) as the primary indicator of conflict severity. The calculation takes into account the size of the objects (corresponding to the bounding boxes determined by the MOT system), the relative headings and velocities of the objects, and their positions on the 2D plane. The calculation predicts the future positions of the object assuming constant speed and heading and constructs rectangles around them based on each object's width and length. If the future rectangles of two objects intersect, the objects are considered to be on a collision course, and the TTC value is computed.
4.2.2 Post-encroachment time
PET is used for interactions where one road user has to yield to another, especially in intersection scenarios. It is defined as the time between the first object leaving a potential conflict area and the second object entering it (Allen et al., 1978). In the permissive left-turn scenario, left-turning vehicles are considered to encroach, as they must yield to oncoming through traffic. Through-moving vehicles, in contrast, have the right of way. For this reason, PET is only calculated when the left-turning object enters the conflict area first. This avoids misclassifying safe situations as critical—such as when the left-turning vehicle waits for the through vehicle to fully pass and then turns immediately afterwards.
Similar to TTC, we account for object size in our calculations by constructing rectangles around the object positions and we dynamically determine the potential conflict area geometrically when calculating the PET.
4.3 Application specific preprocessing - iteration 1
The dataset used in this study has already been spatially filtered to cover the central part of the intersection (see AOI in Figure 3) which has multi-angle sensor coverage. In addition to that, a representative temporal subset of the data is necessary to ensure that subsequent analysis steps remain feasible. To balance representativeness and manageability, we select the first ten minutes of each hour on Thursday, 08 August 2024 as a subset, resulting in a total of four hours of data, distributed across one day.
We apply the following minor preprocessing steps during the first iteration of the proposed process to form the full week baseline dataset, from which the subset is derived afterwards. About 0.2% of trajectories appear within the AOI multiple times due to tracking issues. Those are split into separate trajectory segments and treated as distinct objects. We also filter the dataset on the tracking status attribute: If the MOT system is not able to establish stable tracking of an object, data often are erroneous, including short-lived false positives and observations of severely occluded objects. Unstable tracking occurs for about 7% of the data.
Table 1 provides an overview of the different datasets referred to in the following sections, including information about the number of single data points, the number of unique objects, and the number of co-occurring pairs of objects referred to as situations.
| dataset | points | objects | situations |
|---|---|---|---|
| full week baseline | 9,023,571 | 240,224 | 601,253 |
| full week geo-fenced | 2,725,013 | 53,610 | 76,586 |
| subset baseline | 221,763 | 6,030 | 15,245 |
| subset geo-fenced | 75,601 | 1,339 | 2,224 |
| subset clustered | 78,137 | 1,424 | 2,443 |
From the baseline dataset, we select those trajectories that are relevant to the defined scenarios. To distinguish between encroaching and priority road users in the case of PET, it is also necessary to identify the left-turning and the oncoming road users. In Section 3.2 we discussed geo-fencing and clustering for this purpose. Both approaches are applied to the subset baseline and compared. Although geo-fencing proved computationally efficient and transparent, it results in approximately 7% fewer left-turning trajectories and 5% fewer through-traffic trajectories than the clustering-based method. In combination, 87 objects have not been selected by geo-fencing but are included in the clustering-based approach, while 2 objects are only included by geo-fencing. Moreover, the trajectories only included by clustering tend to be shorter, with a median length of 18 points compared to 41 points for those included by both methods. Using Cohen's kappa coefficient (Cohen, 1960) to describe the alignment between both selection methods, we obtain a kappa value of 0.96, indicating almost perfect agreement.
Although the overall agreement is high, the differences could still impact the results of subsequent SSA if these differences correspond to critical interactions. Analoguous to the motivation outlined in Section 1.1, even occasional errors can have a disproportionate effect on SSA outcomes due to the rarity of actual conflicts. Figure 4 compares the histograms of TTCmin and PET values resulting from both selection methods applied to the data subset. While it is expected that slightly more relevant situations are included by the clustering-based approach due to the larger number of selected objects, the number of situations with very low TTCmin values in the two car-following scenarios is disproportionately higher when using clustering.
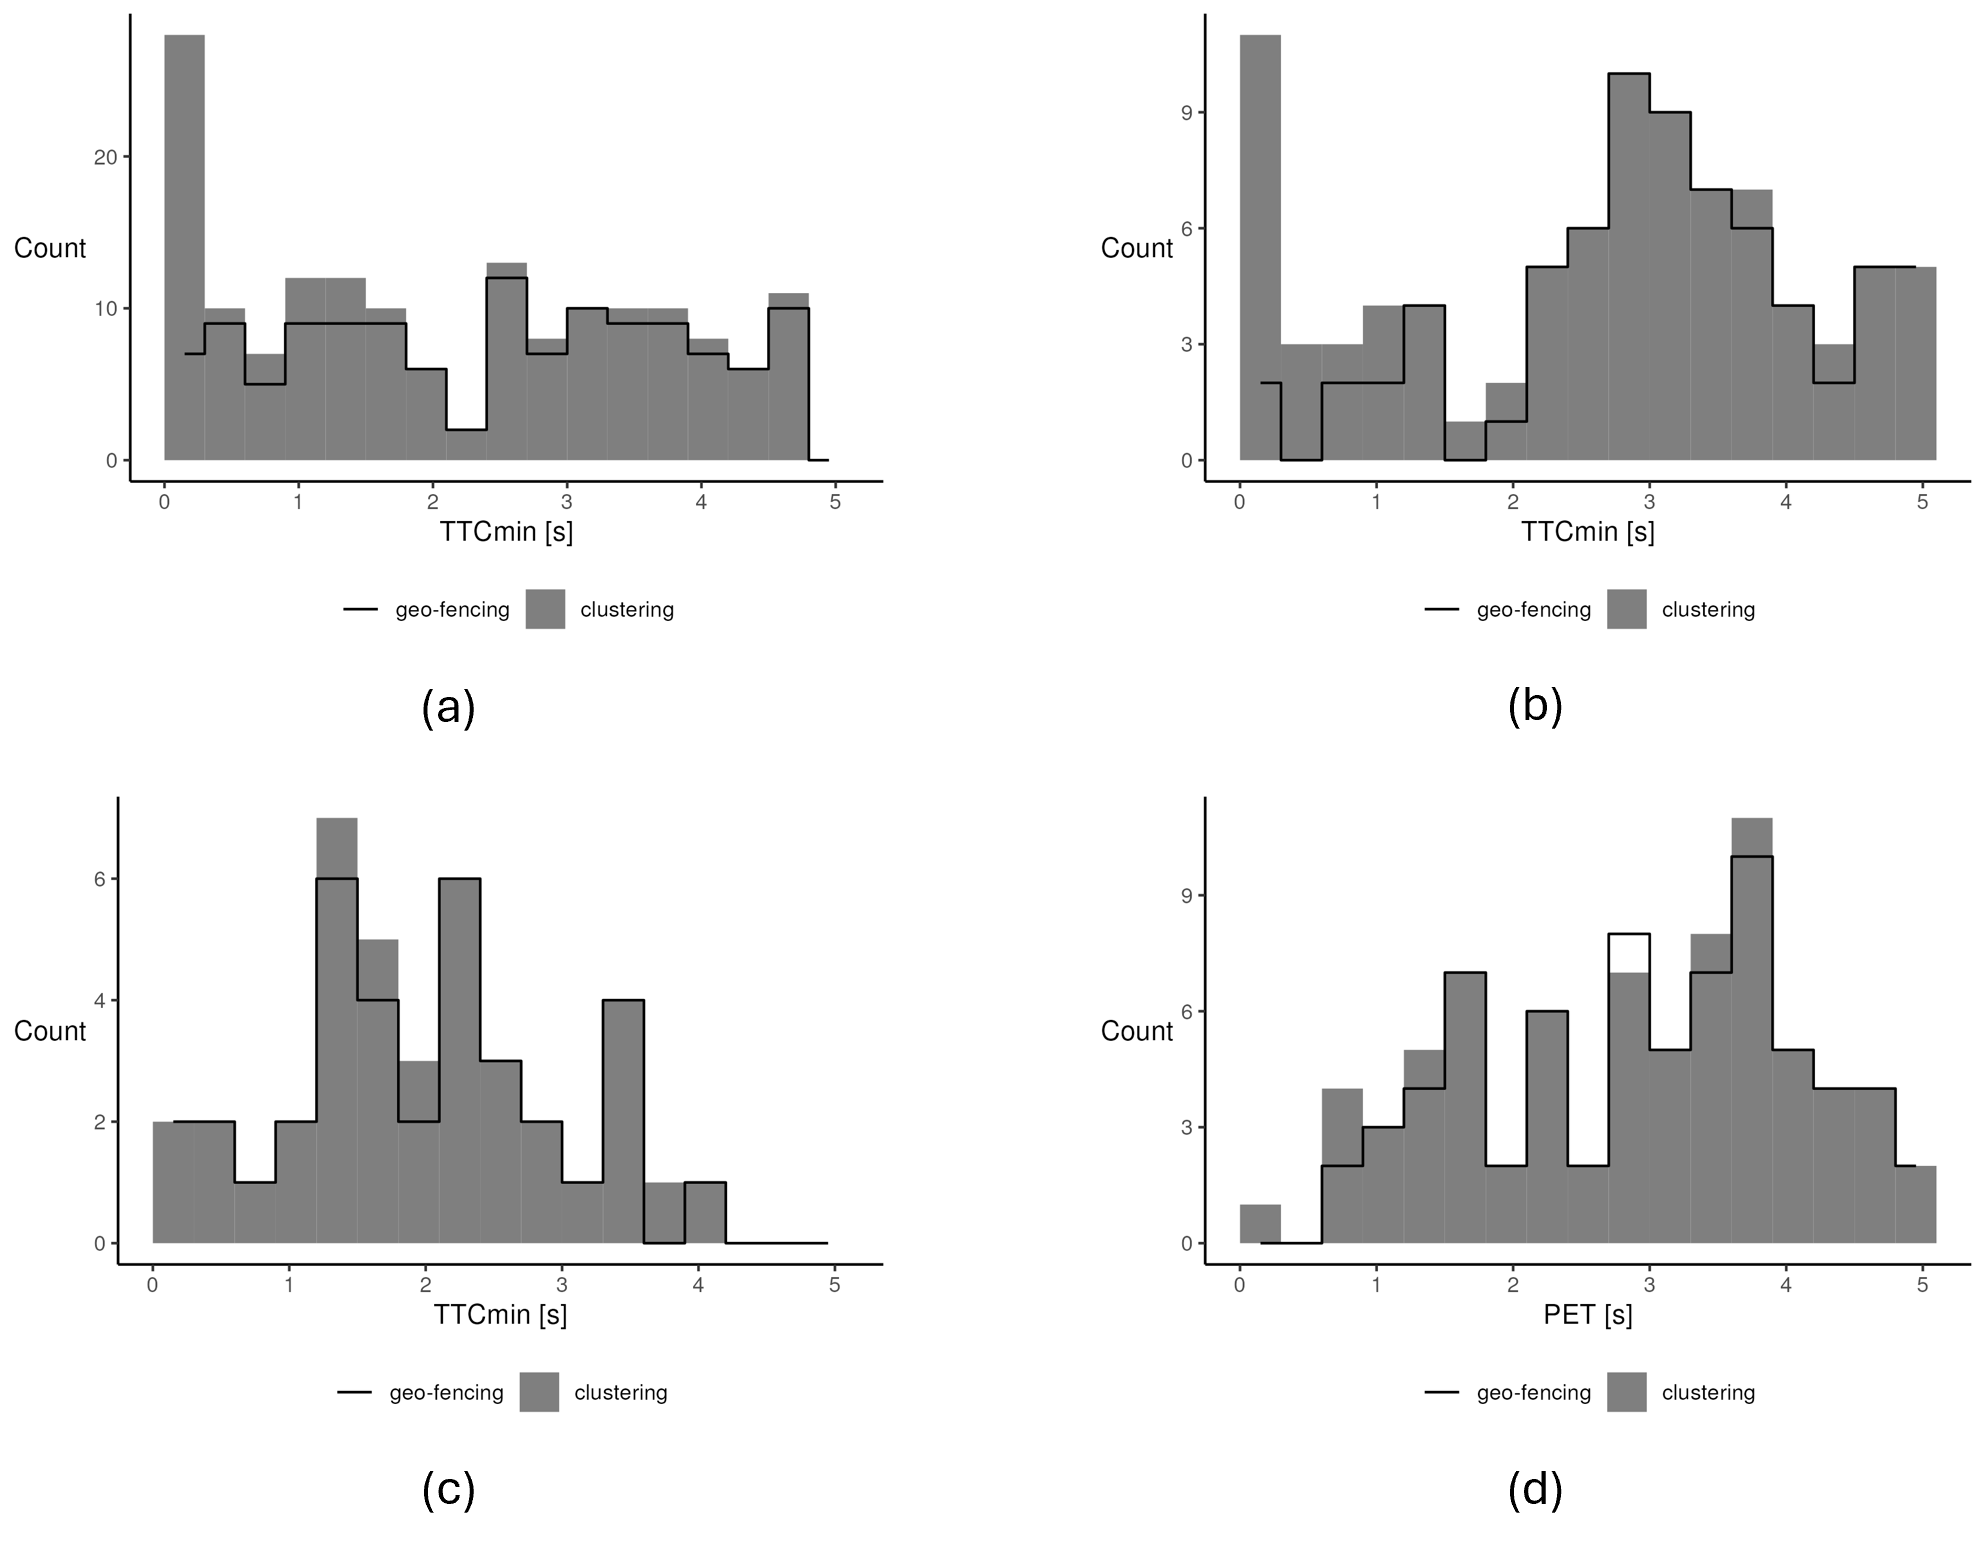
This result indicates that partially tracked objects exist in the data. They are included in the clustering-based selection but excluded by geo-fencing due to not intersecting all predefined zones. Since the effect is most pronounced in the low TTCmin range, these trajectory fragments must be very close to other objects. Such effects can occur when a single object is falsely perceived as two separate objects by the MOT system. Usually, the MOT system will recover at a later point in time, resulting in a partially tracked trajectory fragment. In this sense, geo-fencing not only selects scenario-relevant trajectories but can also act as a filter for certain tracking errors that impact SSA reliability in the present context.
More generally, this highlights a fundamental methodological challenge for SSA based on MOT data: How can relevant trajectories reliably be selected in areas where multiple interaction scenarios spatially overlap? The observed differences between the two tested approaches indicate that trajectory selection is a non-trivial task. Both types of selection errors—excluding relevant data and including irrelevant data—could potentially influence SSA results. However, without ground-truth information, our experiments cannot definitively determine which selection approach yields more accurate results overall, representing a limitation we address further in Section 5. Since the observed difference in the number of selected objects is relatively small and geo-fencing seems to have a beneficial filtering effect, we apply geo-fencing to the full-week dataset for the subsequent analyses, explicitly acknowledging the potential tracking issue.
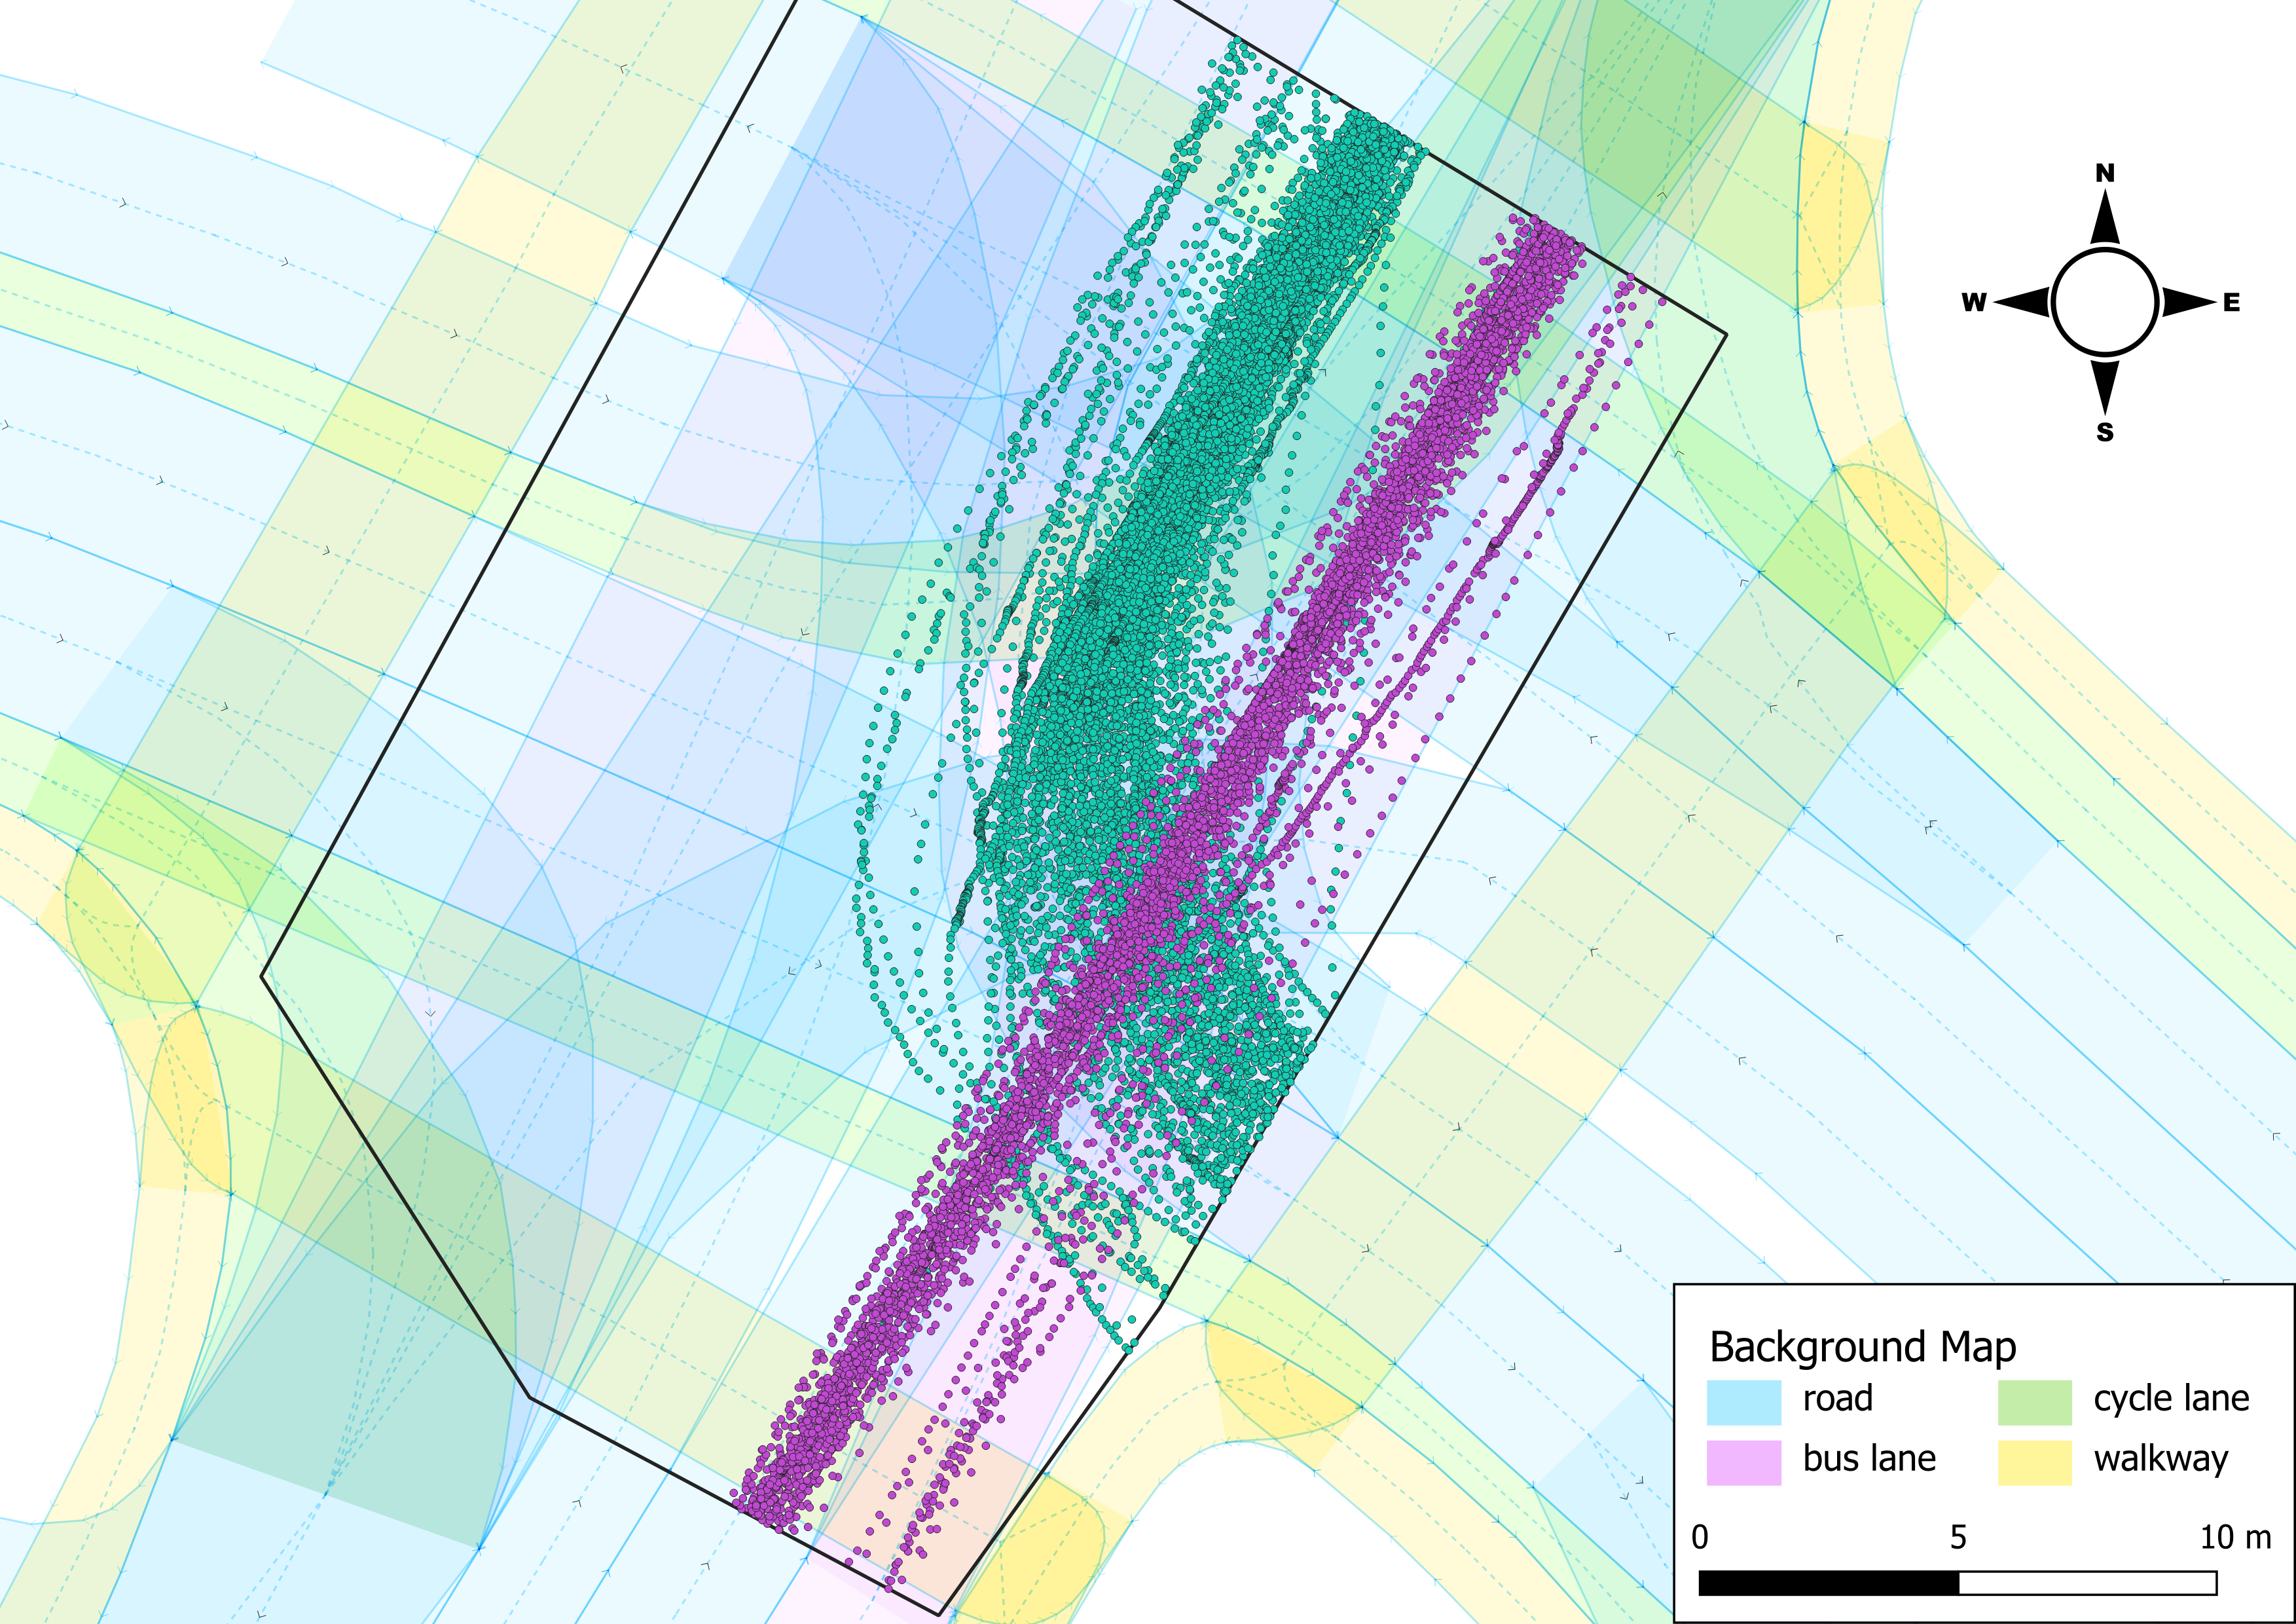
Figure 5 illustrates the trajectories of the geo-fenced subset. The paths align well with the background map, particularly for northbound vehicles. Left-turning trajectories show more variation, partly due to differing vehicle types (e.g., buses vs. bicycles) and yielding behaviour. In some areas, cycling infrastructure causes eastbound paths to diverge into cycle lanes or walkways. Overall, the smoothness and consistency of most trajectories indicate high positional accuracy in the recorded data at first glance.
4.4 SSM histogram analysis and conflict definition
Enabled by geo-fencing, we can analyse TTCmin values for each scenario as well as the PET values in the lateral scenario. Figure 6 shows the corresponding histograms as black lines, based on data from the full week resulting from preprocessing in iteration 1. Most noticeably, all three scenarios show a high number of situations in the leftmost bin, which corresponds to TTCmin values below 0.3~s. Further investigation revealed that in almost all of these situations (313 across scenarios) the TTCmin is 0~s, meaning that two objects have been assessed to have collided. This is highly implausible for a single week of data, especially since no real collisions were reported during this period.
With respect to data quality, we can conclude that in several cases, object bounding boxes, as detected by the MOT system, overlap. At least a majority of these cases are data errors that affect the reliability of TTC-based SSA.
The PET in the lateral scenario shows significantly less collisions than the TTCmin, even though overlapping bounding boxes also cause PET = 0~s in six situations. The reason is that in any situation, the PET considers only a limited area: the potential conflict area that we construct around the point where the paths of the two objects intersect. The TTC, on the other hand, is calculated at every timestamp for which both objects are detected regardless of their position. Therefore, collisions according to TTC also occur when a through vehicle drives past a waiting left-turning vehicle at a position well away from the intersection point of their paths.
While the mode of the distribution in the left-turn following and lateral scenario lies around 2~s, excluding the 0~s outlier, the frequency of values in the straight-through following scenario rises continuously up to the 5~s cut-off. For the PET, frequencies in the range 1.5–5~s are very similar without a clear mode.
Threshold values for defining conflicts vary widely in the literature. Studies reviewed by Johnsson et al. (2018) report thresholds for both TTC and PET in the range of 1–3~s. The histograms in Figure 6 do not provide a clear hint on which value to chose from that range. Since our focus lies on data quality assessment, we adopt a conservative threshold of 3~s to define conflicts in all scenarios so as not to miss any potential data artefacts in the following analyses.
4.5 Visual-analytics-based analysis of conflicts
Following the methodology proposed in Section 3.4, we analyse conflict situations from the geo-fenced subset to identify false positives caused by data artefacts and thereby assess the reliability of SSA with respect to the given data. In total, 171 of 2,224 situations meet the conflict definition above and were investigated by means of visual evaluation. Each situation was independently assessed by two human observers with expertise in traffic behaviour and MOT data interpretation. In 11 cases, assessments differed between the two observers regarding the identification of data errors. The inter-rater reliability can also be described using Cohen's kappa coefficient (Cohen, 1960), which accounts for the agreement occurring by chance. For the given visual evaluation, Cohen's kappa was found to be 0.82, indicating near perfect agreement. The 11 cases of disagreement were resolved through discussion.
Table 2 provides an overview of the analysis results per scenario. In total, 42 situations are classified as false positives—i.e. the reported conflict is not supported by plausible motion patterns and appears to be caused by erroneous data. This corresponds to an FDR of about 25% of all evaluated situations. However, differences between scenarios and SSMs exist. Of the conflicts identified using PET, only one (3%) is due to a data error, whereas 14 (47%) of the detected conflicts according to the TTCmin are caused by errors in the lateral scenario. Additionally, the number of detected conflicts according to TTCmin (30) is lower than that based on PET (34) in this scenario. Also, the TTCmin-based and PET-based conflicts only share seven situations, thus demonstrating that different measures capture different aspects of a situation. In both car-following scenarios, the FDR of TTCmin-based conflicts is lower than in the lateral scenario, but over 50% of the situations are labelled as suspicious.
| scenario | SSM | error (FDR) | suspicious | clean | N |
|---|---|---|---|---|---|
| LTF | TTCmin | 22 (29%) | 39 (52%) | 14 (19%) | 75 |
| STF | TTCmin | 5 (16%) | 19 (59%) | 8 (25%) | 32 |
| LAT | TTCmin | 14 (47%) | 5 (17%) | 11 (37%) | *30 |
| LAT | PET | 1 ( 3%) | 4 (12%) | 29 (85%) | *34 |
| TOTAL | n/a | 42 (25%) | 67 (39%) | 62 (36%) | 171 |
The subset contains nine detected collisions (TTCmin = 0~s). All are confirmed to be false positives due to data artefacts. While they occur in every scenario, a majority of six cases occurs in the left-turn following scenario.
The following attributes are most frequently responsible for errors, with multiple attributes often occurring within the same situation:
object position (21 cases)
object heading (22)
object speed (13)
object size (12)
and tracking inconsistency (7).
Figure 7 shows an example of an error due to a tracking inconsistency that causes the false detection of a collision. Panel (a) displays the situation of a left-turn following scenario type of interaction at the moment at which the bottom object is about to leave the AOI. Panel (b) displays the situations 400~ms later where the same object is detected again and its bounding box overlaps with another object's bounding box.

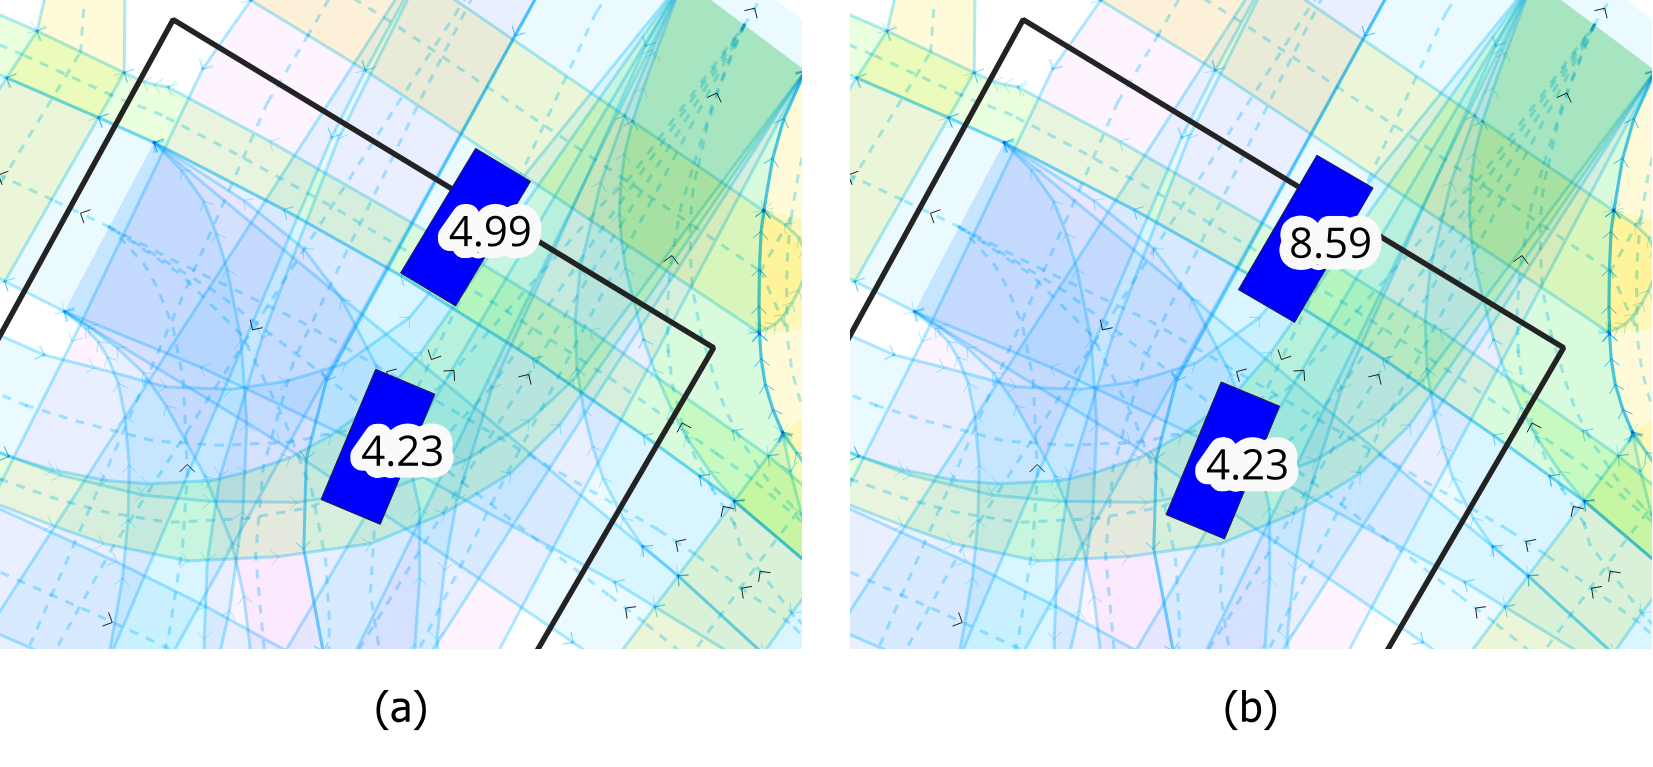
Figure 8 shows an example of a speed attribute error. Panel (a) displays the situation of two objects in the left-turn following scenario approaching the center of the intersection from the top right at a similar speed. Panel (b) displays the situation 100~ms later. The speed of the following object has almost doubled, which leads to a low TTCmin of 0.5~s and consequently to the false detection of a conflict.
In addition to such clear errors, many conflict situations show ambiguous data quality and were labelled suspicious (see Table 2). Suspicions were noted for two main reasons: when the data described movement at the edge of plausibility, i.e. when the described movement was not typical but also not impossible; or if (small) data errors were clearly determined, but an impact of errors on the SSM value was unlikely or unclear. Even though the usefulness of such ambiguous and subjective evaluation might seem questionable at first, hypotheses about the presence of small errors or inaccuracies can be derived and knowledge of data quality can be significantly extended. Compared to visually assessing a random subset of data, focusing on detected conflicts seems to accumulate interesting cases.
The most prominent suspicion regards the speed attribute. In 22.8% of the reviewed situations, the reported speed appeared to lag behind the actual deceleration observed in the trajectory, especially in the left-turn following scenario. However, based on the visual inspection of the situations, the presence of an error could not be confirmed without doubt unless there was a sudden change of speed, as in Figure 8. It is difficult for human observers to estimate the speed corresponding to the movement of bounding boxes between two frames and compare it to the speed value provided by the system. Hence, these situations were denoted as suspicious and investigated in detail afterwards.
Figure 9 illustrates the speeds of two objects in such a situation. The speed reported by the MOT system changes smoothly over time, but appears to react with a delay relative to the speed directly calculated from the reported, time-referenced positions of the trajectories for comparison. This lag may result from the MOT system operating in near real time, where smoothing can only be applied retrospectively. The system may prioritise stability over responsiveness, leading to delayed updates in motion attributes. In contrast, the speed directly derived from raw position data reacts immediately but exhibits strong fluctuations and occasional spikes. Such fluctuations are typical for speed calculations based on high-frequency position data. Minor inaccuracies in discrete position measurements can lead to significant variations in speed estimates due to short time intervals and the differentiation process, which magnifies noise (Punzo et al., 2011). This discrepancy suggests that neither speed representation is fully reliable for fine-grained motion analysis, and that SSM computations may be affected in different ways depending on which input is used.

Following the proposed process (as shown in Figure 1), we find that the quality of the present data does affect conflict detection. However, the number and extent of data errors seem small, suggesting that improved preprocessing might be able to resolve the existing issues in the dataset.
4.6 Application specific preprocessing - iteration 2
We extend the preprocessing routine with two additional steps to address the previously identified errors: first, a trajectory reconstruction approach that smooths object positions, headings and speeds while preserving internal consistency, and, second, a step to address object size errors.
Trajectory reconstruction aims to infer the most plausible movement of an object, given noisy or incomplete observations. The method used here is based on the approach proposed by Zhao et al. (2024) who formulate trajectory reconstruction as a constrained non-linear optimisation problem. Their model minimises the deviation between the original and reconstructed trajectories, subject to physical constraints, such as limits on speed, acceleration, turning radius, and jerk. These constraints make this approach attractive for SSA as many SSMs require plausible attributes such as speed and acceleration. Since the plausibility of these attributes is ensured on the trajectory level instead of smoothing on the attribute level, the approach ensures internal consistency, meaning that these derived attributes are consistent with the spatial and temporal differences between consecutive positions. It therefore also resolves the previously observed lag in speed values. We adopted the parameter settings proposed in the original study, with one exception: The suggested limit for lateral acceleration (0.18~g) proved overly restrictive for several left-turning trajectories in our dataset. To account for real-world variability—particularly in sharp turns—we relaxed this constraint to 0.5~g, which yielded smoother and more plausible results without compromising physical plausibility.
Since the trajectory reconstruction approach only handles object positions over time but not the size of objects, we need to address size-related issues separately. While the MOT system captures object dimensions very well in general, the data show occasional outliers which influence SSA. Due to the live characteristics of the system, object dimensions may fluctuate throughout a trajectory. Assuming that the system correctly captures the dimensions of an object for the majority of its observation time, we choose to replace the dynamic dimension attributes by their median value per trajectory.
4.7 Effects of preprocessing changes
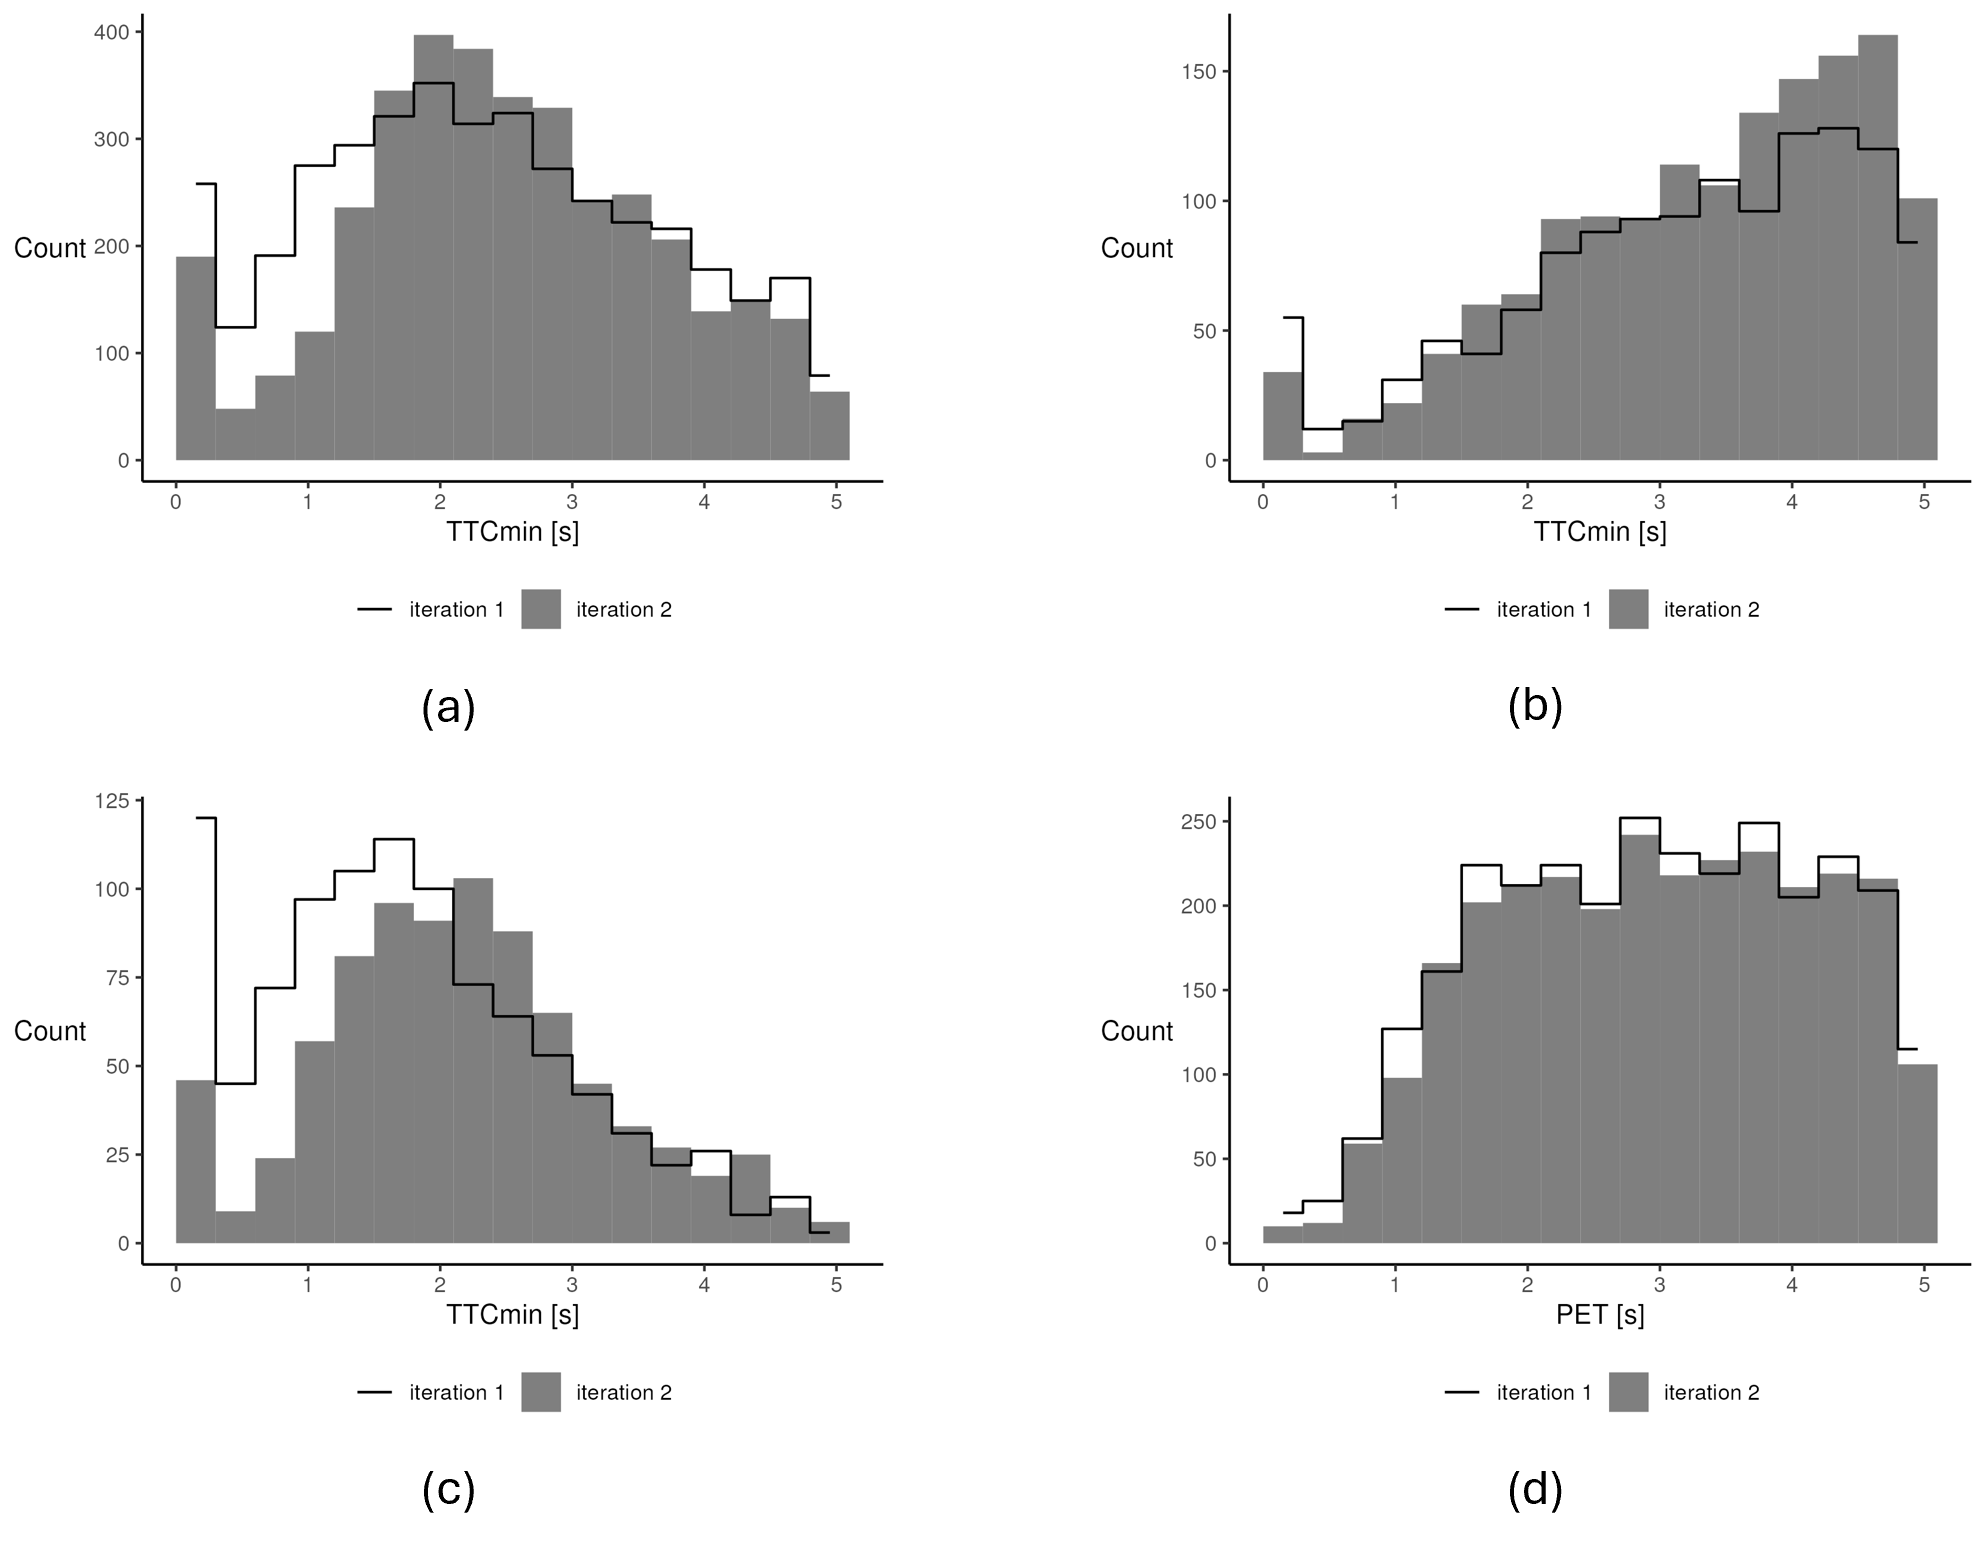
Following the updated preprocessing, we compare the new results to the analyses conducted during the first iteration. Figure 6 shows the histograms of SSM values from the second iteration on the full week dataset as grey areas. Compared to the histograms from the first iteration (black lines), several differences are noticeable. The number of low SSM values is significantly reduced across all scenarios. Differences between scenarios exist in the number of bins with reduced frequency as well as in the extent of the reduction per bin.
In the left-turn following scenario (a), values in the range 0.0–1.5~s are rarer in the second iteration, while values in the range 1.5–3.0~s are slightly more frequent. Above 3~s, the direction of change differs from bin to bin but there seems to be a tendency towards a lower frequency. In total, less values fall in the displayed range of 0.0–5.1~s. In the straight-through following scenario (b), values in the range 0.0–1.5~s are slightly less frequent. Above 1.5~s, the frequency has increased in general. In total, more values fall in the displayed range of 0.0–5.1~s. In the lateral scenario, TTCmin values in the range 0.0–2.1~s have become significantly less frequent, especially values in the range 0.0-0.9~s, whose frequency is reduced by more than 60% (c). The range 2.1–3.0~s shows an increased frequency. In total, significantly less values fall in the displayed range of 0.0–5.1~s. The PET (d) shows a reduced frequency of values in the range 0.0–0.6~s of about 50%, while the frequency in the remaining bins remains quite similar with a tendency towards a slight reduction. In total, fewer values fall in the displayed range of 0.0–5.1~s. Overall, the PET histogram shows the least change between iterations and thus the smallest effect of the applied correction methods on the assessed conflict risk. Despite a significant reduction, the left-most bin corresponding to values in the range 0.0–0.3~s remains prominent for TTCmin in all three scenarios, indicating an implausibly high number of very dangerous situations or even collisions.
Moreover, we investigate the effects of the improved preprocessing on the data subset previously analysed, where we identified whether the detected conflicts were caused by data errors. We investigate whether the situations meeting the conflict definition in the first iteration still meet the conflict definition, how the SSM values have changed and how many new situations now meet the conflict definition.
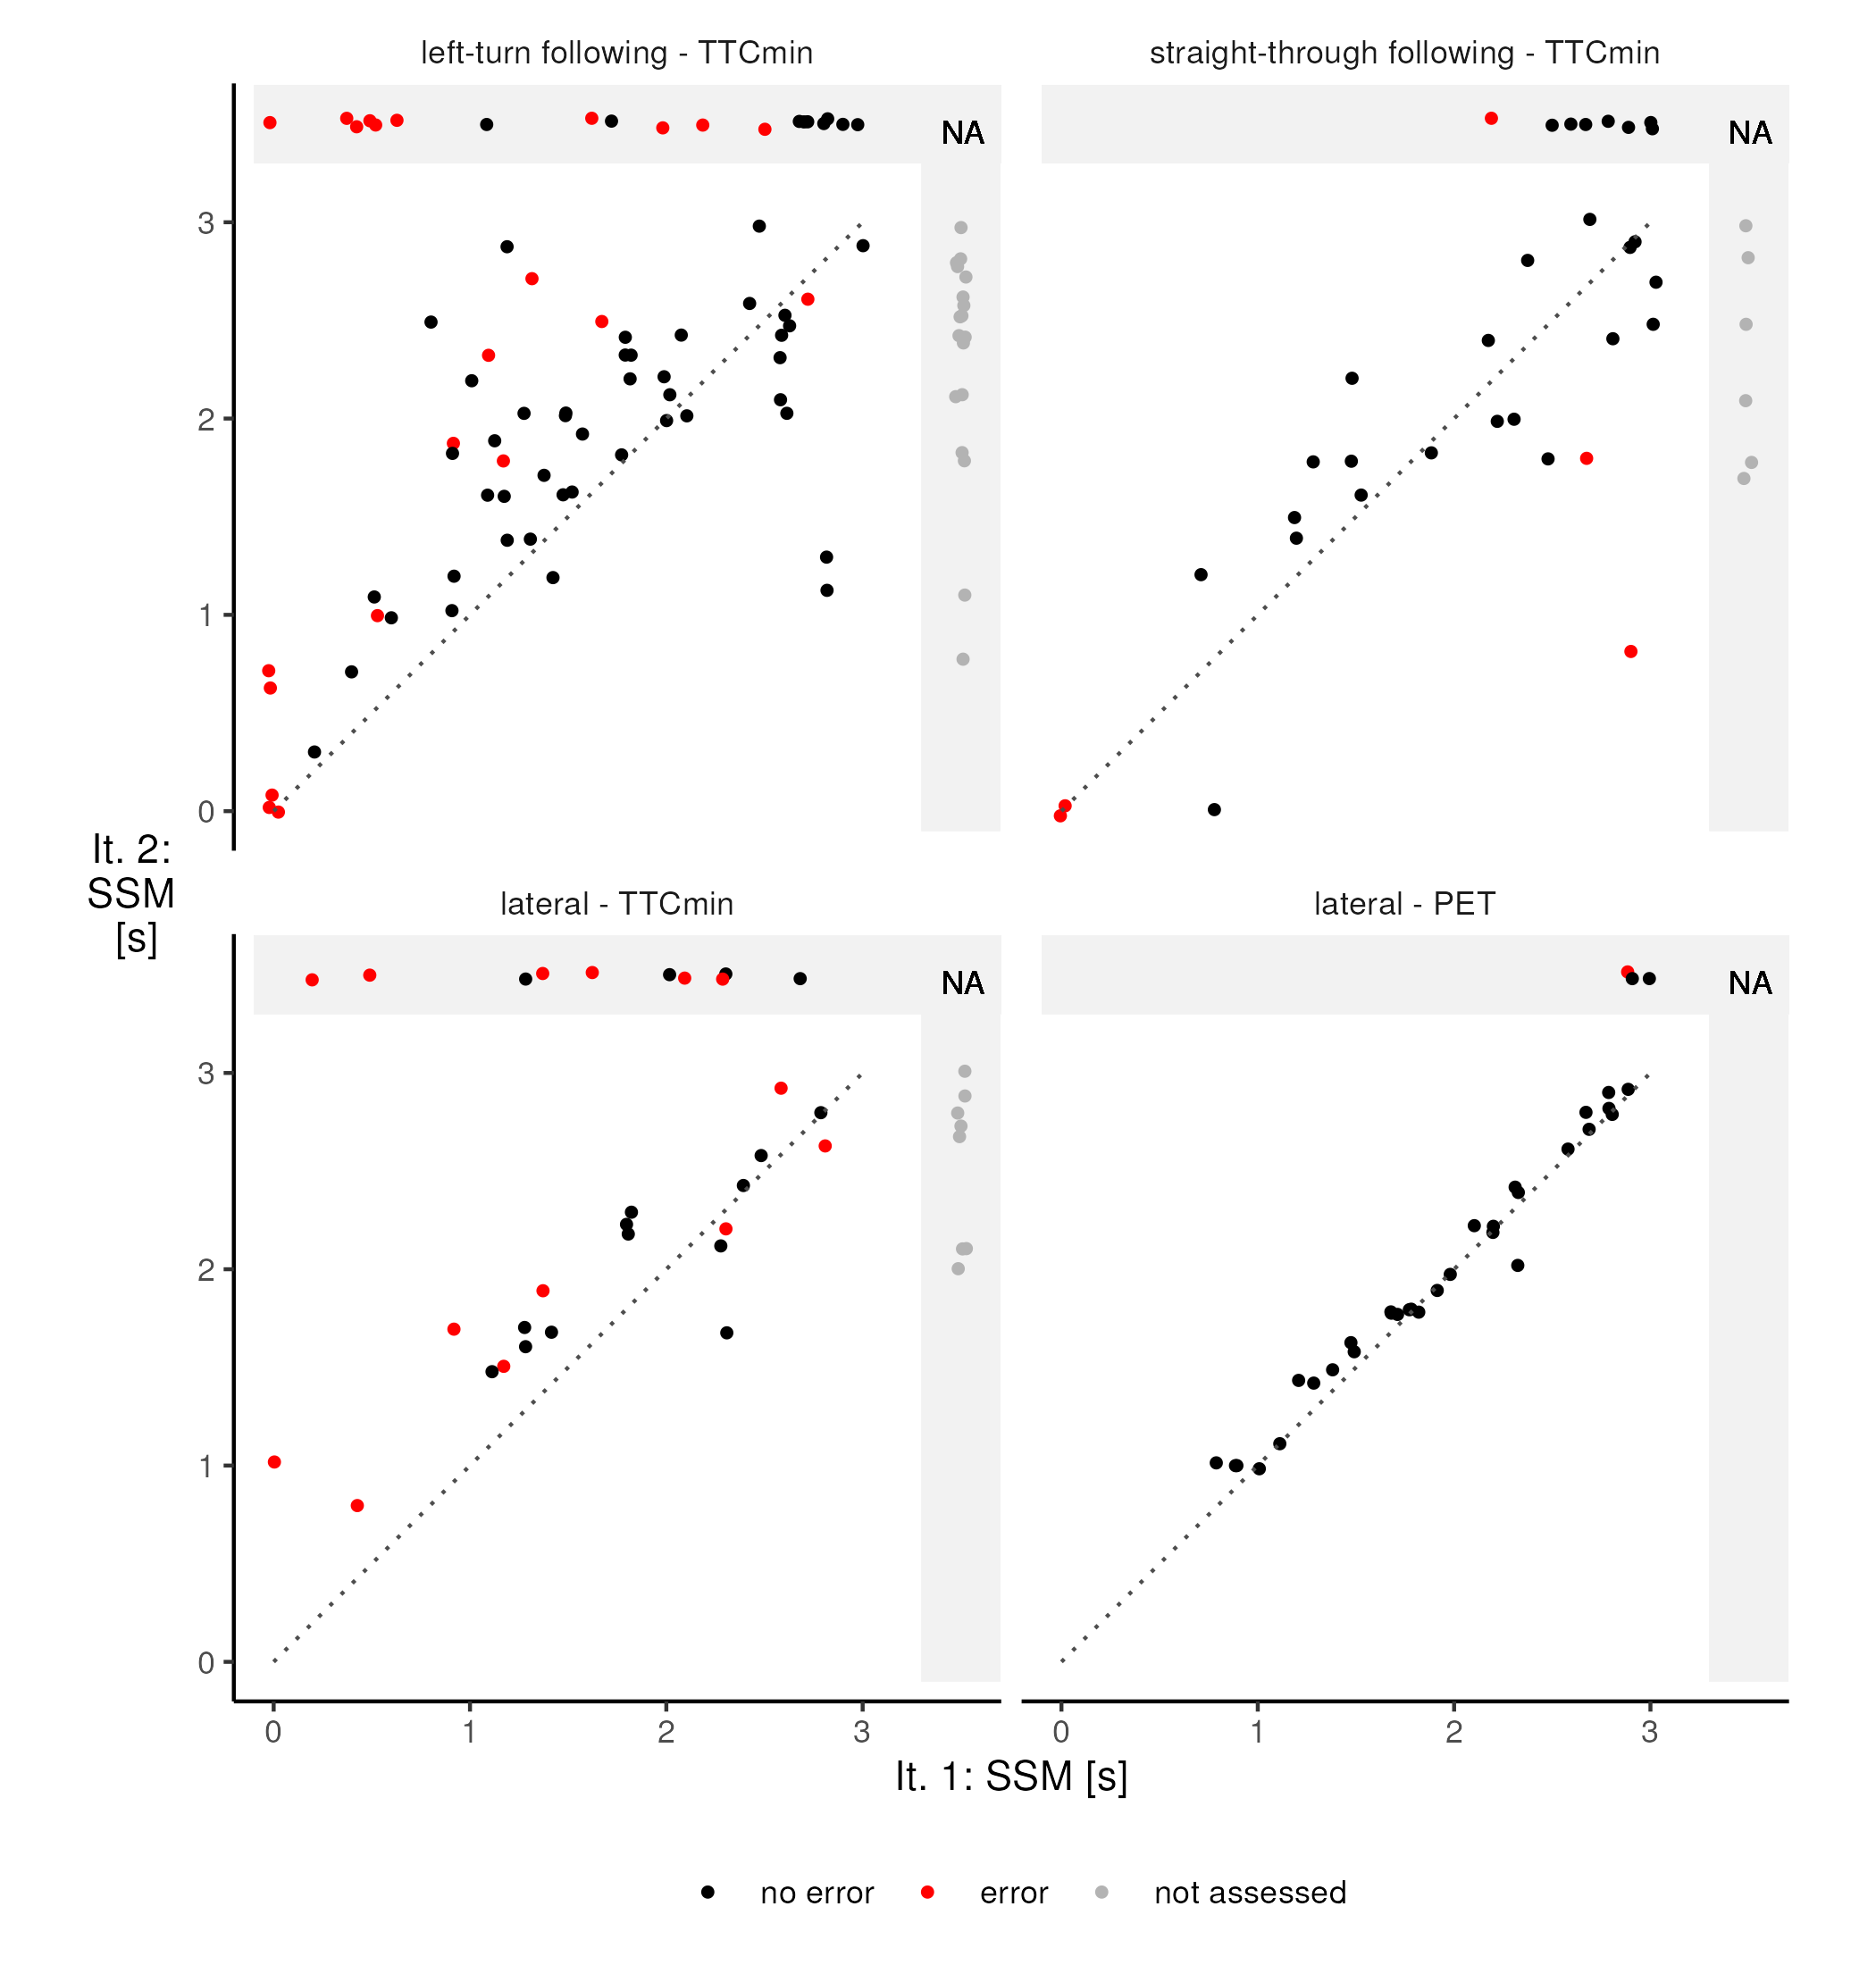
Figure 10 summarises these aspects graphically. Each dot represents a conflict situation. Its location is determined by its SSM value in the first iteration (horizontally) and in the second iteration (vertically). Positional noise is added to the points in the plot to avoid overlapping. Situations that meet the conflict definition in one iteration, but not in the other are located in the grey "NA" area—either at the top or on the right, respectively. Here we do not distinguish between situations with a value above the threshold of 3~s and situations in which the SSM could not be calculated. For example, the TTC cannot be calculated if objects are not on a collision course. For situations above the dotted line, the calculated SSM value was higher in the second iteration. Red dots represent situations in which the manual evaluation detected data errors. Grey dots in the right grey areas represent situations that did not meet the conflict definition during the first iteration and thus were not assessed. In contrast to analysing the changes of the frequency of values, this view also reveals how individual SSM values changed from one iteration to the other.
In correspondence with the histogram of the full week dataset (Figure 6), these results also show that PET is hardly affected by the changed preprocessing routine: PET values did not change much in any situation; only a few situations, whose SSM values had already been rather high and close to the conflict threshold, no longer meet the conflict threshold after the changes to preprocessing, including the one identified error; no new situations meet the conflict definition.
The TTCmin, however, shows several changes. Overall, there is a tendency towards higher TTCmin values due to the preprocessing changes, i.e., a tendency towards a lower assessed conflict risk. Several situations no longer meet the conflict definition, including situations that had shown very low TTCmin values before (points in the top-left of each panel). Most of these had been identified as data errors. However, several new conflicts have emerged in the assessment. Some of them even show rather low TTCmin values, not just values near the threshold. Noticeably, the effects in the straight-through following scenario appear to be different from the other scenarios. While it also shows significant differences between the two iterations, situations with increased TTCmin values and reduced TTCmin values are equally frequent. Another interesting perspective focuses on situations with detected errors (red dots) only. In the left-turn following and the lateral scenario, the TTCmin of such situations is mostly higher and only rarely remains equal or is slightly lower. However, many of the error-related situations also fulfil the conflict definition clearly in the second iteration. The correction methods were not sufficient to resolve these errors. In the straight-through following scenario, some situations corresponding to data errors are among those with the highest reduction of TTCmin through the changed preprocessing, meaning that situations that were wrongly identified as conflicts in the first iteration are now assessed to be even more critical. Considering the FDR in iteration 2, we can derive a lower limit without repeating the manual, visualisation-based step by assuming the new, additional conflict situations to all be true positives. Even under this assumption, the FDR for TTCmin-based SSA remains considerable with 16%, 13%, and 29% in the left-turn following, straight-through following, and lateral scenario, respectively.
To better understand the distinct behaviour observed in the straight-through following scenario, we analyse the corresponding situations in detail. We find that many of the detected conflicts involve large vehicles, such as buses and trucks. The MOT system appears to occasionally struggle with reliably determining bounding boxes of such objects during detection. As a result, the bounding boxes and also their centre points, i.e. the objects' positions, jump noticeably between time steps, with some positions even appearing behind earlier ones. Through the trajectory reconstruction in iteration 2, the resulting positions were spatially ordered in a physically plausible sequence—that is, they are no longer located behind earlier positions along the vehicle's path. However, the corrected positions remain as close as possible to the original erroneous ones, without violating the model's speed and deceleration limits. As a consequence, the speed of the reconstructed trajectories occasionally drops significantly, which in turn leads to a collision course with following vehicles, whose velocities remain higher. Even though the reconstruction improved these low-quality trajectories in terms of physical plausibility, it also increased the assessed conflict risk from an SSA perspective, as it sometimes amplified errors in the relative movement within a pair of objects.
Correcting object dimensions by using the median values per trajectory in addition to trajectory reconstruction had no significant impact on this effect. This countermeasure comes too late because incorrect bounding boxes lead to incorrect centre positions which represent incorrect object positions. In severe cases, such as the one described above, the applied trajectory reconstruction approach, that does not consider bounding boxes, is not able to correct data sufficiently.
The results of the second iteration mark the end of the proposed process for assessing SSA reliability. Even though the changed preprocessing routine has shown some improvements of TTCmin-based SSA, it was not capable of correcting errors in the dataset sufficiently. To the best of our knowledge, existing correction methods will not be able to correct the errors that have been identified in the present data, in order to enable reliable TTC-based SSA. However, the process demonstrated that data quality is sufficient for conducting reliable SSA based on the PET.
5. Conclusion
This study proposed and tested a practical approach for assessing the reliability of a particular SSA approach based on data from an MOT system treated as a black box. The proposed framework enables the identification of relevant data artefacts by leveraging human visual perception. It also provides a framework to iteratively assess whether data correction methods are capable of sufficiently improving data quality with respect to SSA outcomes.
The experiments showed that even in relatively clean MOT datasets, infrequent and minor inaccuracies in position, heading, or speed can lead to significant overestimation of conflicts. This underlines the need for application-specific data quality evaluation, going beyond general-purpose, application-independent assessments of MOT algorithms or systems in the context of SSA.
Furthermore, the experiments provided answers to the research questions stated in Section 1.2.
Q1: The experiments demonstrated the practicality and usefulness of the proposed process, which was able to reveal data errors that caused false positive conflict detections and thus affected the reliability of SSA. Even though the process focuses on detected conflicts and does not consider false negatives, it provided valuable insights into data structure and quality with respect to the particular SSA application. The process has been designed so that it can be applied to datasets from any generally validated MOT system by treating the system as a black box. Therefore, these results are expected to generalise well to other datasets and scenarios. However, practical applicability to other datasets and scenarios should be confirmed by future research.
Q2: The results indicate that PET is considerably more robust to minor data inaccuracies than TTCmin. This is likely due to PET being calculated based on observed positions, making it less affected by short-term fluctuations or sensor noise. In contrast, TTCmin depends on predicted future movements derived from instantaneous speed and heading, which makes it more susceptible to momentary errors in motion attributes. This can lead to artificially low TTCmin values and false-positive conflict detections. While this finding is based on a single dataset and a limited number of conflict scenarios, it aligns with the nature of each measure and is therefore expected to generalise to other scenarios with similar data quality issues. However, future research is needed to confirm this finding for further sensor systems and scenarios. Moreover, future research could consider making robustness against certain types of data errors a selection criterion for SSMs. Reliable SSA not only requires a selected SSM to theoretically capture safety-relevant aspects of a situation, but also to be reliably applicable to the available data, which, in practice, is rarely of perfect quality.
Q3: The experiments also demonstrated how the proposed process can be used to investigate the effects of data correction methods. These effects were observable without repeating the visual-analytics-based evaluation of conflict situations from the first iteration. Instead, it was sufficient to inspect the changes to SSM values of already analysed situations. However, if multiple iterations are conducted, a repetition of that step might also be useful.
Q4: Even though the applied correction methods addressed position-, speed-, and size-related errors and caused significant changes to the criticality of situations, they did not sufficiently improve data quality for a reliable application of TTC-based SSA to our data. In particular, the separate treatment of position- and size-related errors seems to be problematic, as both depend on erroneous bounding boxes and are therefore interrelated. Future research could investigate approaches of reconstructing bounding box trajectories, i.e. sequences of time-referenced bounding boxes instead of sequences of time-referenced points, in order to enhance imperfect MOT data specifically for reliable application in SSA.
A limitation of our study arises from the task of selecting scenario-relevant trajectories, particularly under imperfect data conditions. As demonstrated by our experiments, different trajectory selection approaches can yield notably different results, particularly in areas where multiple scenarios overlap spatially. However, without access to ground-truth data, we could not conclusively determine which selection method was more accurate. The filtering effect of geo-fencing compared to a clustering-based selection technique was beneficial for SSA reliability in our experiments but might not generalise to other systems or scenarios. Consequently, unintended data losses or the inadvertent inclusion of irrelevant data may bias SSA outcomes and their reliability. This methodological challenge appears currently underexplored within the broader context of SSA research based on MOT data. Future research should address this trajectory-selection issue in greater depth, critically evaluating its implications for SSA reliability, and developing hybrid or more sophisticated selection methods. Such approaches should also aim to optimally balance computational efficiency, completeness of data, and accuracy.
While this work provides a broad but structured framework for evaluating the data quality aspect of SSA reliability, it also demonstrates its concrete applicability through a detailed real-world case study. This provides a foundation for future studies targeting individual components in greater depth. Even though our process effectively addresses data quality based on detected conflicts, the consideration of potential false negatives remains an important open issue that warrants further investigation, particularly in complex traffic scenarios. To enhance scalability and consistency, future implementations of the proposed process could explore semi-automated visual diagnostics or embed anomaly detection into the visual evaluation workflow.
CRediT contribution
Markus Steinmaßl: Conceptualization, Data curation, Formal analysis, Funding acquisition, Investigation, Methodology, Project administration, Software, Validation, Visualization, Writing—original draft, Writing—review & editing. Moritz Beeking: Funding acquisition, Methodology, Project administration, Resources, Writing—review & editing. Natasha Troth: Methodology, Investigation, Writing—review & editing. Karl Rehrl: Conceptualization, Funding acquisition, Project administration, Supervision, Writing—review & editing.
Declaration of competing interests
The authors report no competing interests.
Declaration of generative AI use in writing
During the preparation of this work, the authors used ChatGPT (GPT-4o, GPT-4.1, GPT-4.5) for grammar and language refinement. All outputs were reviewed and revised by the authors, who take full responsibility for the content.
Ethics statement
This study was conducted as part of a research project funded by the Austrian Federal Ministry of Climate Action, Environment, Energy, Mobility, Innovation and Technology (grant GZ 2021-0.641.557). According to the relevant Austrian regulations and the guidelines of Salzburg Research, ethical approval was not required, as the research did not involve interventions or experiments with human participants, the collection of sensitive personal data, or the use of biological samples. No vulnerable groups were involved, and all data were fully anonymised or collected in a way that precluded individual identification. Therefore, an application to an ethics committee was not necessary for this research.
Funding
This work was supported by the Austrian Federal Ministry of Climate Action, Environment, Energy, Mobility, Innovation and Technology (grant GZ 2021-0.641.557).
Editorial information
Handling editor: Lai Zheng, Harbin Institute of Technology, China.
Reviewers: Linheng Li, Southeast University, China; Padmakumar Radhakrishnan, College of Engineering Trivandrum, India.
Submitted: 31 July 2025; Accepted: 13 December 2025; Published: 27 December 2025.