Towards a European Key Performance Indicator for Safe Urban Roads: Lessons From the Trendline Project
Abstract
Key Performance Indicators (KPIs) are an important instrument for road safety policy making. This paper presents a KPI for safe urban roads that was developed and tested in the European Trendline project. Based on discussions with 18 experts from 8 countries, it was decided to start with the basic indicator ‘Share of 30 km/h road length of the total length of urban roads’ which was tested in five pilot countries using available local, national and international (GIS) databases. The share of 30 km/h roads appeared to differ considerably between the pilot countries, ranging from less than 1% in the city of Silistra in Bulgaria to 73% in the Netherlands. The pilots showed that it is possible to calculate the KPI, although it is important to check the quality of the speed limit data and there will be some differences in selections due to data availability and local context. Also the use of additional indicators related to the concept of safe speeds was explored in the pilots. The calculation of these indicators appeared to be more challenging and further research is recommended to further develop these additional KPIs.
1. Introduction
The European Commission has the ambitious goal to halve the number of road fatalities and serious road injuries (MAIS3+ casualties) by 2030 compared to a 2020 baseline, and a long term ambition to move close to zero fatalities by 2050 (European Commission, 2020). The road safety policy framework 2021-2030 of the European Commission is based on the Safe System approach, which is also recommended globally by the World Health Organisation (European Commission, DG for Mobility and Transport, 2020). Key performance indicators (KPIs), sometimes also referred to as safety performance indicators (SPIs) or road safety performance indicators (RSPIs) are an important instrument in the Safe System approach (OECD/ITF, 2016).
Within the European project Trendline (www.trendlineproject.eu), we developed a KPI for safe urban roads, focussing on the share of 30km/h roads in built-up areas. To test whether it is possible to estimate the KPI using existing databases, pilots were carried out in a number of countries. This paper discusses the developed KPI as well as the lessons that were learned from the pilot tests.
The next section discusses the rationale behind road safety KPIs in general and the proposed KPI for safe urban roads in particular. Section 3 subsequently discusses the pilot tests that were carried out and Section 4 discusses the results of the pilot tests. The discussion in Section 5 presents a number of lessons learned from the pilot study and discusses the added value as well as the limitations of the proposed KPI and directions for future research. The final section presents the conclusions.
2. Theory: Key Performance Indicators (KPIs) for safe urban roads
2.1. KPIs for road safety
Key performance Indicators (KPIs) are measures of the operational conditions of the road traffic system which influence its safety performance (European Commission, 2022). The operational conditions cover the following areas which are known to have a causal relationship with the number of crashes, fatalities and (serious) road injuries (European Commission, 2022):
-
The safety characteristics of the road infrastructure
-
The safety characteristics of the vehicles
-
The risky behaviour of road users
-
The use of protective equipment
KPIs should be defined in such a way that they can be used quantitatively and that road safety increases when the KPI increases. Moreover, KPIs need to be measured and monitored periodically and independently of each other and of road crash data at reasonable costs (Jeanne Breen Consulting et al., 2018).
KPIs contribute to a better understanding of road safety performance in a country by area and can be used to set targets and monitor progress towards these targets. Besides, KPIs can also be used to assess whether implemented policy measures have led to the desired results (European Commission, 2022).
Most sets of KPIs that are currently in use are specific to a particular country, making it difficult to make international comparisons (European Commission, 2022). The European project Trendline, which is a follow-up of Baseline (www.baseline.vias.be), contributes to increased comparability of KPIs between different European countries. The Trendline project brings together 29 countries (25 EU member states and 4 other European countries as observers) for data collection, data analysis, delivery of road safety KPIs and for using these within road safety policies. The eight indicators that originate from European Commission (2019) are the core of the Trendline project (see Table 1). In addition to those KPIs, ten experimental and complementary indicators have been defined in the Trendline projects. One of these experimental, complementary KPIs is the share of 30km/h roads in built-up areas.
| Indicator | Definition |
|---|---|
| Speed | Percentage of vehicles travelling within the speed limit |
| Safety belt | Percentage of vehicle occupants using the safety belt or child restraint system correctly |
| Protective equipment | Percentage of riders of powered two wheelers and bicycles wearing a protective helmet |
| Alcohol | Percentage of drivers driving within the legal limit for blood alcohol content (BAC) |
| Distraction | Percentage of drivers NOT using a handheld mobile device |
| Vehicle safety | Percentage of new passenger cars with a Euro NCAP safety rating equal or above a predefined threshold |
| Infrastructure | Percentage of distance driven over roads with a safety rating above an agreed threshold |
| Post-crash care | Time elapsed in minutes and seconds between the emergency call following a collision resulting in personal injury and the arrival at the scene of the collision of the emergency services |
2.2. 30km/h speed limits on urban roads
Speed is known to influence crash risk and crash severity (e.g. OECD/ITF, 2018; SWOV, 2021) and safe speed is one of the pillars of the safe system approach (e.g. OECD/ITF, 2016). On locations were conflicts between motorised traffic and vulnerable road users (i.e., pedestrians and cyclists) are possible, a speed of 30km/h or less is considered safe (European Commission, 2021; OECD/ITF, 2016; Tingvall & Haworth, 1999).
Lowering speed limits to 30km/h in urban areas has received a lot of political attention in recent years. Reducing the speed to 30 km/h in areas where vulnerable road users and vehicles mix in a frequent and planned manner, was one of the most specific recommendations of the Stockholm Declaration of 2020 which was later adopted by the United Nations as part of the launch of the decade for Action on Road Safety 2020-2030 (United Nations, 2020). Besides, the European Parliament adopted a Resolution called for a “maximum default speeds of 30km/h in residential areas and areas where there are high numbers of cyclists and pedestrians” (European Parliament, 2021). Moreover, more and more cities (e.g. Amsterdam, Bologna, Brussels, Edinburgh, Graz, Helsinki, Oslo, Paris, for an overview see for example (Yannis & Michelaraki, 2024)) have already implemented lowering speed limits in urban areas to 30km/h, not only for safety reasons, but also for liveability and to discourage the use of cars.
2.3. Experimental KPI ‘share of 30km/h roads’
The safety level of urban roads was not covered by the KPIs that were previously developed within Baseline. The share of 30km/h roads however is considered to be associated with the risk of fatal and severe crashes on urban roads. As a KPI the share of 30km/h offers perspective for action as already proven in several countries and cities and is thus considered to be a useful KPI for policy makers. Therefore it has been decided to include the share of 30km/h as one of the experimental indicators within the Trendline project.
A Key Expert Group (KEG) of 18 experts from 8 countries (see acknowledgement) proposed several definitions for this KPI and drafted methodological guidelines that can be used to estimate the KPI. Based on discussions with the KEG members, it was decided to start with a basic definition that is rather simple to understand and determine and could stimulate policy makers to start using the KPI. This basic definition is:
- Share of 30km/h road length of the total length of urban roads.
In addition to the basic definition, several potential additional definitions are proposed. Two of these additional indicators are related to the concept of safe speeds for cyclists and pedestrians. The rationale behind these additional indicators is that a speed of 30km/h or lower is only necessary (from a road safety perspective) when cyclists and pedestrians are mixed with motorized traffic. In case no conflicts can occur with cyclists and pedestrians, a higher speed is also considered to be safe. The additional indicators related to the concept of safe speeds for cyclists and pedestrians are:
-
Share of 30km/h road length of the total length of urban roads with mixed traffic.
-
Share of urban roads with a safe speed limit for cyclists and pedestrians, i.e.:
-
Roads with a speed limit of 30km/h or lower
-
Roads at which pedestrians and cyclists are not allowed, and
-
Roads at which pedestrians and cyclists are physically separated from motorized traffic and are not expected to cross at road sections.
-
These indicators better reflect whether the speed limit is actually safe for pedestrians and cyclists, but they are more difficult to operationalise and estimate; e.g. what is physical separation and how to estimate whether pedestrians are expected to cross at road sections.
Other additional indicators use alternative exposure measures. These are:
-
Share of 30km/h road lane length of the total lane length of urban roads.
-
Share of distance travelled on 30km/h roads of the total distance travelled on all urban roads.
These indicators better reflect the actual exposure to road unsafety, but they are more complicated to determine. Another disadvantage is that more exposure on 30km/h roads (or a shift in use from 50km/h to 30km/h roads) results in a better score on the KPI, whereas this is not desirable. Motorized traffic should use the 50km/h roads as much as possible as 30km/h roads are mainly located in residential areas (SWOV, 2023).
3. Pilot tests
To calculate the KPI, one needs information on:
-
the total length of urban roads with a speed limit of 30km/h or lower, and
-
the total length of urban roads.
In most cases, this information will be extracted from a database or a combination of databases. To be able to extract that information from databases, it should, first of all, be possible to identify urban roads in the databases. Within Trendline, urban roads are defined as public roads within urban boundary signs that are not motorways. Secondly, for these urban roads, one needs information about the speed limit and the length of the roads/road sections.
The KPI was piloted in a number of countries to test whether it is possible to determine the KPI and to explore the use of different data sources, data selection criteria and alternative definitions. Pilot tests were performed in The Netherlands, Sweden, Finland, Lisbon and three cities in Bulgaria (Table 2). More information about the pilot tests can be found in Weijermars, Van den Berghe, Uijtdewilligen, Van Petegem, Naydenov, et al. (forthcoming).
| Pilot area | Pilot period | Databases | Validation of data |
|---|---|---|---|
| Netherlands | Spring 2024 | National databases + OSM | Comparison Dutch database and OSM |
| Sweden | Spring/summer 2024 | National databases | |
| Finland | Spring/summer 2024 | National databases + OSM | |
| Lisbon | Summer 2024 | Local database | Field surveys |
| Bugaria: Sofia, Burgas and Silistra | Autumn/winter 2024 | TomTom data |
All pilot tests made use of existing GIS databases. For the pilot in Lisbon, field surveys were executed to complete and update the data from the database. Most pilots used national databases, whereas Bulgaria bought data from TomTom and for the pilot in Lisbon a local database was used. Finland used OpenStreetMap (OSM) in addition to their national data for the identification of bicycle paths. In the Dutch pilot, OSM was used as an alternative data source and results were compared between the national databases and OSM.
Urban roads can be selected in various ways, depending on the available data. In the pilot studies, different types of data and different selection criteria were applied. In the Dutch pilot, several selection criteria were compared using two different databases, namely the ‘Wegkenmerkendatabase’ (WKD) that contains several data sets about road characteristics and TOP10NL which is the most detailed level of a topographical dataset that contains a variable ‘place border’. Moreover, it was examined what the effect was of excluding business parks as they are often a-typical and have low cycling volumes. In Sweden, urban roads were selected using the variables ‘responsible road authority’ and ‘built up area’. Only municipal roads within built-up areas were included in the analysis as most state roads are located outside built up areas. In Finland, public roads located within urban areas (taajama) as marked by urban boundary traffic signs were considered urban roads. Motorways and expressways were removed. In Lisbon, all municipal roads were included in the analysis. Lisbon does not have land integrated into the rural land registry, and therefore all municipal roads in Lisbon can be considered urban roads. In the pilot in Bulgaria, all roads within the territory of built-up areas were included in the analysis, regardless of the road authority that is responsible for the road (municipality or road infrastructure agency). One city area in Bulgaria generally consists of multiple settlements/built-up areas and for the calculation of the KPI, only the roads within the built-up areas, indicated by built up area signs, are included in the analysis.
In some countries, also roads with a speed limit of 30km/h or lower can be selected in various ways, using different databases. In the Dutch pilot for example, three different selection methods were compared, applying two different databases and the variables ‘road category’ and ‘speed limit’.
Most pilot tests applied the basic definition and some of the pilots explored one or more potential definitions. As was mentioned in the previous section, the additional definitions related to the safe speed concept require further operationalization. Concerning the operationalization, various choices were explored. The additional definitions that were explored in the pilots are summarized below:
- In Lisbon, road lane length was considered instead of road length because speed limits may differ between lanes in Portugal. Moreover, for one area in Lisbon, also the share of roads with a safe speed limit was estimated. Roads with a safe speed limit were considered to be roads with a speed limit of 30km/h or lower and roads with bike lanes that were separated by physical barriers. In addition, it was also explored what the effect was of including roads with an advise speed of 30km/h and roads on which 30km/h or lower was the intended speed limit, but for which legal signage was lacking.
-
In the Dutch pilot, the share of roads with a safe speed limit was estimated as well as the share of 30km/h road length of the total length of urban roads with mixed traffic. Several operationalizations were explored in the Dutch pilot (for more information see Section 4.4).
-
In the Swedish pilot, the share of roads with a safe speed limit was estimated. Roads with a safe speed limit were defined as roads with a speed limit of 30 km/h or lower or separate cycle paths. Moreover, it was explored how to determine safe crossing of pedestrians.
-
The Finish pilot estimated the share of roads with a safe speed limit, as roads with a speed limit of 30km/h or lower or roads with sperate cycle paths.
4. Pilot results
This section presents the results of the pilot studies. More detailed results can be found in Weijermars et al (forthcoming). The results have been used as an input for the finalisation of Methodological Guidelines (Weijermars et al. forthcoming-b) and have been summarized in Van den Berghe & Stelling (forthcoming).
4.1. Share of 30km/h roads in different countries
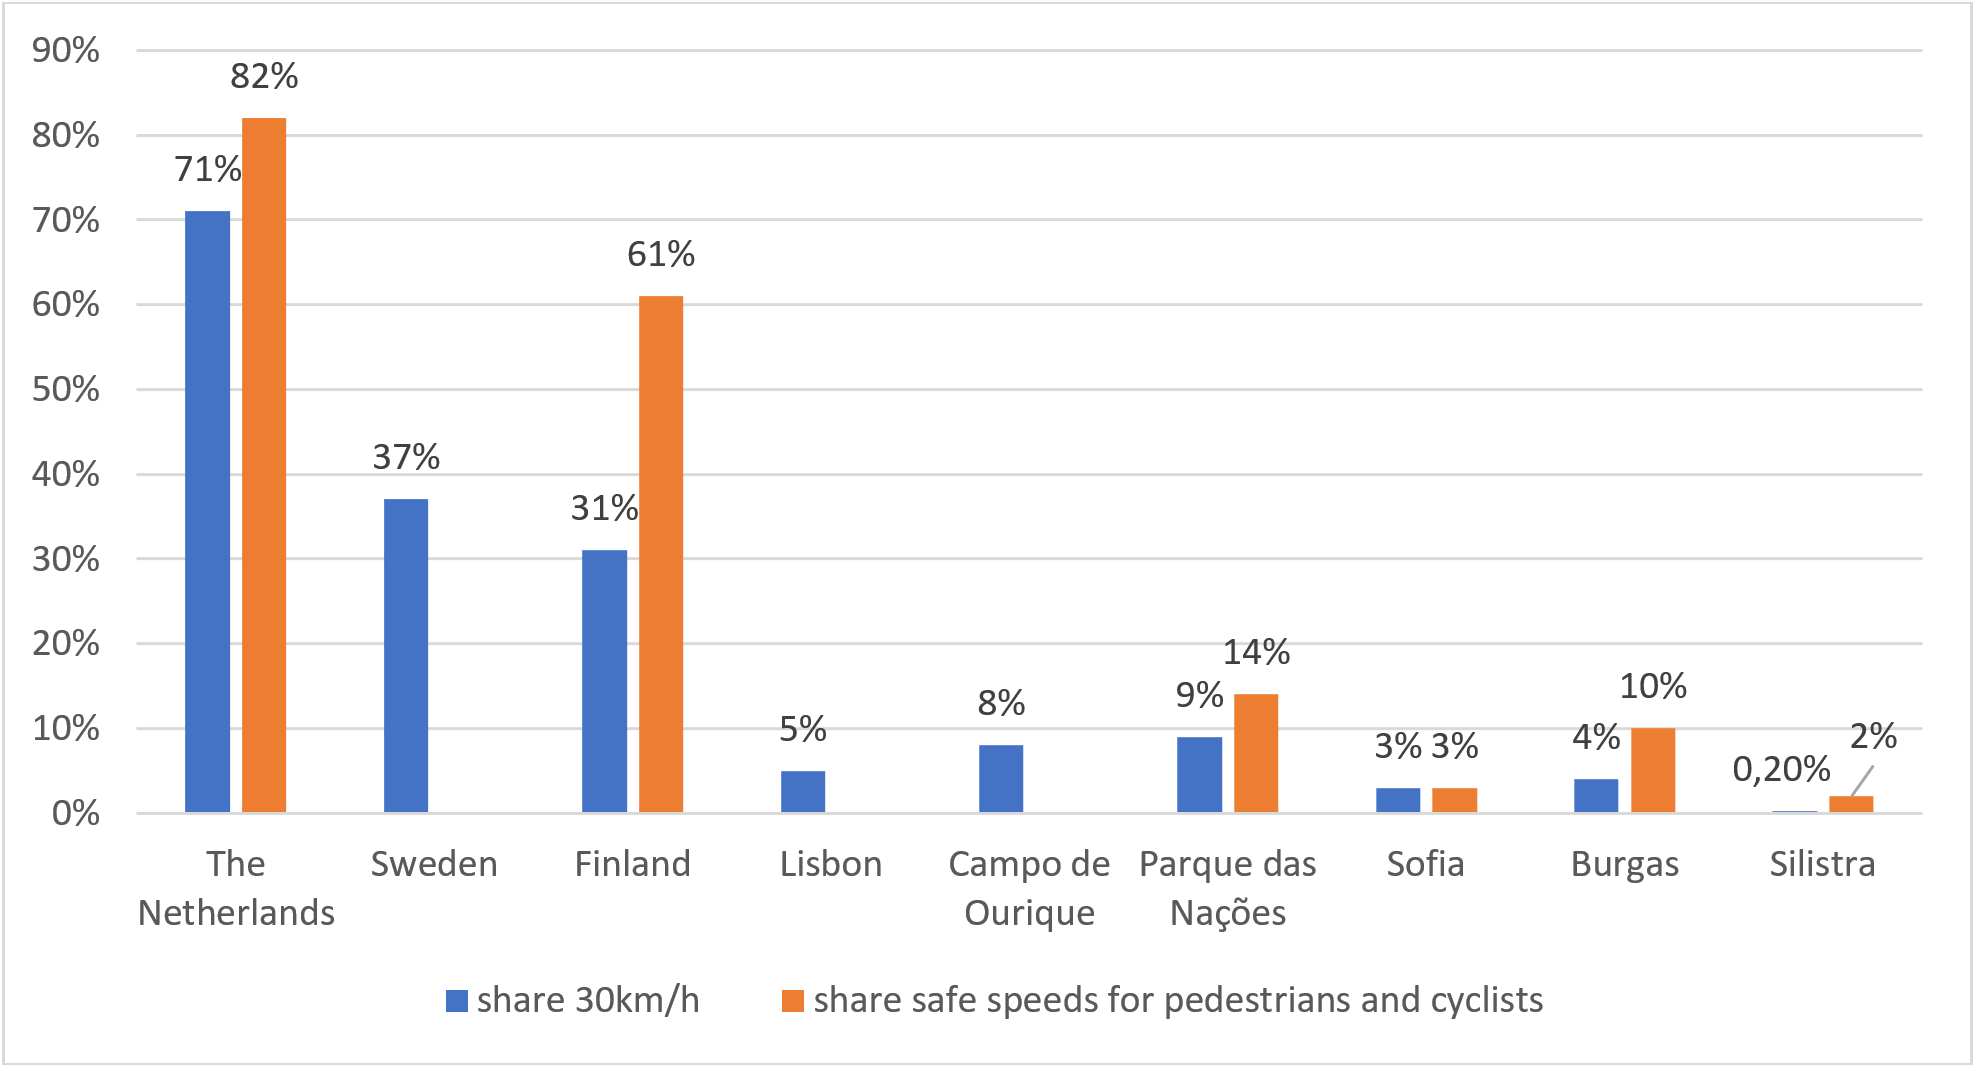
The share of 30km/h roads differs between the pilot countries (Figure 1). As the available data and specific criteria that were used to select urban roads and 30km/h roads differ between countries, the results are not fully comparable between the countries and differences may partly be due to differences in selections. However, the differences in share of 30km/h roads are quite obvious between the countries and are most probably to a large extent explained by actual differences in share of 30km/h roads.
In the Netherlands, the share of 30km/h roads is highest (73%), whereas the city of Silistra shows the lowest share of 30km/h roads (0,2%). With regard to Sweden it should be noted that many urban roads have a speed limit of 40km/h. The reason for this is that 40km/h is recommended as a new default speed limit in urban areas. In areas with frequent mixing of vulnerable road users and motor traffic, such as residential areas, school zones, and city centres, a 30 km/h limit is advised.
4.2. Validation of pilot results
For Lisbon, the share of 30km/h roads was estimated to be approximately 5%. As this was expected to be an underestimation of the actual share of 30km/h roads, additional field surveys were carried out in two pilot parishes: Campo de Ourique and Parque des Nações. For Campo de Ourique, the field study resulted in a comparable share of 30km/h roads as the result obtained from the database (8.0% compared to 7.8%), whereas for Parque des Nações the survey resulted in a higher share of 30km/h roads; 8.8% compared to 3.3%.
In the Dutch pilot study, the share of 30km/h roads was estimated using national databases as well as OpenStreetMap (OSM). The estimated share of 30km/h roads was comparable for both data sources (73% for national databases, compared to 75% for OSM). However, in OSM the speed limit was missing for 20% of the urban roads. For these roads, an assumption was made about the actual speed limit on the basis of the road class: in case the road class was “residential” or “unclassified”, the speed limit was assumed to be 30km/h or lower. This assumption was checked by comparing the results based on this assumption with the variable ‘speed limit’ in the national database (WKD). It was found that roads that were assumed to be 30km/h roads on the basis of the variable road class in OSM indeed had a speed limit of 30km/h in the national database.
Effect of different selection criteria
In the Dutch pilot, alternative ways for selecting urban roads and selecting roads with a speed limit of 30km/h were explored. Table 3 shows the results for the different selection criteria. The estimated lengths and shares of 30km/h roads appear to vary depending on the method to select urban roads (columns) and roads with a speed limit of 30km/h or lower (rows).
| Selection of urban roads | |||
| WKD urban area borders | Top10NL urban area borders | Top10NL place borders | |
| Selection of 30km/h roads | Km and (% ≤ 30km/h) | ||
| Road category WKD | 58,679 km (80.6%) | 56,440 km (81.4%) | 56,541 km (81.4%) |
| Speed limit WKD + road length NWB | 55,583 km (73.1%) | 52,948 km (74.4%) | 53,085 km (74.4%) |
| Speed limit WKD | 55,921 km (73.0%) | 55,575 km (73.4%) | 55,722 km (73.4%) |
Concerning the selection of urban roads, the selection based on WKD urban area border results in higher road lengths than the methods based on the TOP10NL data. The share of 30km/h roads is slightly higher when Top10NL data are used for the selection of 30km/h roads, but the differences in shares are small between the different selection methods.
When the methods for selecting 30km/h roads are compared, it can be seen that both the length and share of 30km/h roads appear to differ between the methods. The share of 30km/h roads is clearly higher when these roads are selected on the basis of the road category instead of the speed limit data itself. For the estimated share of 30km/h, it appears not to matter whether the speed limit data from the WKD is combined with data from the NWB or not, although the estimated road length differs between both data sets. Based on expert judgement, the selection based on the speed limit data from the WKD in combination with the Top10NL urban area border is expected to be the most reliable.
Another issue that was explored in the Dutch pilot was the exclusion of business parks. In the Netherlands, business parks can be part of built-up areas, but they are different in nature and have low cycling volumes compared to other built-up areas. Although the share of 30km/h roads is found to be much lower for business parks (25% compared to 71% which was found with a simplified method for all urban roads, for more details see Weijermars, Van den Berghe, Uijtdewilligen, Van Petegem, Naydenov, et al. (forthcoming)), the impact of the estimated share of 30km/h roads in the Netherlands is small (the estimated share is 3% higher in case business parks are excluded).
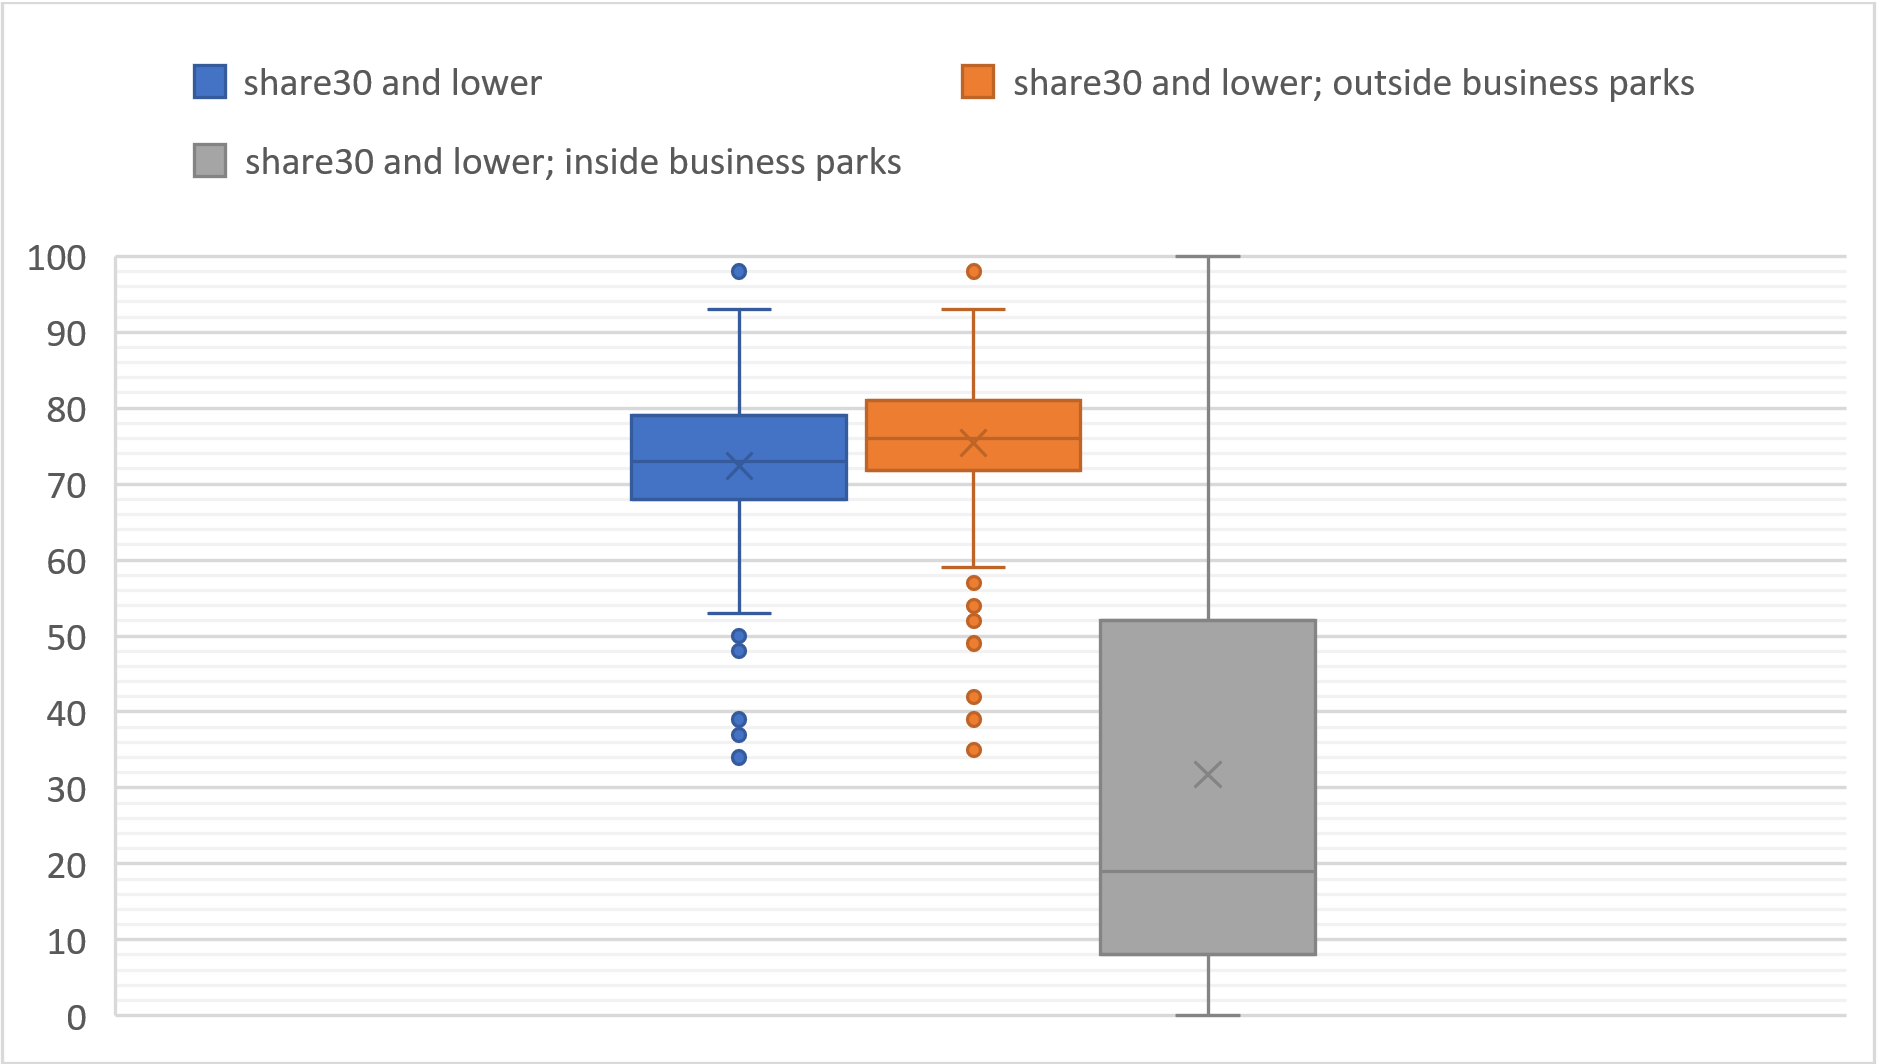
In the Dutch pilot, also the variation between municipalities is investigated. From the box plots in Figure 2 it can be seen that the share of 30km/h roads differs considerably between municipalities. Whereas the spread around the median between the 25th and 75th quartile (the edges of the box) is limited, with a share of 30km/h roads between 68% and 79%, the 10 percent lowest ranked municipalities only have a share of 30km/h roads of 60% or less, down to 34%. For business parks a much larger spread across municipalities is observed. For example, in Almere, 72% of the urban roads inside business parks have a speed limit of 30 km/h or lower, while in Amersfoort this share is only 15%.
4.4. Share of roads with safe speeds for cyclists
Figure 1 also shows the shares of roads with a safe speed limit for cyclists, for the pilot areas for which this KPI is available. Especially in Finland, the share of roads with a safe speed limit for cyclists is considerably higher than the share of 30km/h roads, namely 61% compared to 31%. The Netherlands shows the highest share of roads with a safe speed limit for cyclists (82%).
In the Netherlands, several alternative selections of roads with safe speed limits for cyclists were explored:
-
Share of roads where it is safe to cycle;
a. Safe: urban roads with a speed limit of 30 km/h or lower & urban roads with separated bicycle tracks or parallel access roads with a speed limit of 30 km/h
b. Total: all urban roads (excluding motorways and expressways)
-
The share of ‘safe speed’ roads (for cyclists):
a. Safe: urban roads with a speed limit of 30 km/h or lower & urban roads with separated bicycle tracks or parallel access roads with a speed limit of 30 km/h or lower & urban roads with a speed limit of 50 km/h or higher with access restrictions for cyclists
b. Total: all urban roads (excluding motorways and expressways)
-
The share of safe speed roads where cyclists are allowed
a. Safe: urban roads with a speed limit of 30 km/h or lower & urban roads with separated bicycle tracks or parallel access roads with a speed limit of 30 km/h or lower
b. Total: All roads excluding roads with access restrictions for cyclists
-
The share of roads with a speed limit of 30 km/h or less of the total of all urban roads without separation of cyclists
a. Safe: urban roads with speed limits of 30 or lower
b. Total: All urban roads with shared roadways
The results in Table 4 show that results are quite comparable for the various KPIs. The share of ‘safe roads for cyclists’ varies between 81% and 84%.
| Definition | Share of safe roads (%) |
|---|---|
| 1. share of roads where it is safe to cycle | 81.8% |
| 2. share of ‘safe speed’ roads (for cyclists) | 83.6% |
| 3. share of safe speed roads where cyclists are allowed | 83.3% |
| 4. share of roads ≤ 30km/h of roads with mixed traffic | 80.5% |
For the parish Parque des Nações in Lisbon, it was also examined what the effect on the KPI was of including roads with a recommended speed of 30km/h or lower and roads on which the intended speed limit is 30km/h or lower but legal signage is lacking. The results are summarized in Table 5. In case all mentioned types of roads are included, the share of safe roads increase to 19%.
| Definition | Share of safe roads (%) |
|---|---|
| 1. share of 30km/h roads | 8.8% |
| 2. share of roads with a safe speed limit for cyclists | 13.7% |
| 3. including roads with recommended speed limit ≤ 30km/h | 18.6% |
| 4. including roads with intended speed limit ≤ 30km/h | 19.1% |
5. Discussion
5.1. Lessons learned from the pilot studies
From the pilots, a number of lessons can be learned regarding the estimation of the KPI share of 30km/h roads. First of all, urban roads and 30km/h roads needed to be selected in different ways in the different countries as the local context and available data differ between countries. As a result, it is not possible to provide detailed guidelines with specific instructions on how to select urban roads and 30km/h roads. Someone with knowledge about the local context and experience with the database in a specific country should decide what is the best method to select urban and 30km/h roads, given the general instructions in the guidelines (Weijermars, Van den Berghe, Uijtdewilligen, Van Petegem, Odijk, et al., forthcoming). It is recommended to test out different selection criteria and to have a critical look at the data and estimated KPI values. The revealed differences in KPI values between countries can partly be due to differences in selection criteria. Although results from one country cannot be generalized to other countries, the results concerning the impact of different selection criteria in the Netherlands give a first indication of the effect of different selection criteria.
Secondly, the pilot in Lisbon shows that the data on speed limits in databases might not be correct or up to date and that the quality of the data might differ between areas. Therefore, it is important to check the quality of the data that is used to calculate the KPI.
Third, in case a country has no national database (or combination of databases) available that can be used to estimate the KPI, other data sources might be used. From the Dutch pilot it was concluded that OpenStreetMap (OSM) could be used in the Netherlands to estimate the KPI, although an assumption needed to be made about the speed limit of roads for which the speed limit was missing. The quality of the data in OSM differs between countries and therefore it is recommended to check the quality of the data before using OSM to estimate the KPI. Another possibility is to purchase commercial data as was done in the Bulgarian pilot. As it concerns quite extensive GIS-data it was decided to work with a contractor that was familiar with the data.
Fourth, the pilot showed that the share of 30km/h roads differs considerably between municipalities and even areas within one municipality. Therefore, it is recommended not to calculate a nationwide KPI value using a (limited) sample of cities in case data is only available for a number of cities. Instead it is recommended to determine and report on this KPI for the cities for which data is available.
Finally, some lessons can be drawn concerning the additional KPIs related to the concept of safe speeds for cyclists and pedestrians. First of all, it appeared to be quite complicated to operationalize and estimate these KPIs. The operationalization differed between the pilot countries and none of the pilot countries took pedestrians into account. Secondly, in the Netherlands, both variations of the ‘safe speed KPI’ were applied and they resulted in comparable shares of roads with a safe speed limit. It is not clear yet whether these results can also be generalized to other countries.
5.2. Added value and limitations of the KPI share of 30km/h roads in built-up areas
The KPI share of 30km/h is a valuable addition to the KPIs that were developed in Baseline as it enables policy makers to monitor and improve the safety of their road infrastructure in built-up areas. Moreover, the addition of this KPI to the standard set of KPIs could be a motivation for road authorities to increase data availability and data quality. The pilots showed that it is possible to calculate the KPI, although there will be some differences in selections due to data availability and local context.
It is recommended to start with the basic indicator Share of 30km/h road length of the total length of urban roads as it provides a good first indication of the safety level of urban roads, is relevant from a political and societal point of view, and is not too complicated to determine. However, from a safety point of view, a speed limit of 30km/h or lower is only necessary in case conflicts can occur between pedestrians/cyclists and motorized vehicles. The proposed additional indicators better reflect whether the speed limit is actually safe for pedestrians and cyclists. These additional KPIs are however more difficult to determine and their operationalization requires further research. The main issue to further elaborate is when pedestrians and cyclists are physically separated from motorized traffic and are not expected to cross at road sections. Moreover, in case one looks at speed limits that are safe for pedestrians and cyclists, one also has to consider intersections. At intersections, conflicts between pedestrians/cyclists and motorized vehicles are in general possible (unless cyclists and pedestrians are not allowed on both crossing roads) and therefore, speeds have to be reduced to 30km/h at intersections.
Another important limitation is that the safety level of a certain road depends on the actual driven speeds rather than the speed limit. So, ideally, in addition to the KPI share of 30km/h roads, also the actual speed should be taken into account. Within Baseline, a KPI for safe speed is defined. This KPI should also be applied to 30km/h roads and the results should be taken into account when analysing the safety level of urban roads.
Although it appeared to be possible to calculate the KPI for the pilot countries, not all (EU) countries will have the necessary data to calculate the KPI. Within Trendline, a survey was conducted among the countries that are involved in the project and from that survey (Odijk & Wijemerars, forthcoming) it was concluded that only a limited number of countries have a national database and/or regional/local databases that could be used to estimate the KPI for the entire country or some cities/regions. Some other countries might be able to use OSM or to purchase commercial data to determine the KPI, yet some countries might not be able to calculate the KPI using available data. An alternative option could be to distribute a questionnaire among municipalities in which municipalities are asked to estimate the share of 30km/h roads in their municipality. Such an approach was used in the Netherlands in 2009, when a survey was conducted to estimate the share of 30km/h roads and 60km/h roads as well as some characteristics of different types of roads (Weijermars & Wegman, 2011). The results of this survey are in line with more recent estimations based on queries on databases. Another possibility is the use of an alternative KPI, namely the share of municipalities with a default speed limit of 30km/h or lower on urban roads. For more information on this alternative KPI, please see Weijermars, Van den Berghe, Uijtdewilligen, Van Petegem, Odijk, et al. (forthcoming).
5.3. Directions for future research
The pilot tests discussed in this paper provide a first indication of the share of 30km/h roads in urban areas in various countries and of the consequences of various choices related to the selection of 30km/h roads. It is recommended to determine the KPI for more countries and to further investigate the consequences of various choices concerning the selection of urban (30km/h) roads and the useability of OSM in various countries.
Moreover, it is recommended to do further research on the additional KPIs related to safe speeds for cyclists and pedestrians. More specifically, it is recommended to investigate possibilities regarding operationalization of the concept of physical separation of pedestrians and cyclists and to analyse consequences of choices made for the resulting KPI. Special attention should also be paid to intersections and crossing.
Another direction for further research is the relation between the KPI score and the actual safety level. A higher share of 30km/h roads is expected to lead to lower risks of severe crashes, based on a known relation between speed and crash probability and severity (e.g. OECD/ITF, 2018; SWOV, 2021). However, the crash risk is related to actual speeds rather than the speed limit and therefore it is necessary to analyse what the impact of a reduction in speed limit is on actual driving speeds (e.g. average speed, standard deviation, V85). Another possibility is to do a before and after analysis (preferably with control group) of reducing speed limits in certain urban areas.
Finally, further research could also relate to setting target values for this KPI. For this KPI, the ultimate target value should not be set to 100%. To prevent rat running through residential areas it is important to have main arterials with a speed limit of 50km/h or 70km/h, which should be designed in such a way that 50km/h or 70km/h is the safe speed. Experience from the Netherlands (Dijkstra & Petegem, 2019) suggests a target value around 85% could be used as a first indication in the Netherlands; however this target may be too high or too low in countries and regions with different road network infrastructure and/or traffic composition. It is recommended to do more research into the optimal target value.
6. Conclusions
From the pilots discussed in this paper it can be concluded that it is possible to estimate the KPI Share of 30km/h road length of the total length of urban roads using available local, national and/or international databases. It is important to check the quality of the data on speed limits as these data might be set to a default value, missing or outdated. The share of 30km/h roads differs considerable between countries, although the difference may partly be caused by differences in selections due to data availability and local context.
The proposed KPI provides insight into the safety level of urban roads and can be used to evaluate policy measures and monitor progress in the share of 30km/h roads, potentially in relation to a target. More research is needed though on the optimal target value, which should not be set to 100% for this KPI.
In addition to the basic KPI, some additional KPIs related to the concept of ‘safe speeds for cyclists and pedestrians’ were explored in the pilot studies. These additional KPIs better reflect the actual safety level of urban roads for pedestrians and cyclists, but from the pilots it can be concluded that these additional KPIs are more difficult to determine. More research is needed in relation to the further development of these KPIs.
Acknowledgement
The research that is reported in this paper was part of the Trendline project which is funded by the European Union under grant agreement No. MOVE/C2/SUB/2022-54/CEF/TA/SI2.892654. The Key Expert Group (KEG) contributed to the development of the proposed KPI as well as the additional indicators that are discussed in this paper. In addition to the authors of this paper, the following people were part of the KEG: Anastasiosos Dragomanovits, (NTUA, Greece), Helga Mondésir & Manuelle Salathé (ONSR, France), Ivan Petkov (SARS, Bulgaria), Adelaide Costa, (ANSR, Portugal), Lars Ekman & Mats Pettersson (Trafikverket, Sweden). The authors would like to thank these people for their contribution to the development of the KPI.
An earlier version of this paper was was presented at the 36th ICTCT conference, held in the Hague, the Netherlands, on 17–18 October 2024.
CRediT contribution
Wendy Weijermars: Conceptualization, Methodology, Supervision, Writing—original draft, Writing—review & editing. Elisabete Rodrigues: Supervision, Writing—review & editing. Johannes Mesimäki: Formal analysis, Investigation, Methodology, Writing—review & editing. Simon Sternlund: Formal analysis, Investigation, Methodology, Writing—review & editing. Maria Georgieva: Conceptualization, Formal analysis, Methodology, Validation, Writing—review & editing. Jan Hendrik van Petegem: Conceptualization, Data curation, Formal analysis, Investigation, Methodology, Software, Validation, Visualization, Writing—review & editing. Teun Uijtdewilligen: Data curation, Formal analysis, Investigation, Methodology, Writing—review & editing. Augusto Torbay: Supervision, Writing—review & editing. Ana Amaro: Data curation, Formal analysis, Investigation, Methodology, Project administration. Ana Vidigal: Data curation, Formal analysis, Investigation, Methodology, Project administration. Fernando Rosa: Supervision. Wouter Van den Berghe: Conceptualization, Methodology, Writing—review & editing.
Data availability
The research described in this paper consists of several pilot tests in various countries. Some of the data and program code is available on request to the authors. Please contact the corresponding author for more information.
Declaration of competing interests
The authors report no competing interests.
Ethics statement
As no additional data was collected for this research and data analyses on existing databases did not include any personal data, this study did not require an ethical approval.
Funding
This research was part of the Trendline project, which is funded by the European Union under grant agreement No. MOVE/C2/SUB/2022-54/CEF/TA/SI2.892654.
Declaration of generative AI use in writing
The authors declare that no generative AI was used in this work.
Editorial information
Handling editor: Aliaksei Laureshyn, Lund University, Sweden
Reviewer: Torkel Bjørnskau, Institute of Transport Economics, Norway