Comparative analysis of methodologies for in-built road safety assessments
Abstract
In-built Network-wide Road Safety Assessment (IRSA) procedures involve the visual inspection of road design characteristics, and assigning scores to sections of the road network based on the availability and condition of the road characteristics. The main objective of the study was to evaluate two IRSA methodologies developed for rural highways, that is the Simplified methodology, and the Networkwide Proactive methodology (NWA Proactive). Both methodologies are applied on a 10.41 km, two-lane undivided rural road section in Latina Province, Italy. The assessment focused on comparing the reliability and predictive performance of these methods. The results revealed that the level of agreement of the rankings from both methods is moderate, while, they both showed poor correlation with crash history. This indicates that there is a need for continuous testing and development of IRSA methodologies since existing ones have a great variation in terms of the choice of parameters such as; risk factors, segmentation approach, risk formulation, and ranking categories. The insights derived from this study are very relevant to road technicians and practitioners involved in road safety assessment procedures.
1. Introduction
Road Safety Assessment (RSA) procedures are applied to investigate the level of safety of sections within the road network. Traditional RSAs were conducted based on historical crash data recorded on an existing road for at least three to five years (Elvik, 2008). Safety Experts and Practitioners have criticized these methods largely because they require road users to die before the assessment can be performed. Also, the method faces several data limitation issues such as under-reporting, missing, and poorly managed Police crash records. In the early 2000’s, alternative approaches for safety assessments began to emerge based on the visual inspection of the physical characteristics of the road infrastructure. These new methods have been given different names in similar studies including proactive methods (European Commission, 2023), Road Assessment Programs (Luca et al. 2016), Road Safety Inspection Procedures (Montella 2005, Cafiso 2007), and In-built Road Safety Assessments (Gonzalez-Hernández et al.2024). However, in this study, they are referred to as In-built Network-wide Road Assessment (IRSA) procedures. Since 2000’s, several of these methodologies have been developed. Gonzalez-Hernández et al. (2024), conducted a systematic review that revealed that there currently exists 14 IRSA methodologies for the safety assessment of rural roads. While there has been a significant focus on developing various IRSA methodologies, less attention has been dedicated to evaluating and comparing the unique strengths and limitations of existing methods. Meanwhile, these methodologies vary significantly in terms of the choice of parameters adopted including segmentation approach, road infrastructure characteristics considered, scores or weights assigned to road characteristics, road safety index formulation, and ranking categories. For instance, existing methods rely on quantitative and qualitative scores; quantitative scores are scores that are already measured such as Crash Modification Factors (CMF), which are crash risk values assigned to each road design characteristic depending on its availability and condition. On the other hand, qualitative scores are used, and they are subjective values assumed to represent crash risks of road attributes, such as 1.0, 0.5, and 0 which signify high-level, low-level, and no problem, respectively. This disparity in scoring methods determines the final risk scores assigned to a road section, which eventually leads to the choice of ranking category. In this regard, this study chose to compare the strengths and limitations of the NWA Proactive and the Simplified methodology since they both share similar scoring methods and the outputs are provided in different ranking categories. At the end, the study seeks to demonstrate that despite the similarities observed in some of these methodologies, they still produce different outputs. Therefore, there is a need to standardize IRSA methodologies to enable benchmarking of results within organizations or countries. Table 1 presents a comparison of existing parameters in some selected methodologies. The methodologies reviewed are the IRSA procedures that assesses road design characteristics, allocating scores to each attribute based on its condition, standard, and availability. IRSA procedures based on other characteristics such as human factors, vehicle operating speeds were not considered.
| Author | Parameters | ||||
|---|---|---|---|---|---|
| Segmentation approach | Road type & main attributes | Scoring method | Analysis approach | Ranks | |
| De Leur & Sayed. (2002) | Fixed segment: 200 meters | Rural: 6 Urban: 7 |
Qualitative scores | Risk-based | Binary |
| Montella (2005) | Fixed segment: 200 meters | Rural road: 10 | Qualitative scores | Risk-based | Binary |
| Cafiso et al. (2007) | Fixed segment: 200 meters | Rural road: 08 | Qualitative scores | Risk-based | Binary |
| iRAP (2009) | Fixed segment: 100 meters | Rural road: 54 | Quantitative scores | Risk-based | 5 classes |
| Li et al. (2010) | Variable segment lengths | Rural road: 20 | Qualitative scores | Risk-based | Binary |
| Brodie et al. (2013) | Fixed segments: 100m & 5km | Urban road: 04 | Quantitative scores | Risk-based | 5 classes |
| Zumrawi (2016) | Variable sections | Rural highways: 5 | Qualitative scores | Expert-based | 6 classes |
| Tripodi et al. (2020) | Fixed segment: 100 meters | Rural road: 20 | Quantitative scores | Risk-based | 5 classes |
| European Commission, (2023) | -Fixed segment: 500 meters-Variable segments |
Primary and Motorways: 10 | Quantitative scores | Score-based | 3 classes |
In Table 1 above, different aspects of the methodologies were identified including how the segmentation was carried out, the type of road and the number of attributes assessed, how the road attributes were scored, the risk formulation used, and the different ranking classes used for classifying the quantity of risks per road segment. In terms of segmentation, the review showed that fixed segmentation is the most commonly applied method of segmentation with fixed lengths varying between 100 – 500 metres. For the road types, the review indicated that the focus has been on rural roads, with less attention to urban roads. Next, two scoring methods commonly applied include the quantitative and qualitative scoring methods. Quantitative scores refers to the used of values (ie scores) that have been measured or estimated, which are applied based on the condition, standard and availability of the road feature, for example CMFs values are quantities already estimated and used for allocating as scores (IRAP 2009, Tripodi et al., 2020, and European Commission, 2023). On the other hand, qualitative scores refers to values subjectively assumed to represent the condition and standard of a road attribute for instance, a score of 0 is assigned if the attribute is not present, and a score of 1.0 is assigned to the attribute if the attribute is present (Montella, 2005). In terms of the analysis approach, majority of the methodologies are risk-based, that is they are developed based on the three risk components (probability, consequence, and exposure). Another method of analysis is the expert-based approach, which is very subjective as it depends primarily on the experience and training of the safety inspector. The last aspect identified is the ranking of the risks quantified for each road section/segment. Early methodologies relied on binary classification (hazardous or non-hazardous), while continuous research has resulted to multi-classification that vary between 3 to 5 classes.
Based on the characteristics examined above, the overall objective of this paper is to compare the performance of IRSA methodologies that share similar characteristics. As such, two methodologies were identified based on their similarities in terms of data collection, risk attributes considered, the scoring method, and the risk formulation. These methodologies are: (i) The Simplified methodology (Tripodi et al., 2020), and (ii) The European NWA Proactive component methodology (European Commission, 2023). These two IRSA methodologies were applied on a 10.481km two-lane undivided rural road section in Borgo Piava in Italy. Comparisons of the reliability in the rankings and the validity of the two methods were evaluated. The sections that follow provides the methodological framework and a description of the two methodologies, then assessment, and comparison of reliability and predictive performance of the methods.
2. Methodology
2.1 Method
Overall, the study evaluates these two main IRSA methodologies: Simplified Road Safety Assessment Methodology (Tripodi et al. 2020) and Networkwide Proactive method (European Commission, 2023). The methodology applied is as shown in Figure 1 below:
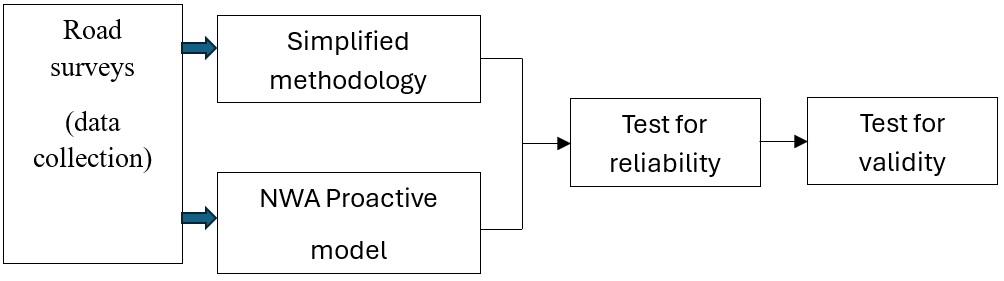
The methodology begins with a survey of the road under study. This consists of driving along the road and recording videos showing the main elements of the road. The videos are later viewed and based on the condition of the physical attributes considered by each methodology, scores are then assigned to each attribute. The analysis according to the simplified methodology was performed using the automated ‘Road Analyst’ software developed by the research centre of Transport and Logistics at Sapienza University of Rome, while the NWA Proactive component was performed using the Excel sheets provided by the European Commission. The results from the Simplified methodology are provided in five classes, while that from the NWA Proactive component are of three classes. To facilitate the comparison of the results, the five classes were converted into three classes using the method of averaging scores (Cafiso et al., 2015, Persia et al., 2020, and Gonzalez et al. 2025). Thereafter, the level of agreement (that is reliability) between the rankings from the two methodologies are evaluated using Cohen’s Kappa statistics. Also, the validity of the results from the two methodologies are determined by comparing with the expected crashes for the road, using the EB method (Montella 2005, Cafiso et al., 2007).
2.2 Simplified road safety assessment methodology
The methodology estimates risk per road section every 100 meters and the risk is assessed for three types of road users: Motor-vehicle occupants, pedestrians, and cyclists. It is a risk-based safety index developed by combining the three main risk components, that is, danger (probability of crash occurring), Vulnerability (consequence of a crash that occurred), and Exposure (the amount of activity a road user is exposed to). Mathematically, this can be written as shown in Equation (1).
\begin{equation} \text{Risk (R)} = \text{Danger (D)} \times \text{Vulnerability (V)} \times \text{Exposure (E)}\tag{1} \end{equation}2.2.1 Danger score
The danger score (D) is calculated separately for each road segment and intersection as presented in Equation (2) and (3) respectively.
\begin{equation} \text{Dcr} = \text{CMF}_1 \times \text{CMF}_2 \times\ldots\times \text{CMF}_{\text{n}}\tag{2} \end{equation} \begin{equation} \text{Dci} = (\text{Aint} + \text{Aacc}) \times \text{CMF}_1 \times \text{CMF}_2 \times\ldots\times \text{CMF}_{\text{n}}\tag{3} \end{equation}Where; Dcr and Dci are the danger scores for segment and intersections, Aint and Aacc are the crash modification factors for intersection type and accesses, CMF1 x CMF2 x ……..x CMFn are crash modification factors for risk factors that increases the probability of a crash.
2.2.2 Vulnerability score (V)
The Vulnerability score (V) represents the risk of a crash severity. It is determined as in Equation (4)
\begin{equation} \text{V} = \text{SW} \times \text{A}_1 \times \text{A}_2\ldots\ldots\times \text{A}_\text{n}\tag{4} \end{equation}Where; SW is the vehicle operating speed attribute, A1 x A2 …….x An are the attributes for median type and roadside severity.
2.2.3 Global Risk Score (GRS)
Based on the danger and vulnerability scores, GRS is calculated considering pedestrian and cyclist flows as indicated by Equation (5).
\begin{equation} \begin{array}{rcl} \text{GRS} &=& (\text{S_PED} \times \text{w_PED} + \text{S_CYC} \times \text{w_CYC} + \text{S_Mv})/\\ &&(\text{w_PED} + \text{w_CYC} +)\tag{5} \end{array} \end{equation}Where; S_PED, S_CYC & S_Mv: total risk scores for Pedestrians, Cyclists, and Motor vehicle occupants respectively.
w_PED & w_CYC: weight factors for Pedestrians and Cyclists. Since the road under study is a rural highway, we ignored traffic volume of pedestrians and bicyclists, thus, GRS = Motor vehicle (MV Score).
2.2.4 Risk categories
Based on the GRS calculated values and the defined threshold criteria, the road sections are then classified into one of the five classes shown in Table 2.
| GRS Value | Risk category | Risk color |
|---|---|---|
| GRS < 1.80 | Very low risk | Green |
| 1.8 < GRS < 3.4 | Low risk | Yellow |
| 3.4 < GRS < 6.8 | Medium risk | Dark orange |
| 6.8 < GRS < 17.5 | High risk | Red |
| GRS >17.5 | Very high risk | Black |
2.3 Networkwide proactive (NWA proactive)
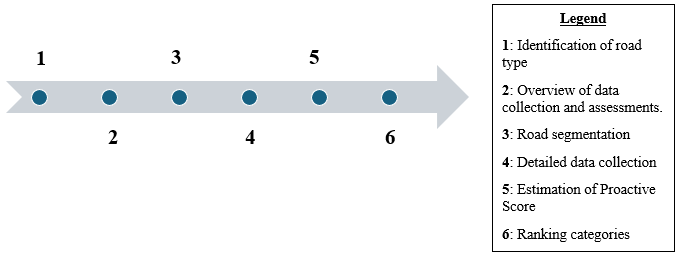
2.3.1 Identification of road type
The process begins by identifying the road type, whether it is a motorway (rural or urban), or a primary road (divided or undivided).
2.3.2 Overview of data collection
An overview of data is collected to facilitate the road segmentation process. Data collected at this point include traffic volume data (AADT), speed limits, number of lanes,
2.3.3 Road segmentation
There are two options for the segmentation process; either consider fixed segments of length 500 meters each, or segments of variable length ranging from 2 – 5 km per section depending on the parameters collected in section 2.2.3.
2.3.4 Detailed data collection
After the segmentation, detailed data is then collected for each segment. The data collected vary depending on the road type selected. This data include: lane width, roadside, curvature, interchanges, conflicts between Pedestrian, Bicyclists, and Motorcyclists,
2.3.5 Estimation of Proactive Score
The Proactive Score is determined based on the Reduction Factors (RF) of each road parameter. The RF is calculated as the inverse of the CMF of that road parameter (i.e. \(\text{RF} = \frac{1}{CMF}\)). The Proactive score considers that an ideal road section starts with a score of 100, which is then multiplied with the RF of each road parameter as shown in Equation (6).
\begin{equation} \text{Proactive Scorei} = 100 \times \text{RF}_{1\text{i}} \times \text{RF}_{2\text{i}} \times \ldots\ldots\ldots \times \text{RF}_\text{ni}\tag{6} \end{equation}Where; RFi: Reduction factors
2.3.6 Ranking categories
Based on the Proactive score value, and the defined threshold criteria, the road sections can be classified in any of the three classes shown in Table 3.
| Risk category | Risk score | Color |
|---|---|---|
| Low risk | Score ≥ 80% | Green |
| Intermediate risk | 50% ≤ Score < 80% | Yellow |
| High risk | Score < 50% | Red |
2.4 Case study
2.4.1 Selected road section
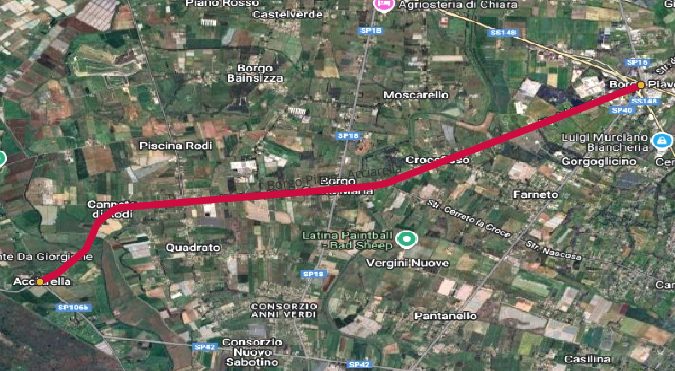
The road section under study is the Provincial road, named “Borga Piave Acciarella” (a State Provincial road number 38), located in Latina Province, within the Lazio Region, in Italy. It is a two-lane undivided rural highway, of length 10.481km, and connects the two towns, Acciarella (km 0 + 000) through Borgo Santa Maria and ends at Borga Piave. The road section is illustrated as shown in Figure 3.
2.4.2 Data collection
The visual Road Safety Inspection (RSI) was conducted on 23rd November 2024, by recording videos for the road section under study. The process began with mounting a Nextbase 612GW camera on the windshield of the vehicle. The camera records the full view of the road together with GPS locations, and time. Next, a video calibration was performed to appraise the camera position on the windshield and ensure it properly captures the full view of the road. The process consists of placing a white sheet of paper with dimensions 2m x 2m and at least 4 meters in front of a vehicle, and fixing the camera to align with the paper. After the camera was installed, we also positioned a Smartphone on the dashboard of the vehicle. The phone contains the RoadLab Pro App developed by the World Bank, which autonomously collects road surface data as the vehicle travels along the road. The surface data is required later for road assessment. With the camera and phone fixed, we started driving along the road and recording the full view of the road cross-section. The section is recorded for both directions at once since it is an undivided road.
2.4.3 Safety assessment
i) The Simplified methodology
The simplified methodology has been incorporated into a computer software called ‘Road Analyst” developed by the Research Centre of Transport and Logistic (CTL) of Sapienza University of Rome, Italy. The software automatically identifies and assigns scores to some road attributes once the videos are uploaded. The automated attributes are number of lanes, lane width, curvature, grade, delineation, vehicle speed, roadside, pedestrian crossing, pedestrian observed flow, and bicycle observed flow. The road surface attribute is obtained from the RoadLap App, while other attributes like area type, interception type, and access points were obtained from OpenStreetMap. In addition, attributes such as median type, speed management (traffic calming), paved shoulder width, sidewalk, facilities of bicycling, and motorcycle dedicated lane are inputted manually. Table 4 presents the attributes and their respective CMF values defined for the two methodologies under study.
ii) The NWA Proactive analysis
The European Commission simplified the assessment by providing Excel spreadsheets containing all the formulars, and requires only the manual inputs of the existing road parameters. As such, we downloaded the spreadsheets from the European Commission website and manually performed the analysis for the 21 road sections.
iii) The road parameters assessed
The two methodologies are assessed based on the in-built characteristics of the road infrastructures and Crash Modification Factors (CMF) are used to allocate as scores for each parameter depending on its availability and condition. However, the NWA Proactive model employed the inverse of the CMF values, known as Reduction Factors (RF). Generally, CMF value or crash risk can be higher or lower to one, representing negative or positive impact of crashes. In NWA, CMFs are converted to RFs to ensure the risk variables have a common scale and have the safest road condition with a RF = 1. As such, all the CMFs for a given road variable in NWA Proactive are normalized before the conversion into RFs. Equations (7) and (8) have been used in this process.
\begin{equation} \text{CMFj,norm} = \dfrac{CMF \ j}{CMF \ min}\tag{7} \end{equation} \begin{equation} \text{RFj} = \dfrac{1}{CMF \ j}\tag{8} \end{equation}| Risk factor | Simplified methodology | NWA Proactive | ||
|---|---|---|---|---|
| CMF value | CMF value (undivided road) |
|||
| Min. | Max. | Min. | Max. | |
| Lane width | 0.90 | 1.00 | 0.840 | 1.120 |
| Roadside | 1.00 | 1.45 | 0.766 | 1.143 |
| Curvature | 1.00 | 2.35 | 1.000 | - |
| Access points | 1.30 | 1.50 | 0.835 | 1.000 |
| Intersection type | 1.00 | 3.33 | ||
| Pedestrian crossing | 1.00 | 1.10 | ||
| Paved shoulder width | 0.85 | 1.50 | 1.000 | 1.211 |
| Number of lanes | 0.90 | 1.00 | x | x |
| Grade | 0.80 | 1.00 | x | x |
| Delineation | 1.00 | 1.25 | 0.900 | 1.000 |
| Median type | 0.85 | 1.00 | x | x |
| Area | 1.00 | 2.00 | x | x |
| Sidewalk | 0.95 | 1.15 | ||
| Speed management / traffic calming | 0.90 | 1.00 | x | x |
| Road surface | 1.00 | 1.40 | x | x |
| Motorcycles dedicated lanes | 0.50 | 1.00 | x | x |
| Facilities for bicycle | 0.50 | 1.00 | x | x |
| Passing lane | x | x | 1.000 | 1.149 |
| Markings and signs | x | X | 0.900 | 1.000 |
3. Results
The study aimed at comparing the reliability and validity of the Simplified methodology and the NWA Proactive methodology in a typical two-lane undivided rural road in Italy.
3.1 Measurement of reliability
In the study, we analysed the level of agreement in the results obtained from the two methodologies. To do this, we smoothened the 100 meters segments from the Simplified methodology, to match the consistent length of 500 meters as in the NWA Proactive. This process consists of taking the average scores of five segments of 100 meters as shown in Equation (9).
\begin{equation} \begin{matrix} \text{Averaging the scores}\\ \text{for 5 segments}\end{matrix} = \dfrac{Sum \ of \ risk \ scores \ for \ five \ 100 \ segments}{5}\tag{9} \end{equation}Also, we converted the five risk classes from the Simplified methodology into three classes as in NWA Proactive, using a conversion matrix as shown in Table 5.
| No | Simplified methodology ranking categories | NWA Proactive ranking categories |
|---|---|---|
| 1 | Class 1: very low risk | Low risk |
| 2 | Class 2: low risk | |
| 3 | Class 3: Medium risk | Intermediate risk |
| 4 | Class 4: High risk | High risk |
| 5 | Class 5: Very high risk |
Following the two adjustments above, Cohen’s Kappa (K) statistics was employed to measure the level of agreement between the ranking results from the two methodologies.
\begin{equation} \text{Kappa (K)} = \dfrac{Po - Pe}{1-Pe}\tag{10} \end{equation}The Cohen’s Kappa (k) value obtained was 0.54, which indicated that the level of agreement of the ratings from the two methodologies is moderately acceptable. This indicates that both methodologies perform well in the identification of potential high crash locations.
3.3 Comparison of Mv scores, NWA proactive score, and EB estimates
In this step, we compared performances of the MV scores from the Simplified methodology and the NWA Proactive scores with five years (2019-2023) historical crashes obtained for this road. The process began by estimating the predicted number of crashes, applying the EB method to determine the expected number of crashes, and comparing the results to those obtained for the two models.
3.3.1 Predicted crash frequency
We adopted the Accident Prediction Model (APM) developed for a typical Italian, two-lane undivided rural highway (Cafiso et al., 2010). The general form of the APM is:
\begin{equation} \text{E(Y)} = e^{\text{ao}} \cdot L \cdot AADT^{\text{a}1}\cdot \text{e}\sum_{j=0}^m b_jX_j[acc/year]\tag{11} \end{equation}Where E(Y) is the expected injury accident frequency / year; L is the length of the segment under consideration (km), AADT is the Average Annual Daily Traffic (veh/day), Xj is any of m-additional variables; a0, a1, and bj are the model parameters. The study chose the base model with the model parameters recommended by the Authors as shown in Table 6.
| Parameter | Estimate | K | AIC | Pearson χ2 | χ20.05 |
|---|---|---|---|---|---|
| a0 | -7.132 | 0.93 | 417.6 | 85.4 | 129.9 |
| a1 | 0.731 |
The study used five years’ crash data (2019 – 2023) obtained from the Italian Institute of Statistics (ISTAT) and AADT for this section was 500 vehicles/day, obtained from ASTRAL spa, a regional company in charge of the management of roads within Lazio Region, in Italy.
3.3.2 Expected crash frequency
The EB method was employed to combine the predicted crash frequency and the observed crashes in estimating the expected crash frequency at each section. This is estimated using Equation (9).
\begin{align} \text{Nexpected} = \omega \times \text{Npredicted} + (1-\omega) \times \text{Nobserved}\tag{12} \end{align}Where, ω, represent weights assigned to the predicted and observed number of crashes. The weight, w, is calculated using Equation (10).
\begin{equation} \omega = \dfrac{1}{(1 + K \times \sum Npredicted)} \end{equation}Where K, is the overdispersion parameter given in Table 3.
Both models showed a positive correlation with crash history however, the coefficients appear to be very small.
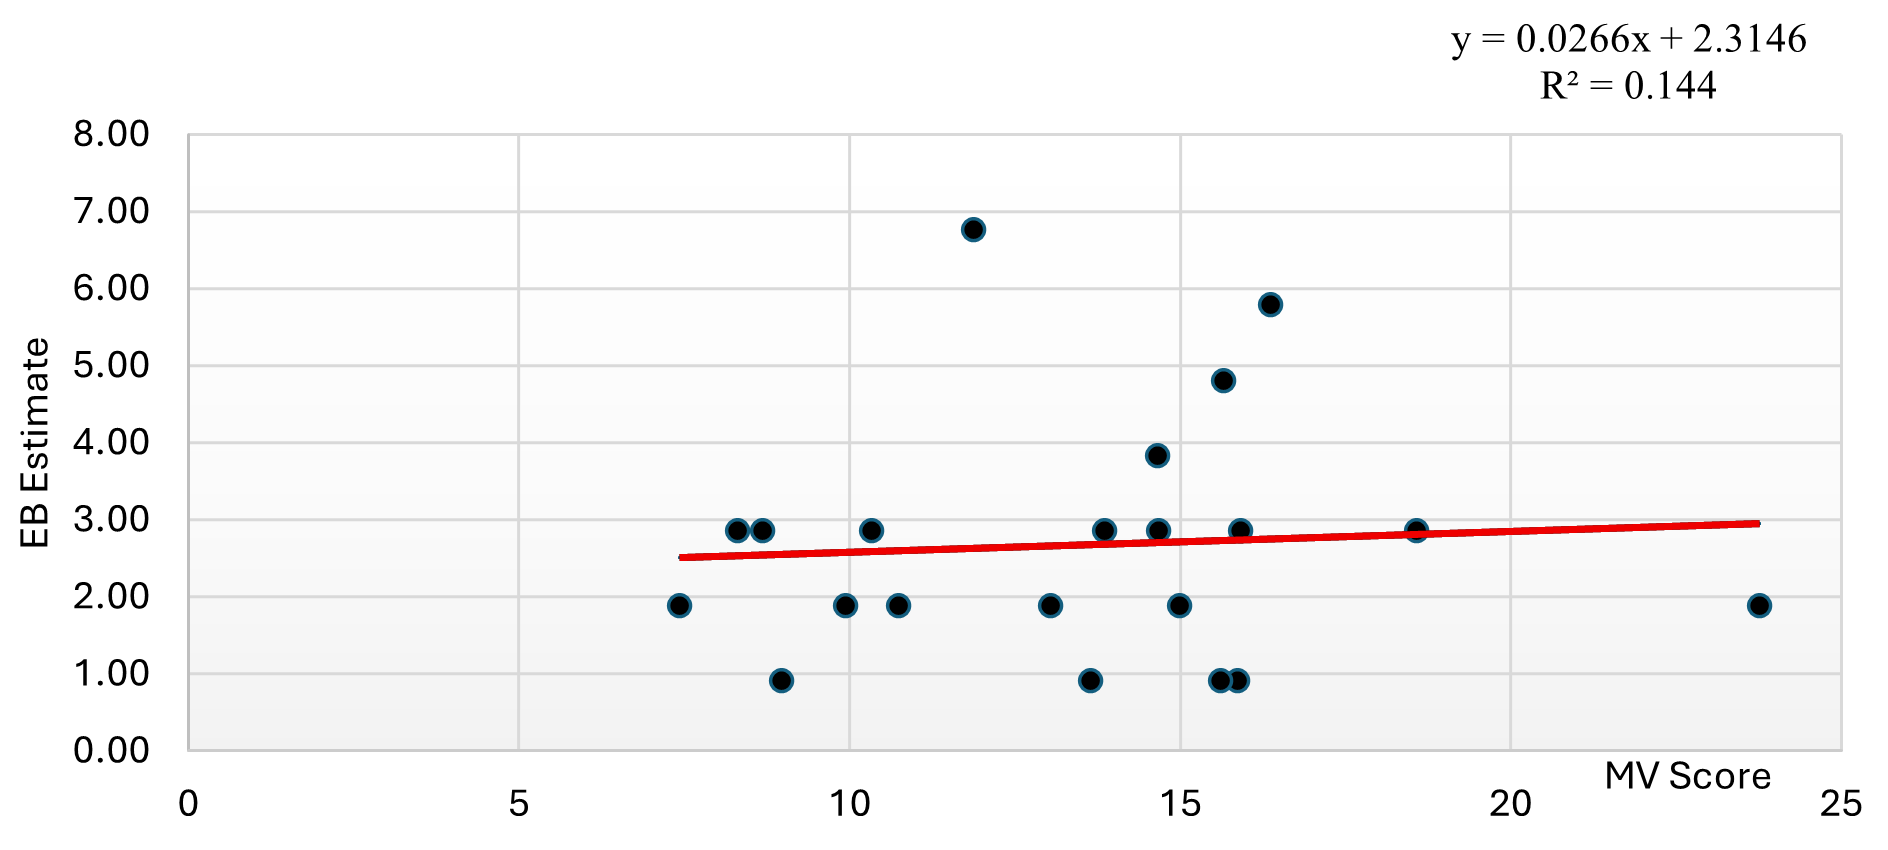
The results above ascertained that high risk scores (i.e. MV score) correspond to high crash locations. However, the correlation value is very low (less than 14%). This aligned with similar results obtained for the validation of the methodology in Belarus, with a correlation of 18% (Gonzalez et al. 2025). Overall, the effectiveness of the simplified methodology on European roads still requires further research.
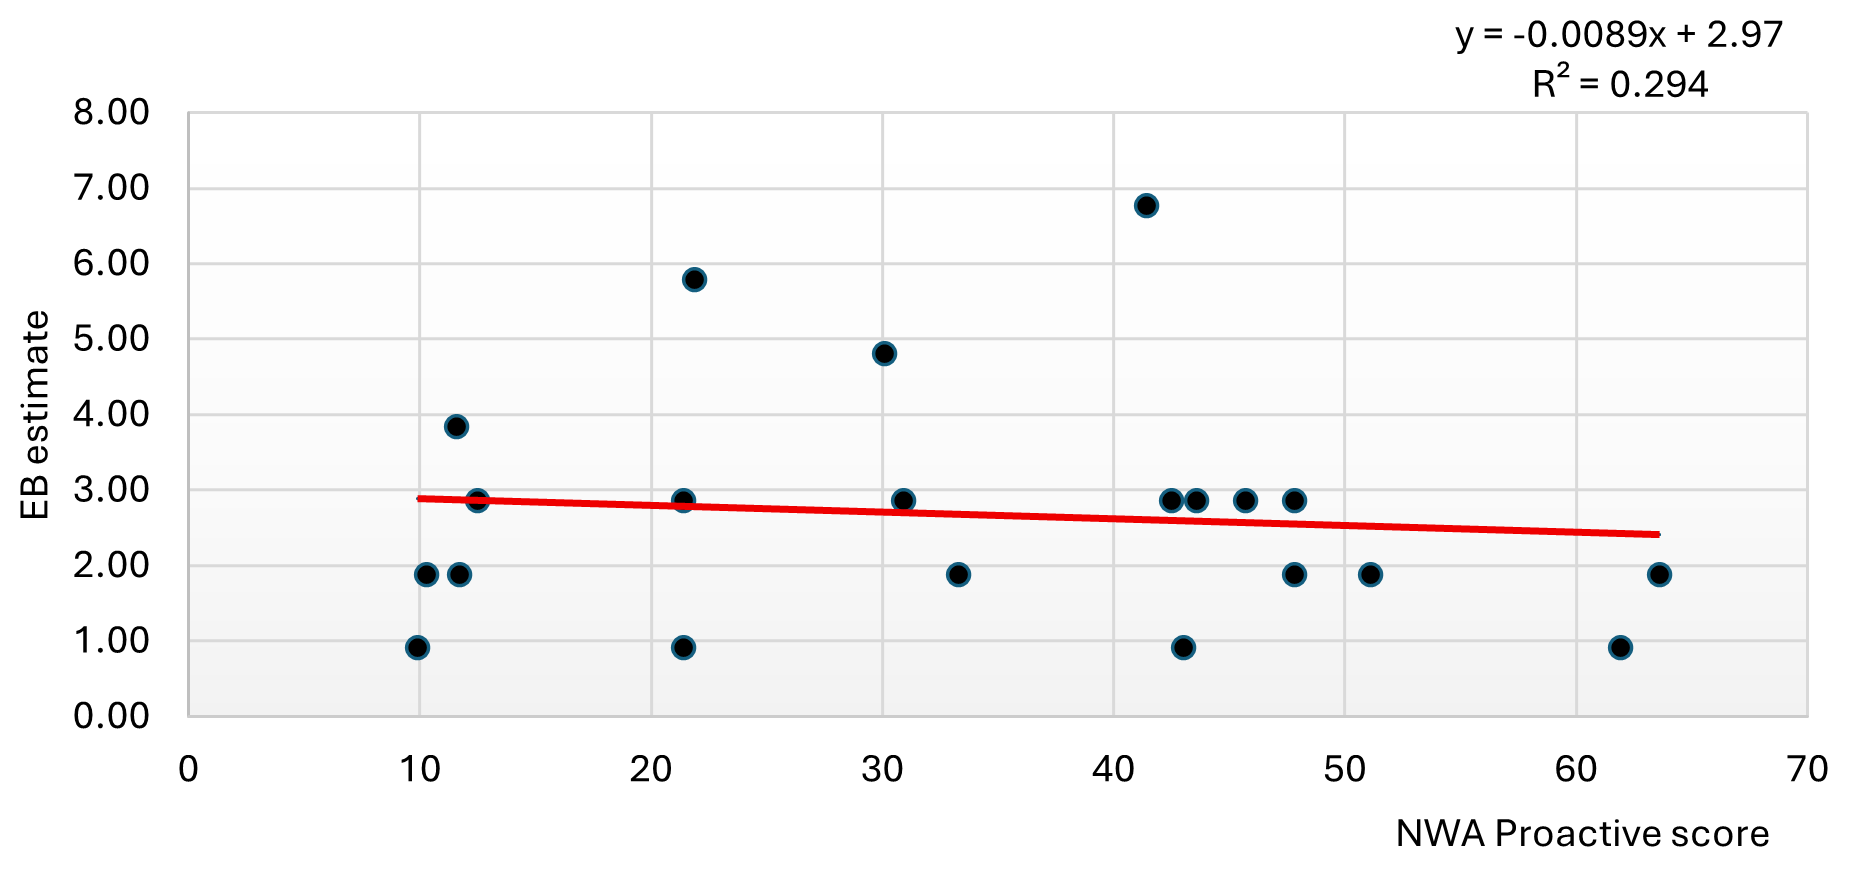
Figure 5 above shows a negative correlation between crashes and risk scores. This is fine because with the NWA Proactive component, high risk scores correspond to low-risk locations. Nevertheless, the correlation coefficient between the risk scores and expected crashes is very low, indicating the need for further investigation to improve performance.
4. Discussion and conclusion
INWA is the most widely accepted proactive method for road safety assessments. However, many of these methods have been developed lately but less attention is given towards comparison of the strengths and limitations of each method. In this study, we first matched the safety classes of the two IRSA methodologies to equilibrate the number of classes, and then compared the level of agreement of the rankings using their individual risk formulations and risks factors. The test for reliability showed that a moderate relationship exists between the rankings. Also, both models had a positive correlation with crash history, though the correlation coefficient was very insignificant. Amongst the two methodologies, existing studies indicates that only the Simplified methodology has been validated with a positive correlation coefficient of 0.18 (González-hernández et al., 2025). As of now, no study is available for the validation of the NWA Proactive, apart from pilot studies conducted in some selected European countries. Nevertheless, other IRSA methodologies have been successfully implemented in Italy and all had a positive correlation with crash occurrences (Montella 2005, Cafiso et al. 2007), with correlation coefficients of 0.930 and 0.870 respectively.
The main limitation of the study is that these results cannot be generalized because the sample length of road sections applied is too much as compared to, 406 km and 200km length of road sections applied by Montella (2005) and Cafiso et al. (2007) respectively. Another limitation is in the fact that the results from one of the methodologies is given in five classes, which requires conversion into three classes to facilitate comparison with the NWA Proactive results which is given in three classes. Thus, applying the method of averaging scores may have modified the actual risks level for some segments. This disparity in the number of ranking classes that is seen with existing IRSA methodologies limits the proper control of works at the level of international organisations like the European Commission. As such, future research should focus on the
CRediT contribution statement
Elvis Chia Ngwah: Conceptualization, Data curation, Methodology, Writing—original draft. Stephen Kome Fondzenyuya: Data curation, Methodology. Steffel Ludivin Feudjio Tezong: Data curation, Formal analysis, Visualization. Brayan González-Hernández: Methodology, Writing—review & editing. Davide Shingo Usami: Supervision, Writing—review & editing. Luca Persia: Supervision, Writing—review & editing.
Acknowledgements
An earlier version of this paper was presented at the 36th ICTCT conference, held in the Hague, the Netherlands, on 17–18 October 2024.
Declaration of competing interests
The Authors report no competing interests
Declaration of generative AI use in writing
Not applicable
Ethics statement
No potential conflict of interest was reported by the author(s)
Funding
Not Applicable
Editorial information
Handling editor: Carmelo D’Agostino, Lund University, Sweden.
Reviewers: Anđelo Marunica, University of Zagreb, Croatia; Andrea Paliotto, University of Florence, Italy.
Submitted: 1 July 2025; Accepted: 29 December 2025; Published: 20 January 2026.