Driver visual attention and in-vehicle touchscreen: the role of short training session
Abstract
The growing integration of in-vehicle centre stack touchscreens has enhanced driver access to information and control systems but raised significant safety concerns due to increased visual distraction. This study investigates whether a short pre-drive training session can mitigate distraction and improve driver interaction with in-vehicle touchscreen. Using a driving simulator and eye-tracking technology, 60 licensed Norwegian drivers were assigned to trained and untrained groups to compare visual attention patterns during secondary tasks involving touchscreen use. Results showed that while all participants exhibited high visual demand on the touchscreen, trained drivers demonstrated slightly lower fixation counts, shorter durations, and reduced self-transition probabilities within the touchscreen area, suggesting more efficient and potentially safer interactions. However, these differences were not statistically significant, indicating a limited effect of the short training provided. The findings highlight the complexity of the touchscreen interface and potential of pre-drive touchscreen familiarization in improving visual attention.
1. Introduction
The widespread adoption of in-vehicle centre stack touchscreens has become an important feature of modern vehicles. Touchscreens act as a main interface between drivers and In-vehicle Information Systems (IVIS) and allow drivers to perform a wide range of actions, including audio and media selection (e.g., choosing radio stations, playlists, or adjusting sound settings), managing phone calls through Bluetooth or integrated communication systems, adjusting climate control settings, accessing navigation systems, and interacting with other vehicle functionalities (e.g., activating Driver Assistance Systems). Hence, these touchscreen interfaces centralize many previously manual or physical controls into a single digital surface. However, while these touchscreens improve convenience, their use during driving has raised significant safety concerns (Dingus et al., 2016). To interact with the IVIS, drivers often divert their visual attention from the primary driving task to the touchscreen (Donmez et al., 2010). A key concern is the visual distraction created by IVIS, as drivers must frequently shift their focus from the road to interact with the touchscreen, thereby compromising their ability to detect hazards and react promptly. The level of distraction depends on the type of touchscreen operation, as not all touchscreen operations affect driver attention equally. Tasks that require visual search, or multiple steps, such as entering navigation destinations, browsing music lists, or managing text messages, tend to increase visual (and physical) distraction and reaction times more than simpler, single-step interactions (Ranney et al., 2001). For example, previous studies have demonstrated that navigation entry and complex menu browsing are associated with significantly longer eyes-off-road times compared to tasks such as adjusting climate settings or accepting an incoming call (Burnett et al., 2013; Feng et al., 2018). This aligns with the broader distraction literature, which shows that secondary tasks vary in their cognitive and perceptual demands, with visual–physical tasks posing especially high crash risk (Dingus et al., 2016). Touchscreen interfaces can differ significantly in terms of design, responsiveness, and menu complexity, which directly affect how quickly and safely drivers are able to interact with the IVIS. While some vehicles may feature large, user-friendly touchscreens with simplified layouts, others may include smaller displays with more complex navigation paths (Zhong et al., 2024). Such variability in interface design introduces a learning curve for drivers, particularly those unfamiliar with the system. As such, the ability of drivers to quickly adapt to a new touchscreen interface becomes critical for maintaining attention on the road. This shift in driver attention from the primary driving task to the touchscreen has been identified as a significant factor in the rise of distracted driving incidents, making it crucial to assess the impact of touchscreen use on driving performance and behaviour (Ma et al., 2022). Moreover, this issue may be further amplified in the context of the growth of car sharing services, where drivers frequently encounter unfamiliar vehicles equipped with a variety of touchscreen interfaces.
The existing literature emphasizes the dangers of distracted driving and suggests that training can mitigate drivers’ distraction level (Lenné et al., 2011). Nevertheless, evidence remains limited regarding the specific role of training in mitigating distraction caused by in-vehicle touchscreen interactions. As touchscreen-based controls become increasingly prevalent in modern vehicles, understanding their impact on driving performance and identifying effective countermeasures are essential (McDonnell et al., 2021). Short pre-drive training sessions focused on touchscreen use and in-vehicle system familiarisation may offer a practical approach to improving safe and efficient interaction with these interfaces. This is particularly relevant given the limited attention currently devoted to touchscreen technologies within formal driver education programs (Saetren et al., 2024).
1.1 Literature review
Distracted driving has been widely acknowledged as a leading cause of road accidents, and in-vehicle technology, particularly touchscreens, has intensified the issue. As these devices become more embedded in vehicle design, understanding their influence on driver behaviour and performance becomes essential for improving road safety (Bassani et al., 2023). An in-depth analysis of fatal road crashes in Norway reported that driver inattention to the primary driving task was a contributing factor in approximately 29% of all fatal accidents, with mobile phone distraction accounting for 2–4% and other in-vehicle secondary tasks contributing to about 8% of fatal crashes (Sundfør et al., 2019). While official accident statistics rarely distinguish between touchscreen interfaces and traditional physical controls, experimental and naturalistic studies consistently show that visually demanding in-vehicle interactions, particularly those requiring prolonged glances away from the road, are associated with elevated crash risk (Li et al., 2024; Mehrotra et al., 2023). In this regard, a considerable amount of research has been conducted to examine the impact of distraction due to secondary tasks on drivers’ visual attention and eye behaviour. With high risk associated with distraction condition, most researchers prefer driving simulator studies to maintain safe driving environment. Grahn and Kujala (2020) examined the influence of touchscreen size, user interface design, and subtask boundaries on the visual demand and distraction associated with in-vehicle secondary tasks. Through driving simulator experiments, the authors identified that while larger screens marginally decrease glance durations, the design of the user interface plays a more substantial role. Applications specifically designed for automotive use, particularly those incorporating features like speech-to-text and read-aloud functionality, were found to significantly reduce visual distraction compared to conventional smartphone applications. These results from Grahn and Kujala (2020) highlight the importance of well-designed task structures and interface elements. In another study, Kim and Song (2014) investigated the usability and safety of various touch gestures, such as flicking, panning, and pinching, in comparison to tapping for IVIS during driving. Their findings, based on the visual occlusion method, indicated that panning is both safe and practical for driving-related tasks. In contrast, flicking required refinement to minimize distraction, while pinching was associated with elevated visual demands and wrist discomfort, underscoring potential ergonomic challenges. Ebel et al. (2023) examined visual demand during touchscreen interactions in vehicles. The author identified key factors such as design elements, driving conditions, and specific scenarios that influence how drivers allocate their visual attention. The study highlighted the roles of interaction type, vehicle speed, and levels of driving automation in contributing to driver distraction. Ezzati Amini et al. (2023) found the impact of mobile phone distraction, specifically writing and reading text messages, on driver behaviour using a car driving simulator. The research examines driver responses under three scenarios: normal driving, intervention with fixed timing, and distraction-based interventions. Eye-tracking glasses revealed significant shifts in drivers' gaze patterns towards the intervention display during distraction. Key findings highlight increased lateral positioning deviation and reduced longitudinal acceleration during pedestrian collision risks and non-critical events under distraction. Ban and Park (2024) investigated the influence of nondriving-related task (NDRT) touchscreen location and task difficulty on driver performance, eye gaze behaviour, and workload during SAE Level 3 automated driving. Their driving simulator study found that touchscreen location significantly affected both NDRT and take-over task performance, with the lower right location being more effective for NDRT tasks but less suitable for take-over tasks. Moreover, task difficulty impacted the perceived workload during take-over scenarios. These findings offer valuable guidance for designing touchscreen interfaces and NDRT tasks in conditionally automated vehicles.
Beyond interface design and interaction characteristics, increasing attention has also been directed toward the role of driver training and familiarisation in mitigating distraction and supporting safer engagement with increasingly complex in-vehicle technologies. Zhang et al. (2025) compared three driver training formats: (i) conventional text-based instructions using owners’ manual, (ii) knowledge-based materials with visual aids, and (iii) simulator-based hands-on practice, to assess drivers’ understanding and safe engagement with vehicle automation. The authors concluded that all training types of significantly improved system comprehension, but the knowledge-based format produced the largest gains in both understanding, safe usage and more frequent use of Advanced driver assistance systems. Similarly, Murtaza et al. (2024) compared video-based and text-based (manual) training methods using driving simulator to evaluate user performance of driver assistance systems. Authors highlighted that video-based training leads to higher accuracy and faster reaction times compared with manual-based learning. Moreover, participants trained with videos also displayed more consistent responses, indicating stronger mental models. In another study, Krampell et al. (2020) evaluated a short, scenario-based training intervention designed to instigate more accurate mental models human-vehicle automation interaction. Participants who received short training showed significant improvements in system comprehension, clearer distinctions between driver vs. automation roles, and more appropriate supervision behaviour, indicating that targeted training can enhance users’ readiness for automated driving. Zahabi et al. (2021) evaluated two training approaches, video-based and demonstration-based using a driving simulator with 20 older adults. The findings indicated that demonstration-based training was more effective in reducing perceived workload, whereas video-based training showed a slight advantage for female participants by lowering cognitive load and enhancing knowledge acquisition. Despite these training-specific effects, both approaches led to similar increases in trust in vehicle automation, with no statistically significant differences between the two methods. In simulator-based study, Pradhan et al. (2023) examined three training approaches (i) visualization, (ii) text-based user manual, and (iii) Sham (control) training with 24 novice ADAS users. The results demonstrated significant improvements in mental model scores following training, particularly for the visualization and manual groups, whereas the sham training showed no effect. However, despite these gains in conceptual understanding, training did not lead to significant improvements in real-time response accuracy or reaction times. These findings suggest that while training can enhance user knowledge, such improvements may not immediately translate into more effective system interaction during driving. Noble et al. (2019) compared manual-based and interactive multimedia training for vehicle autopilot use and found minimal differences in knowledge and no significant effects on driver behaviour or attitudes. Familiarity increased mainly through hands-on experience rather than brief training. Eye-glance analysis showed longer off-road glances during automation, particularly among younger drivers, leading the authors to conclude that experience is more critical than short training for safe system use.
In general, previous studies have highlighted the critical role of visual distraction and training in connection with driver behaviour and performance. The present study examines the potential effects of an instructor-led short pre-drive training session on touchscreen interface usage and its possible influence on drivers’ visual attention. An earlier study by Hazoor et al. (2026) examined the same experimental context using conventional driving-performance metrics such as mean speed, standard deviation of speed, lane position, and standard deviation of lateral position. That work concluded that short pre-drive training did not significantly influence these performance measures. While those findings provided valuable insights into longitudinal and lateral control under touchscreen interaction, they did not capture the underlying visual behaviour that drives such performance outcomes. The present study extends this research question by analysing eye-tracking data to explore drivers’ visual attention patterns during touchscreen use. This complementary perspective is critical because visual distraction is a primary mechanism through which touchscreen interactions affect safety. By focusing on gaze behaviour, this study aims to uncover whether short pre-drive training influences drivers’ ability to allocate attention efficiently, thereby providing deeper understanding beyond what driving-performance measures alone can reveal.
1.2 Study objectives
This study aims to examine the effectiveness of an instructor-led short pre-drive training session on the use of in-vehicle touchscreen in reducing driver distraction. Using a driving simulator combined with eye-tracking technology, the study seeks to evaluate whether such short training enhances drivers’ visual attention and mitigates distraction. The research question guiding this investigation is: Does a pre-drive short training session improve drivers’ visual attention and reduce distraction when interacting with in-vehicle touchscreen?
2. Method
This study used a between-subjects experimental design to investigate the effect of short pre-drive training on drivers’ visual attention during in-vehicle touchscreen use. Sixty participants were assigned to either an untrained group or a trained group that received an instructor-led short training session on touchscreen operation. Participants completed a 13 km simulated motorway drive in a fixed-base driving simulator. During the drive, all participants performed secondary tasks by interacting with the touchscreen interface. Eye-tracking captured visual attention patterns, including fixation count, total fixation duration, and gaze transitions across defined Areas of Interests.
2.1 Participants
This study recruited 60 licensed drivers (24 females) from Norway, who volunteered via a social media platform (Facebook). Participants provided background information, including age, total years of driving experience, estimated annual driving distance, and any history of road traffic crashes. Eligibility criteria required participants to have normal vision or corrected-to-normal vision. To prevent bias, participants were not informed about the study's underlying hypothesis. Ethical clearance was obtained from the Norwegian Agency for Shared Services in Education and Research (SIKT), with approval documented under reference number 951733. Participants ranged in age from 23 to 55 years. Table 1 presents the demographic characteristics of the two groups, which were evenly divided (30 participants each) and balanced with respect to age, sex, and driving experience.
| Sex | No. | Age [years] | Driving Experience [years] | ||||
|---|---|---|---|---|---|---|---|
| Min | Mean (SD) | Max | Min | Mean (SD) | Max | ||
| Untrained (G1) | |||||||
| Males | 18 | 23.0 | 30.2 (9.5) | 52.0 | 5.0 | 10.9 (9.5) | 34.0 |
| Females | 12 | 23.0 | 27.9 (6.2) | 41.0 | 4.0 | 8.2(6.2) | 23.0 |
| Trained (G2) | |||||||
| Males | 18 | 23.0 | 30.8 (10.0) | 55.0 | 2.0 | 9.4 (9.9) | 37.0 |
| Females | 12 | 23.0 | 26.5 (3.6) | 33.0 | 5.0 | 7.4 (3.3) | 15.0 |
2.2 Equipment
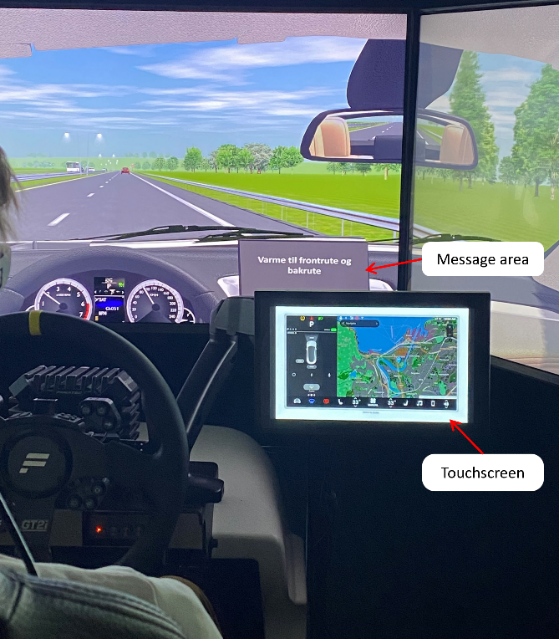
The experimental study was conducted using a fixed-base driving simulator at the TRAFIKKLAB, Nord University, Norway. The simulator, known as SimEASY, is operated via the SCANeR Studio™ platform developed by AV Simulation. The hardware setup features a driver cockpit including an automatic transmission, steering wheel, pedals, and an adjustable seat to replicate standard vehicle ergonomics. To simulate realistic driving sensations, the simulator is equipped with active force-feedback steering wheel, replicating tactile feedback such as wheel resistance and surface impacts. To immerse participants in a realistic driving environment, the simulation visuals were displayed across three 43-inch full HD LED monitors (1920 x 1080 resolution), arranged to provide a 140⁰ horizontal 27⁰ vertical field of view, operating at a refresh rate of 60 Hz. The visual display accurately replicates the interior of a car, including a functional dashboard and centre and side rear-view mirrors. A high-fidelity surround sound system generated environmental audio, including engine noise, traffic sounds, wind, and ambient background noise. Additionally, a seat-mounted vibration unit simulated vehicle vibrations and pavement roughness (Figure 1).
A 12-inch touchscreen interface was mounted on the right side of the steering wheel to perform the secondary tasks. This screen was placed 13 inches from the steering wheel centre to its outer edge, similar location of infotainment display as in actual vehicles. As shown in Figure 1, this setup allows easy access without requiring excessive arm extension (Ban & Park, 2024). The touchscreen simulated an in-vehicle infotainment system and offered a range of functions, including media playback, navigation, climate control, lighting adjustments, seat heating, and various other features typical of modern car dashboards. The interface design was adapted from an openly accessible online source to resemble current automotive user interface designs (Ebube, 2024). It is important to note that none of the participants had prior familiarity with the touchscreen interface employed in this study.
2.3 Simulated road scenario
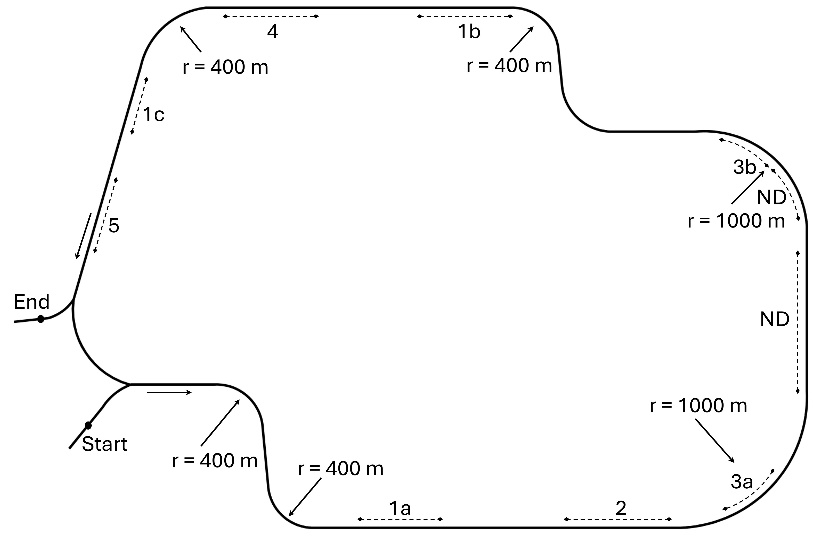
The simulated motorway alignment (Figure 2) used in this study was designed based on the Norwegian standards for geometric highway design (Statens Vegvesen, 2023). The roadway featured two lanes in each direction, each 3.5 m wide, with 1.5 m right shoulder, a 0.75 m left shoulder, and a 2 m central median. Safety barriers with a height 0.75 m were installed along the median and right roadside. The road signage and pavement markings adhered to the specifications outlined in the Norwegian Highway Code (Statens Vegvesen, 2021), with a posted speed limit of 90 km/h.
Participants began their drive from a lay-by area, after which they merged onto the main motorway via an entry ramp. The route consisted of three main motorway sections, incorporating two large horizontal curves (radius = 1000 m). Short tangents and low-radius curves were inserted between major sections to disrupt behavioural carryover. Data collected from these transitional sections were excluded from the analysis.
To support realistic curve negotiation and ensure smooth transitions between straight and curved roadway sections, spiral transition curves were integrated into the alignment design. The total length of the test route was limited to 13 kilometres, limiting the driving session under 20 minutes, reducing the likelihood of simulator-induced discomfort and sickness (Philip et al., 2003).
The scenario was intentionally designed without interaction with surrounding vehicles or traffic events (e.g., intersections or traffic lights). The level of service was set to category A (free-flow traffic) to ensure highly controlled driving conditions across all participants. This approach minimized variability in visual workload from traffic negotiation, thereby allowing the study to isolate the specific effects of touchscreen interaction and pre-drive training on eye-movement behaviour (Board et al., 2022). The use of curves and straight segments provided continuous but stable driving demands sufficient to maintain lane-keeping and speed-control tasks without introducing confounding safety-critical events.
2.4 Secondary tasks and training
2.4.1 Secondary tasks
Table 2 outlines the eight secondary tasks that participants were instructed to complete using in-vehicle touchscreen interface as part of the experimental procedure. These tasks were carefully selected to reflect typical interactions drivers might have with infotainment systems during real-world driving scenarios (Jørgensen & Hanssen, 2019). All participants were required to perform all tasks, irrespective of training conditions.
| Task ID | Description | Road section |
|---|---|---|
| 1a | Change of radio channel to “Radio Nova” | Tangent |
| 2 | Activate heating on front and back windshield | Tangent |
| 3a | Change driver temperature to 24⁰ C and passenger temperature to 26⁰ C | Curve |
| 3b | Change driver temperature to 20⁰ C and passenger temperature to 22⁰ C | Curve |
| 1b | Change of radio channel to “NRK P1 Finnmark”. | Tangent |
| 4 | Navigation: “pre-selected address” (same address for all drivers). | Tangent |
| 1c | Change of radio channel to “Toten Radio”. | Tangent |
| 5 | Change the fan direction to front windshield and legs. | Tangent |
Each secondary task was triggered at a predefined location along the simulated motorway. A visual prompt appeared in the dashboard’s designated "message area" (refer to Figure 1), informing the driver of the upcoming task. In line with the method proposed by Rydström et al. (2012), an audible beep signalled both the appearance and removal of task messages, ensuring clear and consistent communication. The operational zone for each task was restricted to a 600 m stretch of road, providing a consistent window for task execution across trials (Figure 2).
To examine the effects of task repetition on learning and its potential influence on driving performance, certain tasks were deliberately repeated. Specifically, the radio station change task (Tasks 1a, 1b, and 1c) was performed three times, while the climate adjustment task (Tasks 3a and 3b) occurred twice. These repetitions were designed to explore how familiarity with touchscreen tasks might impact driver attention and performance.
As shown in Figure 2, task locations were strategically distributed across different road geometries. Six of the tasks were performed along straight motorway segments (tangents), while two tasks, Tasks 3a and 3b were carried out on curved sections of the road. This distribution enabled a comparative analysis of driver performance in varied roadway contexts. Baseline driving was captured during the 600 m long task-free road segment (i.e., no distraction condition, ND) between the secondary task zones.
2.4.2 Short pre-drive training
To support the study’s objective of evaluating how training influences driver performance, participants assigned to Group 2 (Trained) completed a short pre-drive training session before beginning the experimental drive. The training was delivered as a guided demonstration on the use of touchscreen interface and lasted approximately 5 minutes for each participant. This session was designed to enhance their familiarity with the in-vehicle touchscreen system and to improve their ability to interact with it efficiently during the driving.
During the training session, an experimenter explained the layout and operation of the touchscreen system and demonstrated the execution of core functions, including navigation tools, entertainment features, climate control, and other driving related as well as non-driving functions. Participants observed but did not physically interact with the touchscreen. This observational training approach was intentionally chosen to ensure that all participants received identical information while avoiding variability in learning outcomes that could arise from differences in individual hands-on practice, pace, or skill acquisition.
All trained participants received standardized instruction, following an identical scripted explanation and demonstration procedure delivered by the same experimenter, ensuring consistency in training content and exposure across the group.
2.5 Eye tracking data
Eye-tracking was employed to quantify drivers’ visual attention during secondary task performance and to examine how short pre-drive training affected interaction with the in-vehicle touchscreen. For each distraction event, following core components were considered: Time of Interest (TOI), which defines the period of task engagement; Areas of Interest (AOI), which specify the visual regions analysed; and eye-movement metrics including Fixation Count (FC), Total Fixation Duration (TFD), and the Conditional Probability Matrix (CPM), which together provide a comprehensive assessment of visual attention allocation and gaze transitions.
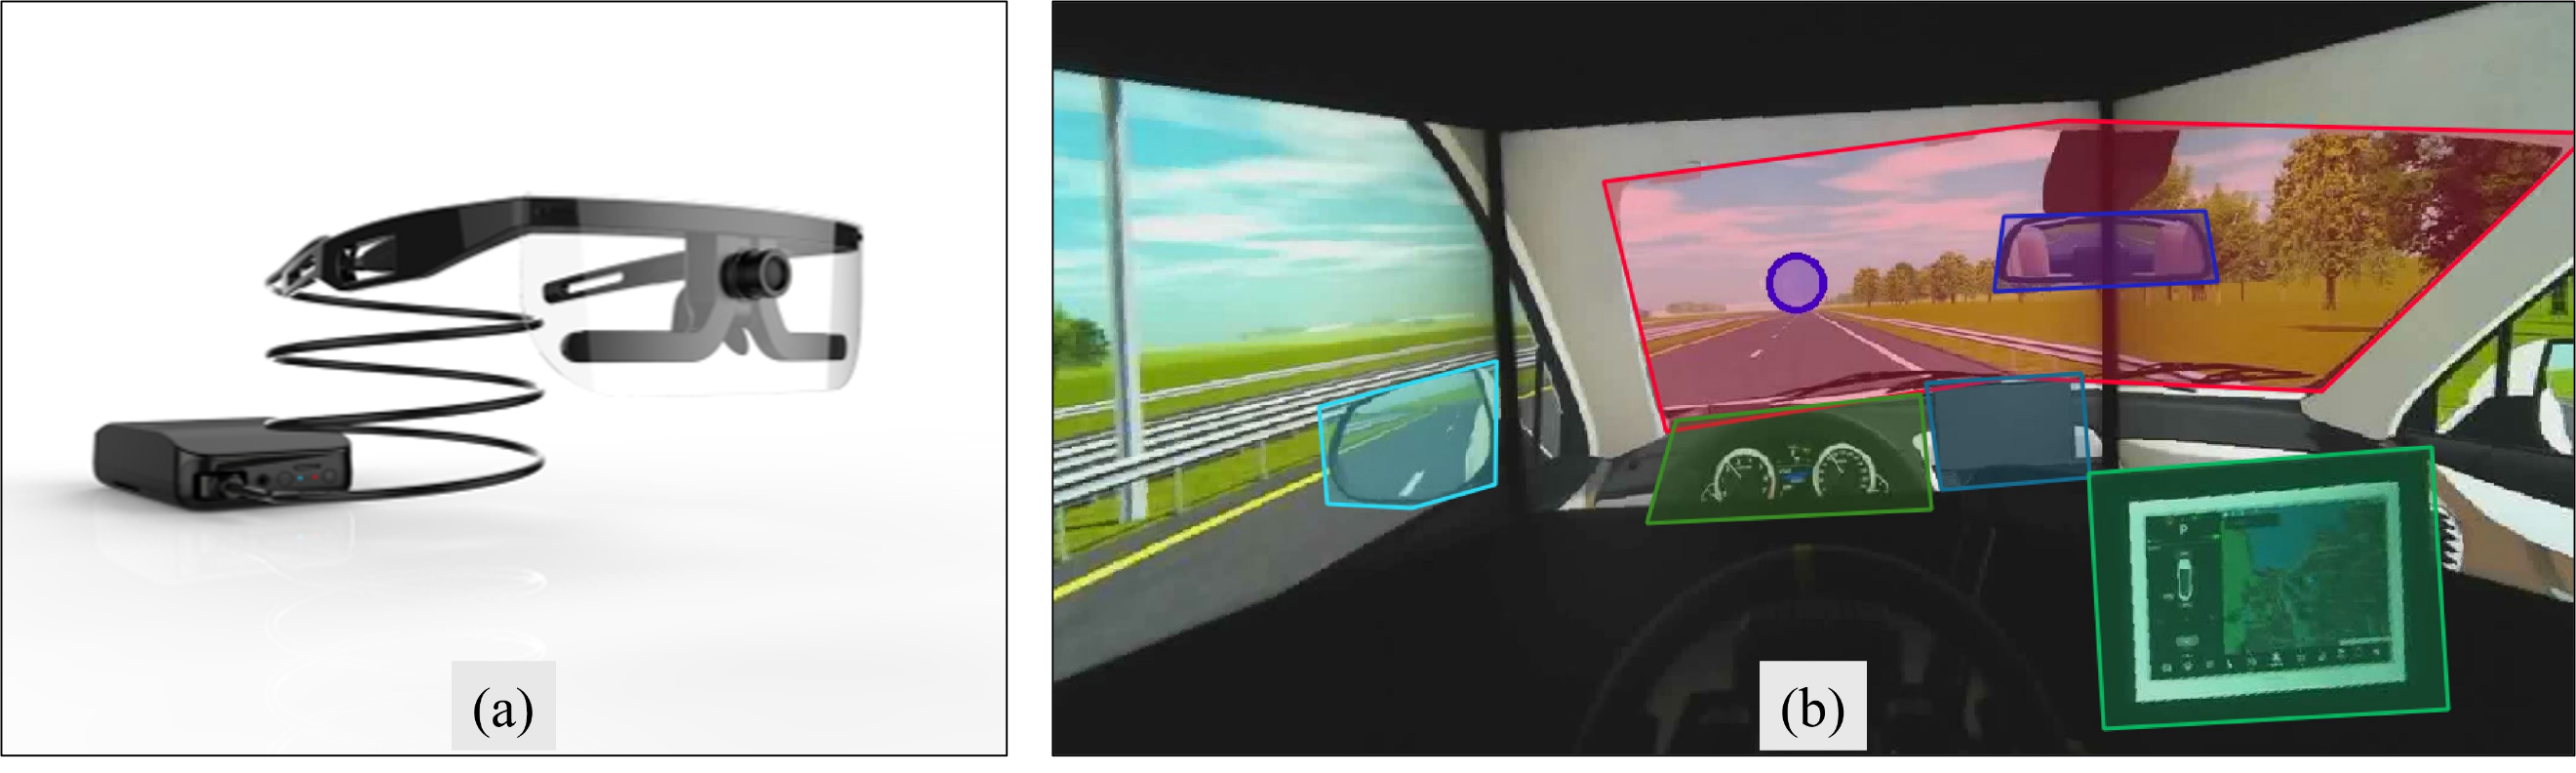
The eye movement data were recorded using Argus science wearable eye-tracker (Figure 3a), the ET-Vision software for data recording and the ET-Analysis software of the Argus Science was used to analyse the recorded gaze data. In this study, the eye movement data were analysed during all distraction events along road tangents (straight sections), i.e., use of in-vehicle touchscreen.
2.5.1 Defining Time of Interest (TOI)
TOI was defined to log each distraction event (when drivers performed secondary tasks, see Table 2). These logged events were aligned with driving scenarios, which began with the auditory beep and the display of text in the message area (refer to Figure 1) and concluded when the text disappeared, accompanied by another beep sound.
2.5.2 Specifying Area of Interest (AOI)
As shown in Figure 3b, the following AOIs were defined to analyse drivers' eye behaviour during distraction events: 1: Road ahead; 2: Touchscreen; 3: Message area; 4: Centre mirror; 5: Left mirror; 6: Speedometer. Each AOI was outlined around image features with distinct and well-defined edges. The analysis software included an artificial intelligence feature that can auto identify and track each AOI. In this case, the software is capable of maintaining the AOI boundaries aligned with the corresponding image features as the video progresses, even as the position and perspective of those features change with the change in driver head position.
2.5.3 Extraction of eye movement metrics
FC, TFD, and CPM were adopted as performance measures. FC refers to the total number of gaze points within the AOI during distraction events (i.e., when drivers were instructed to perform a secondary task using the touchscreen). TFD represents the total duration of fixations within the AOI and was used to assess total duration of drivers’ visual diversion from while interacting with the touchscreen. Furthermore, the CPM was computed to highlight the probability that a fixation in a given AOI would transition to a fixation in another AOI. Each value in the CPM was calculated by dividing the number of transitions between two AOIs by the total number of transitions from all AOIs.
2.6 Experimental protocol
Upon arrival at the lab, participants were introduced to the objectives and procedures of the study, along with a brief overview of the driving simulator and its key components. The process followed a structured protocol to ensure consistency and ease of participation throughout the experiment.
Initial Briefing:
-
participants were welcomed and provided with an explanation of the study's purpose, the experimental setup, and an overview of the simulator environment.
Familiarization Drive:
-
conducted on a practice circuit lasting at least five minutes.
-
designed to help participants become comfortable with the simulator and its controls.
-
participants were instructed to drive naturally, as they would in real-world conditions.
Preparation for the Experimental Drive:
-
a description of the simulated motorway alignment was provided.
-
participants were briefed on the sequence and nature of the secondary tasks they would encounter.
-
Only Group 2 (Trained group) received additional training on the use of the touchscreen interface immediately before beginning the experimental driving session.
Main Driving Session:
-
all participants completed the simulated motorway drive while performing secondary tasks at specific locations along the route.
-
at the end of experimental drive, participants completed a simulator sickness questionnaire to detect any symptoms of discomfort (Brooks et al., 2010; Kennedy et al., 1993). No cases of simulator sickness were reported.
In addition to the simulator sickness questionnaire and feedback on provided training, subjective workload assessments (NASA Task Load Index) and objective driving performance variables (i.e., speed and lateral lane position variation) were also collected during the experiment (Hazoor et al., 2026). However, the present article focuses on eye-tracking based measures of visual attention to maintain a clear scope aligned with the primary research question.
2.7 Data analysis
This study examined the effect of short pre-drive training on drivers’ gaze behaviour during interaction with an in-vehicle touchscreen interface. Visual attention metrics, including FC, TFD, and conditional gaze transition probabilities across predefined AOIs, were compared between two participant groups: trained and untrained drivers. All participants completed the same set of experimental tasks (Table 2).
The analysis was restricted to tangent (straight) road segments, while data collected during curved road sections (Tasks 3a and 3b) were excluded because the limited number of observations did not allow for a reliable comparison between straight and curved roadway conditions. Group differences in gaze behaviour metrics were evaluated using one-way analysis of variance (ANOVA). Statistical significance was assessed at a 95% confidence level (p < 0.05).
3. Results
3.1 Fixation count
Table 3 presents the FC for each AOI, comparing Group 1 (untrained participants) and Group 2 (trained participants) with respect to secondary tasks. Overall, both groups showed the highest FC on the touchscreen, except for the undistracted (UD) driving condition, followed by the road AOI during secondary tasks.
For the Road AOI, both groups exhibited similar patterns, without any significant difference among two groups during tasks involving touchscreen interaction. In the case of undistracted condition, number of fixations were higher for group 1 (UD: G1 = 42.18 vs. G2 = 37.37).
For the Touchscreen AOI, participants in both groups demonstrated substantial visual engagement during touchscreen-related tasks (e.g., Task 1a, 1b, and 1c). Group 1 recorded slightly higher FC values during these tasks (e.g., Task 1a: G1 = 33.71 vs. G2 = 30.94); however, these difference were not statistically significant (p > .05). Task 4 deviated from this pattern, with trained drivers (G2) recording higher FC (G1 = 25.93 vs. 29.42). Moreover, in the case of task repetition (Task 1a, 1b, and 1c), a reduction in FC were observed, particularly for Group 2.
FC on the Message Area AOI remained relatively low across all tasks, with comparable levels of attention observed in both groups. For the Centre Mirror and Left Mirror AOIs, FC were minimal across tasks for both groups, reflecting limited visual engagement with mirrors during secondary task performance. The highest mirror-related FC values were observed during the undistracted driving condition. Similarly, fixations on the Speedometer were low in both groups, with the highest counts occurring in the undistracted condition (G1 = 6.89; G2 = 7.33). During task-based conditions, Group 2 occasionally showed slightly more frequent fixations (e.g., Task 1a: G2 = 1.94 vs. G1 = 1.14). To evaluate whether the differences in visual attention between groups were statistically significant, one-way ANOVA tests were conducted for each AOI. The results showed no statistically significant differences between the trained and untrained groups across all AOIs (p > .05).
| Task 1a | Task 2 | UD | Task 1b | Task 4 | Task 1c | Task 5 | ||
|---|---|---|---|---|---|---|---|---|
| Road | G1 | 22.464 | 32.107 | 42.179 | 23.964 | 22.25 | 27.321 | 17.036 |
| G2 | 24.516 | 29.148 | 37.37 | 24.407 | 18.346 | 22.962 | 16.893 | |
| Touchscreen | G1 | 33.714 | 16.393 | 1.143 | 35.393 | 25.929 | 30.75 | 20.929 |
| G2 | 30.935 | 15.556 | 1.704 | 28.667 | 29.423 | 27.808 | 18.786 | |
| Message area | G1 | 5.071 | 9.786 | 0.679 | 3.964 | 9.357 | 4.893 | 4.821 |
| G2 | 4.935 | 9.148 | 0.111 | 4.852 | 11.5 | 3.962 | 6.821 | |
| Centre mirror | G1 | 0.522 | 1.217 | 2.00 | 0.304 | 0.348 | 0.522 | 0.478 |
| G2 | 0.387 | 0.778 | 2.37 | 0.444 | 0.385 | 0.731 | 0.393 | |
| Left mirror | G1 | 0.12 | 0.64 | 1.28 | 0.12 | 0.52 | 0.36 | 0.08 |
| G2 | 0.581 | 0.889 | 1.519 | 0.259 | 0.462 | 0.615 | 0.107 | |
| Speedometer | G1 | 1.143 | 4.214 | 6.893 | 0.75 | 0.929 | 2.00 | 0.607 |
| G2 | 1.935 | 4.889 | 7.333 | 0.963 | 0.654 | 1.731 | 1.214 |
3.2 Total Fixation Duration (TFD)
3.2.1 Distracted conditions
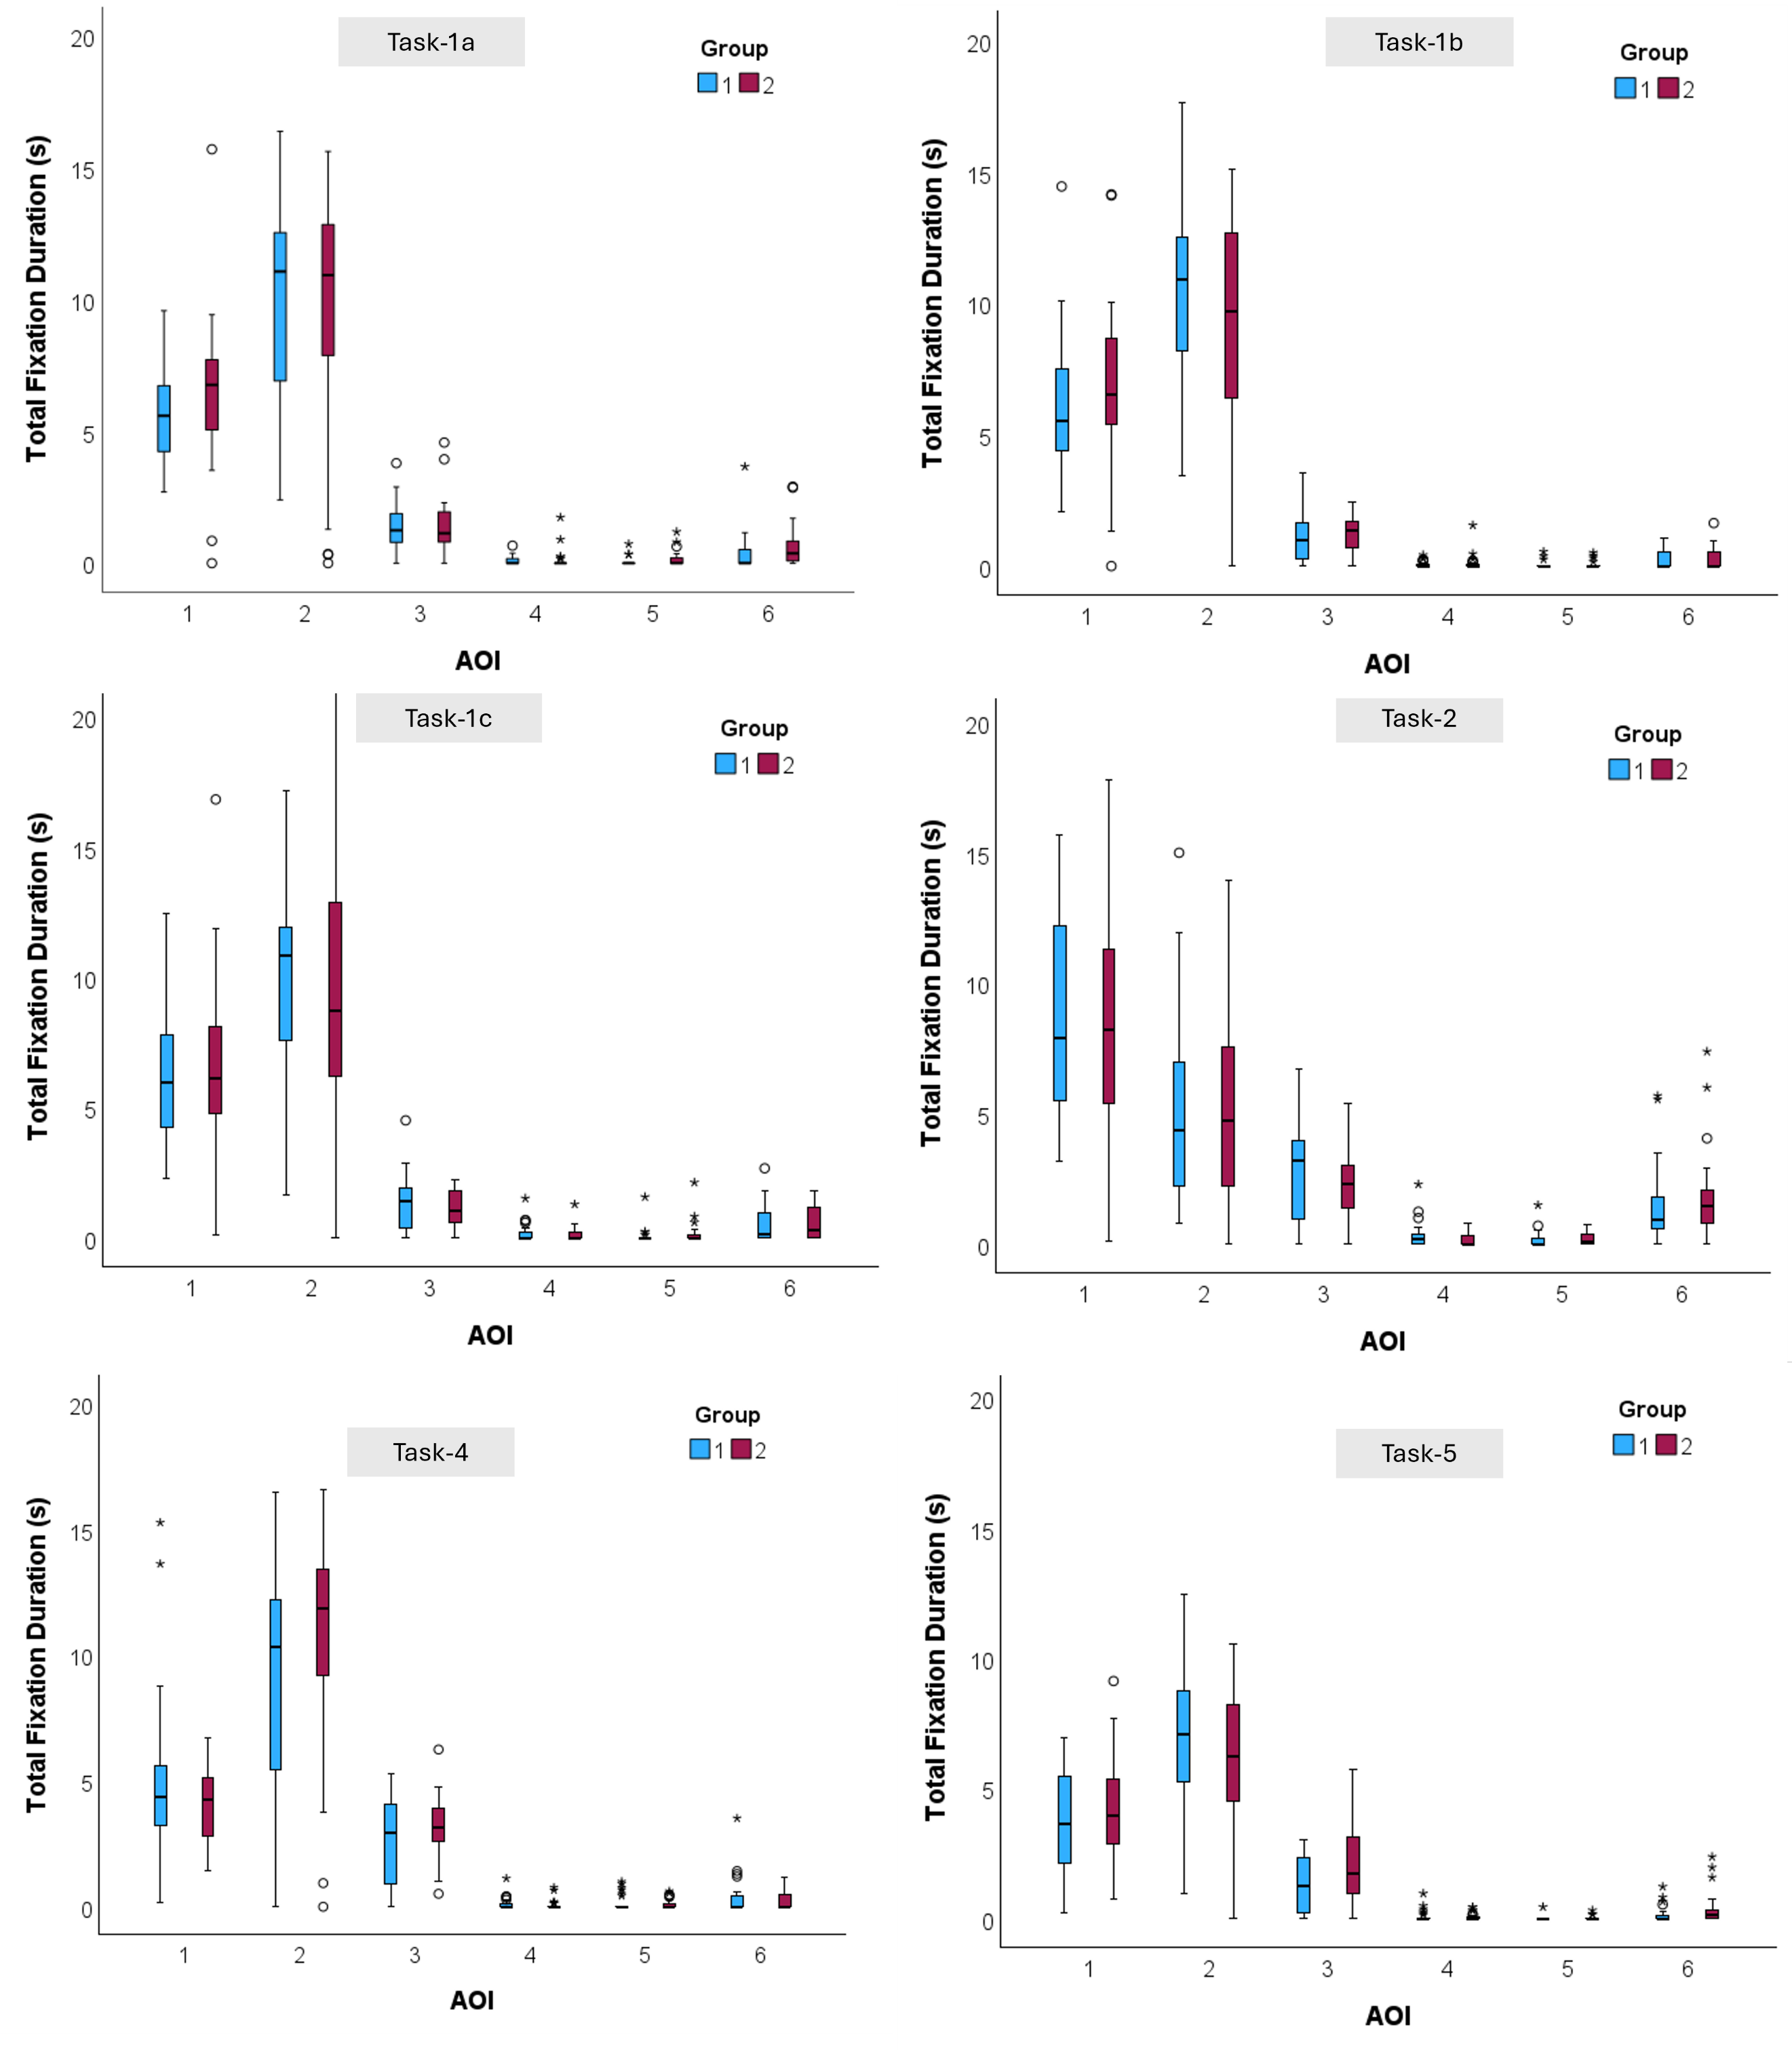
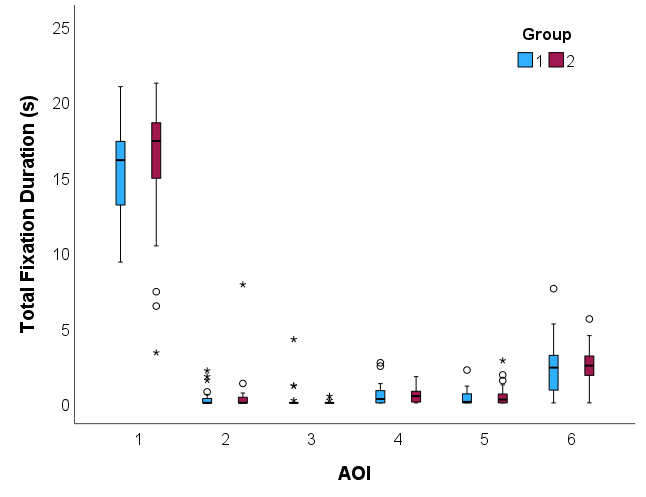
Figure 4 illustrates the TFD in seconds, distributed across six AOIs during six driving tasks. Each plot compares data from Group 1 (participants without pre-drive training) and Group 2 (participants who received a short training session). The AOIs examined were: (1) Road, (2) Touchscreen, (3) Message Area, (4) Centre Mirror, (5) Left Mirror, and (6) Speedometer.
Across all tasks, the highest TFD values were consistently observed on the Touchscreen followed by road AOI, except for Task 2. For the Road AOI, Group 1 often exhibited wider variability in TFD, while Group 2 showed more consistency in their visual engagement with the road scene. However, a one-way ANOVA revealed no significant difference in fixation duration on the Road AOI between the two groups among all tasks (p < .05).
For TFD on touchscreen while performing secondary tasks, both groups demonstrated prolonged fixations on the Touchscreen AOI, though Group 2 occasionally displayed slightly shorter TFD with narrower interquartile ranges, suggesting more focused or efficient visual interaction with the interface following training. These differences were not statistically significant when comparisons were carried out with one-way ANOVA for all tasks (p < .05).
The Message Area AOI received limited visual attention from both groups across most tasks. An exception was observed during Task 4, where TFD values increased noticeably. This increase likely reflects the higher visual demand due to the nature of the task. In this instance, participants were instructed to use the navigation system, which required reading a specific address displayed in the message area and manually entering it into the map interface via the touchscreen. In contrast, TFD on the Centre Mirror, Left Mirror, and Speedometer AOIs remained consistently low throughout all tasks, with no significant differences observed between the trained and untrained groups (p < .05). To evaluate whether the pre-drive training had a measurable effect on visual attention, one-way ANOVA tests were performed for each AOI across tasks. The analysis revealed no statistically significant differences between the groups in any of the AOIs (p > .05).
3.2.2 Undistracted condition
Figure 5 displays the distribution of TFD during the undistracted driving condition, in which participants were not engaged in any secondary task. As expected, fixation behaviour was dominated by attention to the Road AOI (1), which recorded the highest TFD across both groups. Median fixation durations exceeded 16 seconds for both groups, indicating sustained attention to the driving scene in the absence of distractions. Both groups showed similar distributions, with Group 1 presenting slightly more variability. TFD for AOIs 2 through 6 (Touchscreen, Message Area, Centre Mirror, Left Mirror, Speedometer) were all considerably lower, typically below 3 seconds and same behaviour was observed for both groups.
As with the distracted condition, one-way ANOVA tests revealed no statistically significant differences in TFD between trained and untrained groups for any of the AOIs (p > .05) in the undistracted condition.
3.3 Conditional probability
3.3.1 Repeated secondary task
Table 4 illustrates the CPM representing gaze transition behaviours between AOIs for Tasks 1a, 1b, and 1c, comparing participants from Group 1 (untrained) and Group 2 (trained). Each matrix entry in row n, column m indicates the conditional probability that a fixation in AOI n was followed by a fixation in AOI m. These probabilities reflect patterns in how participants distributed their visual attention while interacting with the in-vehicle touchscreen and driving environment.
In both groups, across all three tasks, the highest transition probabilities were observed between the Road and Touchscreen AOIs. For example, in Task 1a, the probability of transitioning from Road to Touchscreen was 0.35 for Group 1 and Group 2, while the reverse transition (Touchscreen to Road) was 0.46 for Group 1 and 0.45 for Group 2. These bidirectional transitions remained strong throughout Tasks 1b and 1c, confirming that participants frequently shifted visual attention between the driving scene and the touchscreen interface, regardless of training condition.
Group 1 (untrained participants) showed marginally higher self-transition probabilities within the Touchscreen AOI in each task: 0.71 (Task 1a), 0.72 (Task 1b), and 0.71 (Task 1c), compared to 0.66, 0.64, and 0.65 for Group 2, respectively. These higher self-transition values suggest that untrained participants maintained longer fixations within the touchscreen area, potentially reflecting more visual attention and engagement to complete the secondary task.
Transitions to other AOIs including Centre Mirror, Left Mirror, and Speedometer were consistently low for both groups, typically below 0.05, and showed slight difference across tasks. This indicates that participants primarily concentrated their visual attention on the touchscreen AOIs to complete the secondary task.
| Task 1a (Group 1) | Task 1a (Group 2) | ||||||||||||
|---|---|---|---|---|---|---|---|---|---|---|---|---|---|
| AOI | 1 | 2 | 3 | 4 | 5 | 6 | AOI | 1 | 2 | 3 | 4 | 5 | 6 |
| 1 | 0.46 | 0.35 | 0.09 | 0.02 | 0.00 | 0.03 | 1 | 0.45 | 0.35 | 0.09 | 0.01 | 0.01 | 0.03 |
| 2 | 0.25 | 0.71 | 0.00 | 0.00 | 0.00 | 0.00 | 2 | 0.27 | 0.66 | 0.01 | 0.00 | 0.00 | 0.00 |
| 3 | 0.27 | 0.15 | 0.43 | 0.00 | 0.00 | 0.00 | 3 | 0.41 | 0.12 | 0.36 | 0.00 | 0.00 | 0.01 |
| 4 | 0.31 | 0.03 | 0.00 | 0.03 | 0.00 | 0.00 | 4 | 0.16 | 0.00 | 0.00 | 0.00 | 0.00 | 0.00 |
| 5 | 0.05 | 0.04 | 0.00 | 0.00 | 0.02 | 0.00 | 5 | 0.20 | 0.05 | 0.00 | 0.00 | 0.05 | 0.00 |
| 6 | 0.17 | 0.08 | 0.09 | 0.00 | 0.00 | 0.12 | 6 | 0.37 | 0.09 | 0.11 | 0.00 | 0.00 | 0.17 |
| Task 1b (Group 1) | Task 1b (Group 2) | ||||||||||||
| AOI | 1 | 2 | 3 | 4 | 5 | 6 | AOI | 1 | 2 | 3 | 4 | 5 | 6 |
| 1 | 0.49 | 0.38 | 0.07 | 0.01 | 0.00 | 0.01 | 1 | 0.46 | 0.30 | 0.09 | 0.01 | 0.01 | 0.03 |
| 2 | 0.24 | 0.72 | 0.01 | 0.00 | 0.00 | 0.00 | 2 | 0.25 | 0.64 | 0.01 | 0.00 | 0.00 | 0.00 |
| 3 | 0.32 | 0.12 | 0.34 | 0.00 | 0.00 | 0.00 | 3 | 0.42 | 0.13 | 0.34 | 0.02 | 0.00 | 0.00 |
| 4 | 0.18 | 0.05 | 0.00 | 0.02 | 0.00 | 0.00 | 4 | 0.22 | 0.04 | 0.00 | 0.00 | 0.00 | 0.00 |
| 5 | 0.11 | 0.00 | 0.00 | 0.00 | 0.00 | 0.00 | 5 | 0.06 | 0.04 | 0.00 | 0.02 | 0.06 | 0.00 |
| 6 | 0.15 | 0.05 | 0.06 | 0.00 | 0.00 | 0.10 | 6 | 0.30 | 0.01 | 0.05 | 0.00 | 0.00 | 0.08 |
| Task 1c (Group 1) | Task 1c (Group 2) | ||||||||||||
| AOI | 1 | 2 | 3 | 4 | 5 | 6 | AOI | 1 | 2 | 3 | 4 | 5 | 6 |
| 1 | 0.49 | 0.33 | 0.08 | 0.03 | 0.01 | 0.03 | 1 | 0.45 | 0.33 | 0.07 | 0.03 | 0.02 | 0.04 |
| 2 | 0.24 | 0.71 | 0.01 | 0.00 | 0.00 | 0.01 | 2 | 0.26 | 0.65 | 0.01 | 0.00 | 0.00 | 0.00 |
| 3 | 0.32 | 0.13 | 0.32 | 0.00 | 0.00 | 0.00 | 3 | 0.45 | 0.08 | 0.34 | 0.00 | 0.00 | 0.01 |
| 4 | 0.27 | 0.04 | 0.02 | 0.00 | 0.00 | 0.00 | 4 | 0.36 | 0.04 | 0.06 | 0.01 | 0.00 | 0.00 |
| 5 | 0.10 | 0.02 | 0.00 | 0.00 | 0.02 | 0.00 | 5 | 0.11 | 0.04 | 0.04 | 0.00 | 0.05 | 0.00 |
| 6 | 0.18 | 0.07 | 0.04 | 0.00 | 0.00 | 0.22 | 6 | 0.27 | 0.03 | 0.05 | 0.00 | 0.00 | 0.16 |
3.3.2 Non-repeated secondary tasks
Table 5 illustrates the CPMs representing gaze transition behaviours between AOIs for non-repeated tasks (Tasks 2, 4, and 5) and the UD segment, comparing participants from Group 1 (untrained) and Group 2 (trained). Across all tasks and conditions, the highest transition probabilities were consistently observed within the Road (AOI 1), indicating sustained focus on the driving scene. For instance, in the undistracted condition, the self-transition probability for the Road AOI was 0.79 for Group 1 and 0.75 for Group 2. Even in tasks involving secondary interactions (e.g., Tasks 4 and 5), the Road AOI maintained dominant self-transition values (Task 5: 0.52 for Group 1 and 0.49 for Group 2), suggesting that participants prioritized the driving task even during occasional interface use.
| Task 2 (Group 1) | Task 2 (Group 2) | ||||||||||||
|---|---|---|---|---|---|---|---|---|---|---|---|---|---|
| AOI | 1 | 2 | 3 | 4 | 5 | 6 | AOI | 1 | 2 | 3 | 4 | 5 | 6 |
| 1 | 0.55 | 0.14 | 0.15 | 0.04 | 0.01 | 0.07 | 1 | 0.51 | 0.15 | 0.13 | 0.03 | 0.02 | 0.10 |
| 2 | 0.32 | 0.58 | 0.03 | 0.00 | 0.00 | 0.00 | 2 | 0.31 | 0.57 | 0.03 | 0.00 | 0.00 | 0.00 |
| 3 | 0.37 | 0.15 | 0.35 | 0.00 | 0.00 | 0.04 | 3 | 0.43 | 0.13 | 0.37 | 0.00 | 0.00 | 0.03 |
| 4 | 0.47 | 0.02 | 0.06 | 0.05 | 0.00 | 0.00 | 4 | 0.47 | 0.00 | 0.01 | 0.00 | 0.00 | 0.00 |
| 5 | 0.19 | 0.00 | 0.00 | 0.04 | 0.04 | 0.00 | 5 | 0.44 | 0.00 | 0.04 | 0.00 | 0.07 | 0.00 |
| 6 | 0.43 | 0.02 | 0.05 | 0.01 | 0.00 | 0.32 | 6 | 0.48 | 0.01 | 0.11 | 0.01 | 0.00 | 0.27 |
| UD (Group 1) | UD (Group 2) | ||||||||||||
| AOI | 1 | 2 | 3 | 4 | 5 | 6 | AOI | 1 | 2 | 3 | 4 | 5 | 6 |
| 1 | 0.79 | 0.01 | 0.01 | 0.04 | 0.02 | 0.09 | 1 | 0.75 | 0.02 | 0.00 | 0.05 | 0.02 | 0.12 |
| 2 | 0.18 | 0.14 | 0.01 | 0.00 | 0.00 | 0.00 | 2 | 0.19 | 0.23 | 0.00 | 0.00 | 0.00 | 0.00 |
| 3 | 0.10 | 0.00 | 0.03 | 0.01 | 0.00 | 0.00 | 3 | 0.04 | 0.00 | 0.00 | 0.00 | 0.00 | 0.00 |
| 4 | 0.54 | 0.04 | 0.00 | 0.06 | 0.00 | 0.00 | 4 | 0.61 | 0.00 | 0.00 | 0.09 | 0.00 | 0.01 |
| 5 | 0.30 | 0.00 | 0.00 | 0.00 | 0.14 | 0.02 | 5 | 0.25 | 0.00 | 0.00 | 0.01 | 0.19 | 0.00 |
| 6 | 0.47 | 0.01 | 0.00 | 0.00 | 0.01 | 0.33 | 6 | 0.59 | 0.02 | 0.00 | 0.00 | 0.00 | 0.34 |
| Task 4 (Group 1) | Task 4 (Group 2) | ||||||||||||
| AOI | 1 | 2 | 3 | 4 | 5 | 6 | AOI | 1 | 2 | 3 | 4 | 5 | 6 |
| 1 | 0.47 | 0.28 | 0.13 | 0.02 | 0.01 | 0.02 | 1 | 0.37 | 0.33 | 0.21 | 0.01 | 0.01 | 0.01 |
| 2 | 0.20 | 0.66 | 0.04 | 0.00 | 0.00 | 0.00 | 2 | 0.21 | 0.64 | 0.04 | 0.00 | 0.00 | 0.01 |
| 3 | 0.28 | 0.16 | 0.41 | 0.00 | 0.00 | 0.01 | 3 | 0.26 | 0.20 | 0.50 | 0.00 | 0.00 | 0.00 |
| 4 | 0.18 | 0.00 | 0.04 | 0.02 | 0.00 | 0.00 | 4 | 0.14 | 0.05 | 0.00 | 0.00 | 0.04 | 0.00 |
| 5 | 0.10 | 0.00 | 0.02 | 0.00 | 0.08 | 0.02 | 5 | 0.10 | 0.12 | 0.00 | 0.00 | 0.05 | 0.00 |
| 6 | 0.12 | 0.03 | 0.08 | 0.00 | 0.01 | 0.08 | 6 | 0.09 | 0.05 | 0.09 | 0.04 | 0.00 | 0.09 |
| Task 5 (Group 1) | Task 5 (Group 2) | ||||||||||||
| AOI | 1 | 2 | 3 | 4 | 5 | 6 | AOI | 1 | 2 | 3 | 4 | 5 | 6 |
| 1 | 0.52 | 0.28 | 0.12 | 0.02 | 0.00 | 0.03 | 1 | 0.49 | 0.26 | 0.14 | 0.02 | 0.01 | 0.04 |
| 2 | 0.21 | 0.76 | 0.00 | 0.00 | 0.00 | 0.00 | 2 | 0.22 | 0.66 | 0.01 | 0.00 | 0.00 | 0.00 |
| 3 | 0.24 | 0.09 | 0.41 | 0.00 | 0.00 | 0.00 | 3 | 0.25 | 0.12 | 0.54 | 0.00 | 0.00 | 0.00 |
| 4 | 0.18 | 0.00 | 0.02 | 0.02 | 0.00 | 0.00 | 4 | 0.18 | 0.02 | 0.00 | 0.02 | 0.00 | 0.00 |
| 5 | 0.04 | 0.00 | 0.00 | 0.00 | 0.00 | 0.00 | 5 | 0.04 | 0.07 | 0.00 | 0.00 | 0.00 | 0.00 |
| 6 | 0.14 | 0.01 | 0.05 | 0.00 | 0.00 | 0.08 | 6 | 0.24 | 0.07 | 0.10 | 0.00 | 0.00 | 0.12 |
Group 2 (trained participants) exhibited slightly higher transition probabilities from the Road to peripheral AOIs, such as the Speedometer and Centre Mirror, during undistracted condition (e.g., Road to Speedometer: 0.12 for Group 2 vs. 0.09 for Group 1). This may reflect more systematic scanning patterns and greater situational awareness. Touchscreen interactions (AOI 2) were marked by high self-transition probabilities in all task scenarios, especially for Tasks 4 and 5. In Task 5, the Touchscreen self-transition was 0.76 for Group 1 and 0.66 for Group 2, suggesting longer fixation sequences and possibly less efficient interaction for the untrained group. This observation is consistent with earlier tasks and indicates that trained participants may have developed slightly more efficient visual routines while using the interface.
Transitions to other AOIs, such as the Message Area, Centre Mirror, Left Mirror, and Speedometer (AOIs 3–6), were generally infrequent and typically below 0.10. An exception was observed during Task 4, where interaction with the navigation system likely led to increased transitions involving the Message Area, with Group 2 showing slightly stronger transitions from Road and Touchscreen to AOI 3. As in Task 4, participants were instructed to use the navigation system, which required reading a specific address displayed in the message area and entering it into the map.
4. Discussions
This study aimed to evaluate the effects of a short pre-drive training session on drivers’ visual attention and interaction patterns with in-vehicle touchscreens using eye-tracking data in a driving simulator. Eye-tracking metrics, including FC, TFD, and gaze transition probabilities, were analysed to assess visual attention allocation during secondary touchscreen tasks. Statistical comparisons between trained and untrained groups were conducted to examine the impact of pre-drive training on visual behaviour. The results provide insight into how such training may influence drivers’ visual attention and its potential safety implications.
Participants in both trained and untrained groups demonstrated the highest FC and durations on the touchscreen area during secondary tasks. This finding supports previous work showing that touchscreens demand substantial visual attention, often diverting gaze from the road, thus increasing the risk of accidents (Harbluk et al., 2007; Victor et al., 2005). Although the differences were not statistically significant, trained participants showed slightly reduced FC and TFD on the touchscreen, suggesting more efficient and potentially safer interactions. This observation aligns with previous studies that suggest familiarization with IVIS interfaces either through training or frequent use can improve interaction efficiency (Harvey et al., 2011). However, Task 4 (navigation), deviated from this overall pattern, with trained drivers exhibiting higher FC on the touchscreen than untrained drivers. This finding suggests that certain tasks, particularly those involving greater complexity or less familiar interface functions, may continue to require additional visual attention even after familiarization. It is important to mention that the results based on FCs were not statistically significant, and should therefore be interpreted with caution.
Higher TFD on the road AOI during undistracted conditions confirms the expected allocation of visual resources to the primary driving task when distraction is absent. However, TFD values for the Speedometer, Centre Mirror, and Left Mirror were higher under the undistracted condition in comparison with the distracted segments. This suggests that drivers may have increased their glances toward these AOIs to maintain greater situational awareness and control over the vehicle and its surroundings. Interestingly, during non-distracted (baseline) conditions, untrained drivers exhibited higher fixation counts on the road compared to their trained counterparts. This may indicate a compensatory strategy by untrained drivers to maintain road awareness when not engaged in secondary tasks or possibly reflect increased uncertainty when anticipating complex touchscreen use (Wickens et al., 2022).
Fixation duration results further reinforce these observations. Across all tasks, both groups exhibited the longest fixation durations on the touchscreen AOI, followed by the road, highlighting the visual demand touchscreen interaction requires. In contrast, AOIs such as mirrors and speedometer consistently attracted low fixation durations across all participants, suggesting these areas were deprioritized during secondary task engagement, potentially increasing safety risk if key driving information is missed.
Gaze transition analysis revealed that both groups frequently shifted attention between the road and touchscreen. However, untrained drivers had higher self-transition probabilities within the touchscreen AOI, implying longer and potentially more cognitively demanding engagements. This behaviour is consistent with the findings of Reyes and Lee (2008), who reported that participants under higher mental workload exhibit more extended and frequent glances. The conditional probability patterns suggest that training did not fundamentally alter the visual scanning strategy (as participants in both groups focused mainly on Road and Touchscreen) but may have led to more stable fixation behaviour within the task-relevant areas for the trained group. Overall, the CPM patterns reveal that while training did not significantly change the dominant scanning strategy (which remained focused on the Road and Touchscreen AOIs), trained participants tended to demonstrate slightly more varied gaze transitions, particularly toward other AOIs like the Speedometer and mirrors. This pattern suggests a potential enhancement in task efficiency and situational awareness following training.
Importantly, findings from earlier analyses of the same experimental study provide valuable context for interpreting these results. Subjective workload assessments using the NASA-TLX showed that trained drivers reported significantly higher temporal demand and effort compared to untrained drivers during secondary task performance. Rather than indicating increased task difficulty, this likely reflects heightened awareness of task demands and performance expectations following training (Hazoor et al., 2026). This heightened performance awareness may help explain why, in the present study, trained drivers exhibited higher fixation counts during the navigation task, suggesting that more complex or less familiar functions can still impose elevated visual and cognitive demands even after training (Hancock, 1989).
Previous analyses from the same study indicated that short pre-drive training had limited impact on lane-keeping and speed variability, consistent with the minimal differences observed in eye-tracking metrics. However, trained participants exhibited a higher secondary task completion rate, suggesting that training may enhance operational efficiency during touchscreen interactions (Hazoor et al., 2026). This implies that even if overall driving stability remains largely unchanged, more efficient and accurate task performance could reduce cognitive load and potential distraction. In this regard, measures such as navigation accuracy or task completion time provide complementary insight into how pre-drive training might improve multitasking without compromising safety (Strayer & Drews, 2007).
In contrast to objective findings discussed previously, subjective feedback on the short pre-drive training suggests that the training was both satisfactory and effective. Participants who received the training responded to two statements: (i) “I am satisfied with the training on the use of the touchscreen interface before driving,” and (ii) “The training helped me to complete the tasks on the touchscreen.” The average score of 9.6 out of 10 for the first statement indicates a high level of perceived satisfaction, while the average score of 8.9 out of 10 for the second statement suggests that the training effectively supported task completion. For untrained drivers, the following statement was presented at the end of the experimental session: “Receiving training on the use of the touchscreen interface would help me to complete the tasks on the touchscreen.” The average rating of 8.3 out of 10 suggests that participants who did not receive any pre-drive training perceived that their performance would improve if such training were provided.
Although the observed differences were modest, the findings suggest that even a short pre-drive training session can reduce visual distraction during touchscreen interaction. However, it is important to acknowledge that the effect size of training was limited, and statistical significance was not achieved. From a practical perspective, short pre-drive training could be integrated into multiple real-world contexts. For example, it could be offered: (i) prior to car-sharing or rental vehicle use, enabling drivers quickly familiarize themselves with unfamiliar interfaces and (ii) when purchasing a new vehicle, as part of dealer-provided “onboarding” sessions.
4.1 Limitations and future recommendations
One of the limitations of this study is that it was conducted in a controlled environment, without significant interaction with surrounding vehicles. Although this setup improved internal validity by reducing visual demand, it limits the realism of the driving conditions compared to real-world setting. As a result, the findings mainly reflect driver behaviour in low-demand traffic scenarios. Future studies should examine the effects of training in environments with multiple vehicles, intersections, varied road geometry conditions and other events to better understand how short training on the use of touchscreen influence driver visual behaviour. Moreover, the broad range of participant ages and driving experience may have introduced variability in visual behaviour. While group matching was applied to balance participant characteristics across, individual differences related to age and driving experience may still have influenced the results. Future research with more narrowly defined samples would allow for a more detailed examination of how these factors interact with touchscreen distraction and short pre-drive training effects. On the other hand, the pre-drive training consisted of an observational demonstration rather than interactive hands-on practice. While this approach ensured standardized exposure across participants, it may have limited the extent to which procedural familiarity and motor learning could develop compared to active training methods. Future studies should examine interactive training protocols that allow drivers to practice touchscreen tasks prior to driving to better assess how different training modalities influence distraction and performance as well as participants opinion about the provided training.
The lack of statistically significant differences in eye-tracking measures parallels the earlier findings based on driving-performance metrics suggesting that short pre-drive training may have limited impact on both behavioural and visual domains (Hazoor et al., 2026). However, the complementary nature of these datasets highlights an opportunity for integrated analysis. Combining driving-performance indicators (e.g., speed and lane position variability) with visual attention metrics could provide a deeper understanding of how short pre-drive training influences multitasking behaviour. Future research should consider integrating eye-tracking and driving-performance data to examine the interplay between visual distraction and vehicle control. This multimodal approach could reveal whether changes in gaze behaviour correspond to measurable differences in driving stability, thereby offering a more comprehensive understanding of training effects.
Although baseline (non-distracted) driving was included in the analysis, the primary objective of this study was to compare trained and untrained drivers during secondary task engagement; baseline analysis therefore served as a complementary reference. Data for baseline driving was acquired within the same drive session may have influenced visual behaviour even without secondary tasks. While this does not affect the main between-group comparisons during distracted driving, future studies could include a separate baseline driving to better isolate training effects under undistracted conditions.
Finally, future research should consider collecting additional participant-level information, such as familiarity with touchscreen interface, the frequency of car-sharing and usage of in-vehicle touchscreens. These factors could influence drivers’ familiarity with interface systems and their visual attention patterns, providing deeper insight into the effectiveness of short pre-drive training and individual differences in distraction risk.
5. Conclusions
This study investigated the potential of a short pre-drive training session to reduce visual distraction associated with in-vehicle touchscreen use. Using a driving simulator and eye-tracking data, the findings highlighted that touchscreen interactions demand considerable visual attention, often at the expense of road monitoring. While both trained and untrained participants demonstrated similar gaze patterns, trained drivers exhibited slightly more efficient interaction behaviours, evidenced by marginally lower fixation counts and durations on the touchscreen, as well as a reduced self-transition probability within the touchscreen AOI, suggesting a positive but limited impact of short pre-drive training.
Despite the lack of statistically significant differences, the observed trends imply that even minimal exposure to touchscreen interfaces prior to driving may improve drivers' ability to manage secondary tasks more safely. This is particularly relevant in contexts like car sharing, where unfamiliar IVIS interfaces may increase visual distraction. However, the effectiveness of such training likely depends on its design and delivery. Future research should investigate alternative or more interactive training approaches and validate these findings in real-world settings with diverse driver populations and driving conditions.
As vehicle interfaces continue to evolve and expand in functionality, understanding how to prepare drivers for safe interaction becomes increasingly urgent. While short training may not be a definitive solution, it holds promise as a scalable, low-cost intervention that could contribute to reducing distraction-related incidents. Continued exploration in this area is essential for driver education strategies in an era of increasingly digital vehicle environments.
CRediT contribution
Abrar Hazoor: Conceptualization, Methodology, Writing – original draft. Giuseppe Marinelli: Conceptualization, Methodology, Writing – original draft, Writing – review & editing.
Acknowledgements
We thank to all the students for their efforts to the data collection: Simen Aannerud Gulbrandsen; Mathea Lindseth Eriksen; Mats Hay; Chris Fredriksen; and Kjell Kåre Hoem.
Declaration of competing interests
The authors report no competing interests.
Declaration of generative AI use
The authors declare that no generative AI was used in this work.
Prior dissemination declaration
An earlier version of this paper was presented at the 36th ICTCT conference, held in the Hague, the Netherlands, on 17–18 October 2024.
Ethics statement
The methods for data collection in the present study have been approved by the Norwegian Agency for shared services for education and research (SIKT) (reference number: 951733).
Funding statement
No external funding was used in this research.
Data availability statement
The data are available on request to the authors.
Editorial information
Handling editor: Haneen Farah, Delft University of Technology, the Netherlands.
Reviewers: Ariane Cuenen, Hasselt University, Belgium; Arichandran R., National Institute of Technology Karnataka, India.
Submitted: 30 June 2025; Accepted: 13 May 2026; Published: 22 May 2026.