The effect on cyclist safety of daytime running lights
Abstract
On average, Danes cycle 1.3 kilometres per person per day. However, according to emergency department statistics, each year more than 16,000 cyclists are injured in Denmark. In an effort to improve cyclist safety we tested the effect of daytime running lights (DRL) on the number of cyclist accidents. Using a randomised controlled trial design, 5,380 voluntary cyclist participants were randomly assigned to a test group (using DRL continuously for one year) or a control group (using their usual light routine for one year). Participants were provided with accident surveys once each month. A total of 230 accidents were reported: 121 in the test group and 109 in the control group. Most accidents were multi-party accidents (MPAs), took place in winter and in daylight. Safety effect of DRL was estimated as incidence rate ratio (IRR) between the test and control group. The incidence rate is the number of accidents per person-month. Reports of single-bicycle accidents (SBAs) in daylight were used to correct for potential report bias following Madsen et al. (2013). For multiparty personal injury accidents (PIAs), the corrected overall effect of DRL was a 25% risk reduction. The effect was insignificant. For all multiparty accidents, the corrected overall effect of DRL was an insignificant 30% risk reduction. For multiparty accidents in the dark, the effect of DRL was a significant 71% risk reduction. This is surprising, since it would be fair to assume that DRL primarily would affects accidents in daylight, where cyclists typically do not have lights on. The finding is likely due to participants in the test group having much better lighting at night than participants in the control group—or simply because some cyclists in the control group non-compliantly with the Road Traffic Act did not use lights at night during the experiment.
1. Introduction
Denmark is known as a bicycle friendly country. In 2023, 68% of the Danish population over the age of 6 owns a bicycle (Danish Centre for Cycling Knowledge 2025), and on average, Danes cycle 1.3 kilometres per person per day (Christiansen and Anderson 2024). However, every year, cyclists are injured in traffic. In 2022, 810 cyclists were injured according to official accident statistics based on police reports (Statistics Denmark 2025). According to emergency department statistics (National Patient Register, NPR), however, the number of injured cyclists the same year amounted to more than 16,000 (Statistics Denmark 2025). Police data reflect the fact that the police rarely get informed about and/or respond to cyclist accidents.
The degree of underreporting is well documented, and a self-reporting survey concluded as many as 36,000 cyclists getting injured in Denmark annually (Olesen et al. 2022). This amounts to 60% more than the number of road users injured in cars. This number is staggering, even more so since cyclists (and mopeds) together account for only 4% of total mileage, whereas personal cars account for 78% (Statistics Denmark 2025).
Due to the degree of underreporting cyclist safety issues may be underestimated in road safety efforts, and there is every reason to make an effort to improve cyclist safety.
In a literature review, Macioszek and Graná (2022) summarized cyclist accident characteristics. They found that the majority of the literature focused on injuries, potential counteractors, and preventive measures (such as the use of bicycle helmets), as well as the characteristics of cyclists and drivers and weather conditions, time of day and the location of the accident. Macioszek and Graná found that 86% of cyclist accidents occurred in daylight, 6% occurred at night on illuminated paths/roads, and 2% occurred at night on unlit roads. Niska and Eriksson (2013) found that 20% of single-bicycle crashes and 13% of cyclists’ collisions with another cyclist occurred during darkness.
Høye et al. (2020) found that the use of cyclist light was negatively, though insignificantly, correlated to cyclist collision involvement, both in daylight and in darkness. Høye and Hesjevoll (2016) estimated a potential annual reduction of cyclist injuries in Norway by use of daytime running light by about 10% annually, i.e. 14% reduction in darkness and 9% in daylight. If all cyclists used both running light and high-visibility clothing, the potential reduction in cyclist injuries in Norway was estimated as high as 32%.
In Denmark, daytime running lights were associated with an estimated 47% lower multiparty personal injury accident rate (Madsen et al. 2013), and cycle jacket wearing was associated with an estimated 47% lower multiparty personal injury accident (Lahrmann et al. 2018).
The purpose of this study is to re-test the effect of daytime running lights with a randomised controlled trial design (RCT) similar to the one described in Madsen et al. (2013). This time, however, with a new and more powerful running light. We hypothesize that the use of daytime running lights will make cyclists more visible, and that this increased visibility leads to a reduction in the number of multiparty accidents.
In this paper, we used a cyclist-oriented definition of an accident. The definition is presented in 3.2.
2. Method
5,380 voluntary participants were randomly assigned to a test group or a control group. In the test group, participants were to install the lights and cycle with the daytime running lights continuously for one year. In the control group, the participants were to cycle using their usual light routine (note that they were not supposed to cycle without lights but with their usual lighting regime) for one year.
The number of self-reported accidents in the two groups was evaluated and used as a measure of the effect of daytime running lights.
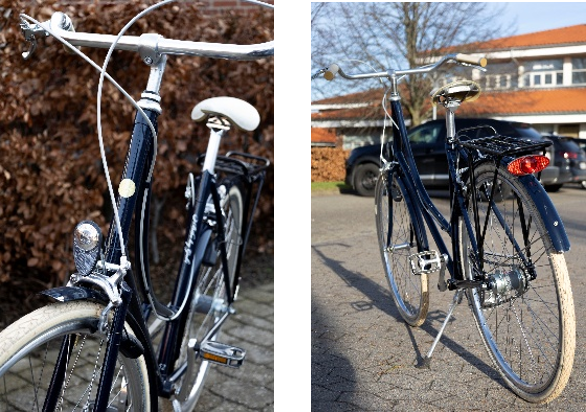
Lights were provided by the company Reelight (www.reelight.com). The NOVA front lights emit 425 cd at 18 km/h, and the NOVA rear lights emit 9.5 cd at 18 km/h, with the major difference being in the lenses. The front light is highly focused, while the rear light has a wider spread to provide better side visibility (Figure 1). NOVA is mounted on the head tube of the bicycle. NOVA is a battery free bike light. The lights are powered by a contactless rim dynamo, which works by eddy currents created on the aluminum rim by a magnetic field induced by a magnet on the frame. This creates a magnetic field, which can be utilised to power a bike light. The lights require no magnets mounted on the wheel.
The lights tested in Madsen et al. (2013) were also based upon the electro-dynamic induction principle but required two magnets fixed to the spokes of both wheels. The lights would flash when the magnets passed the light; consequently, they would not flash when the bike was not moving, e.g. at intersections. Moreover, the lights were placed at low positions connected to the front hub, up to 0.4 metres above ground, on the left side of the bicycle. Factors that together may have reduced the visibility of the lights.
Sign-ups (N = 6,051) were recruited in one month (September/October 2020) through the project's website. To raise awareness of the project, posts were shared in various Facebook group, news outlets, a press release and on DR, Danish Broadcasting Corporation. Potential participants were told that they would test the efficiency of daytime running lights in reducing the number of bicycle accidents, the design of the experiment (test and control group) plus the fact that they would receive monthly questionnaires for one year. Potential test participants were recommended to use the bicycle equipped with a light for the entire experiment.
During registration, participants were prompted for demographic data, as well as details about their current use of bicycle lights, and cycling exposure. Eventually, participants were randomly assigned to either test or control group.
Among the 6,051 respondents, 671 did not meet the inclusion criteria and were screened out (Figure 2) because they:
-
did not cycle at least 3 times per week during the summer months (N = 75)
-
were younger than 16 years of age (N = 65)
-
did their cycling on mountain bikes, e-bikes, or with hub dynamos (N = 183, N = 226, and N = 122, respectively).
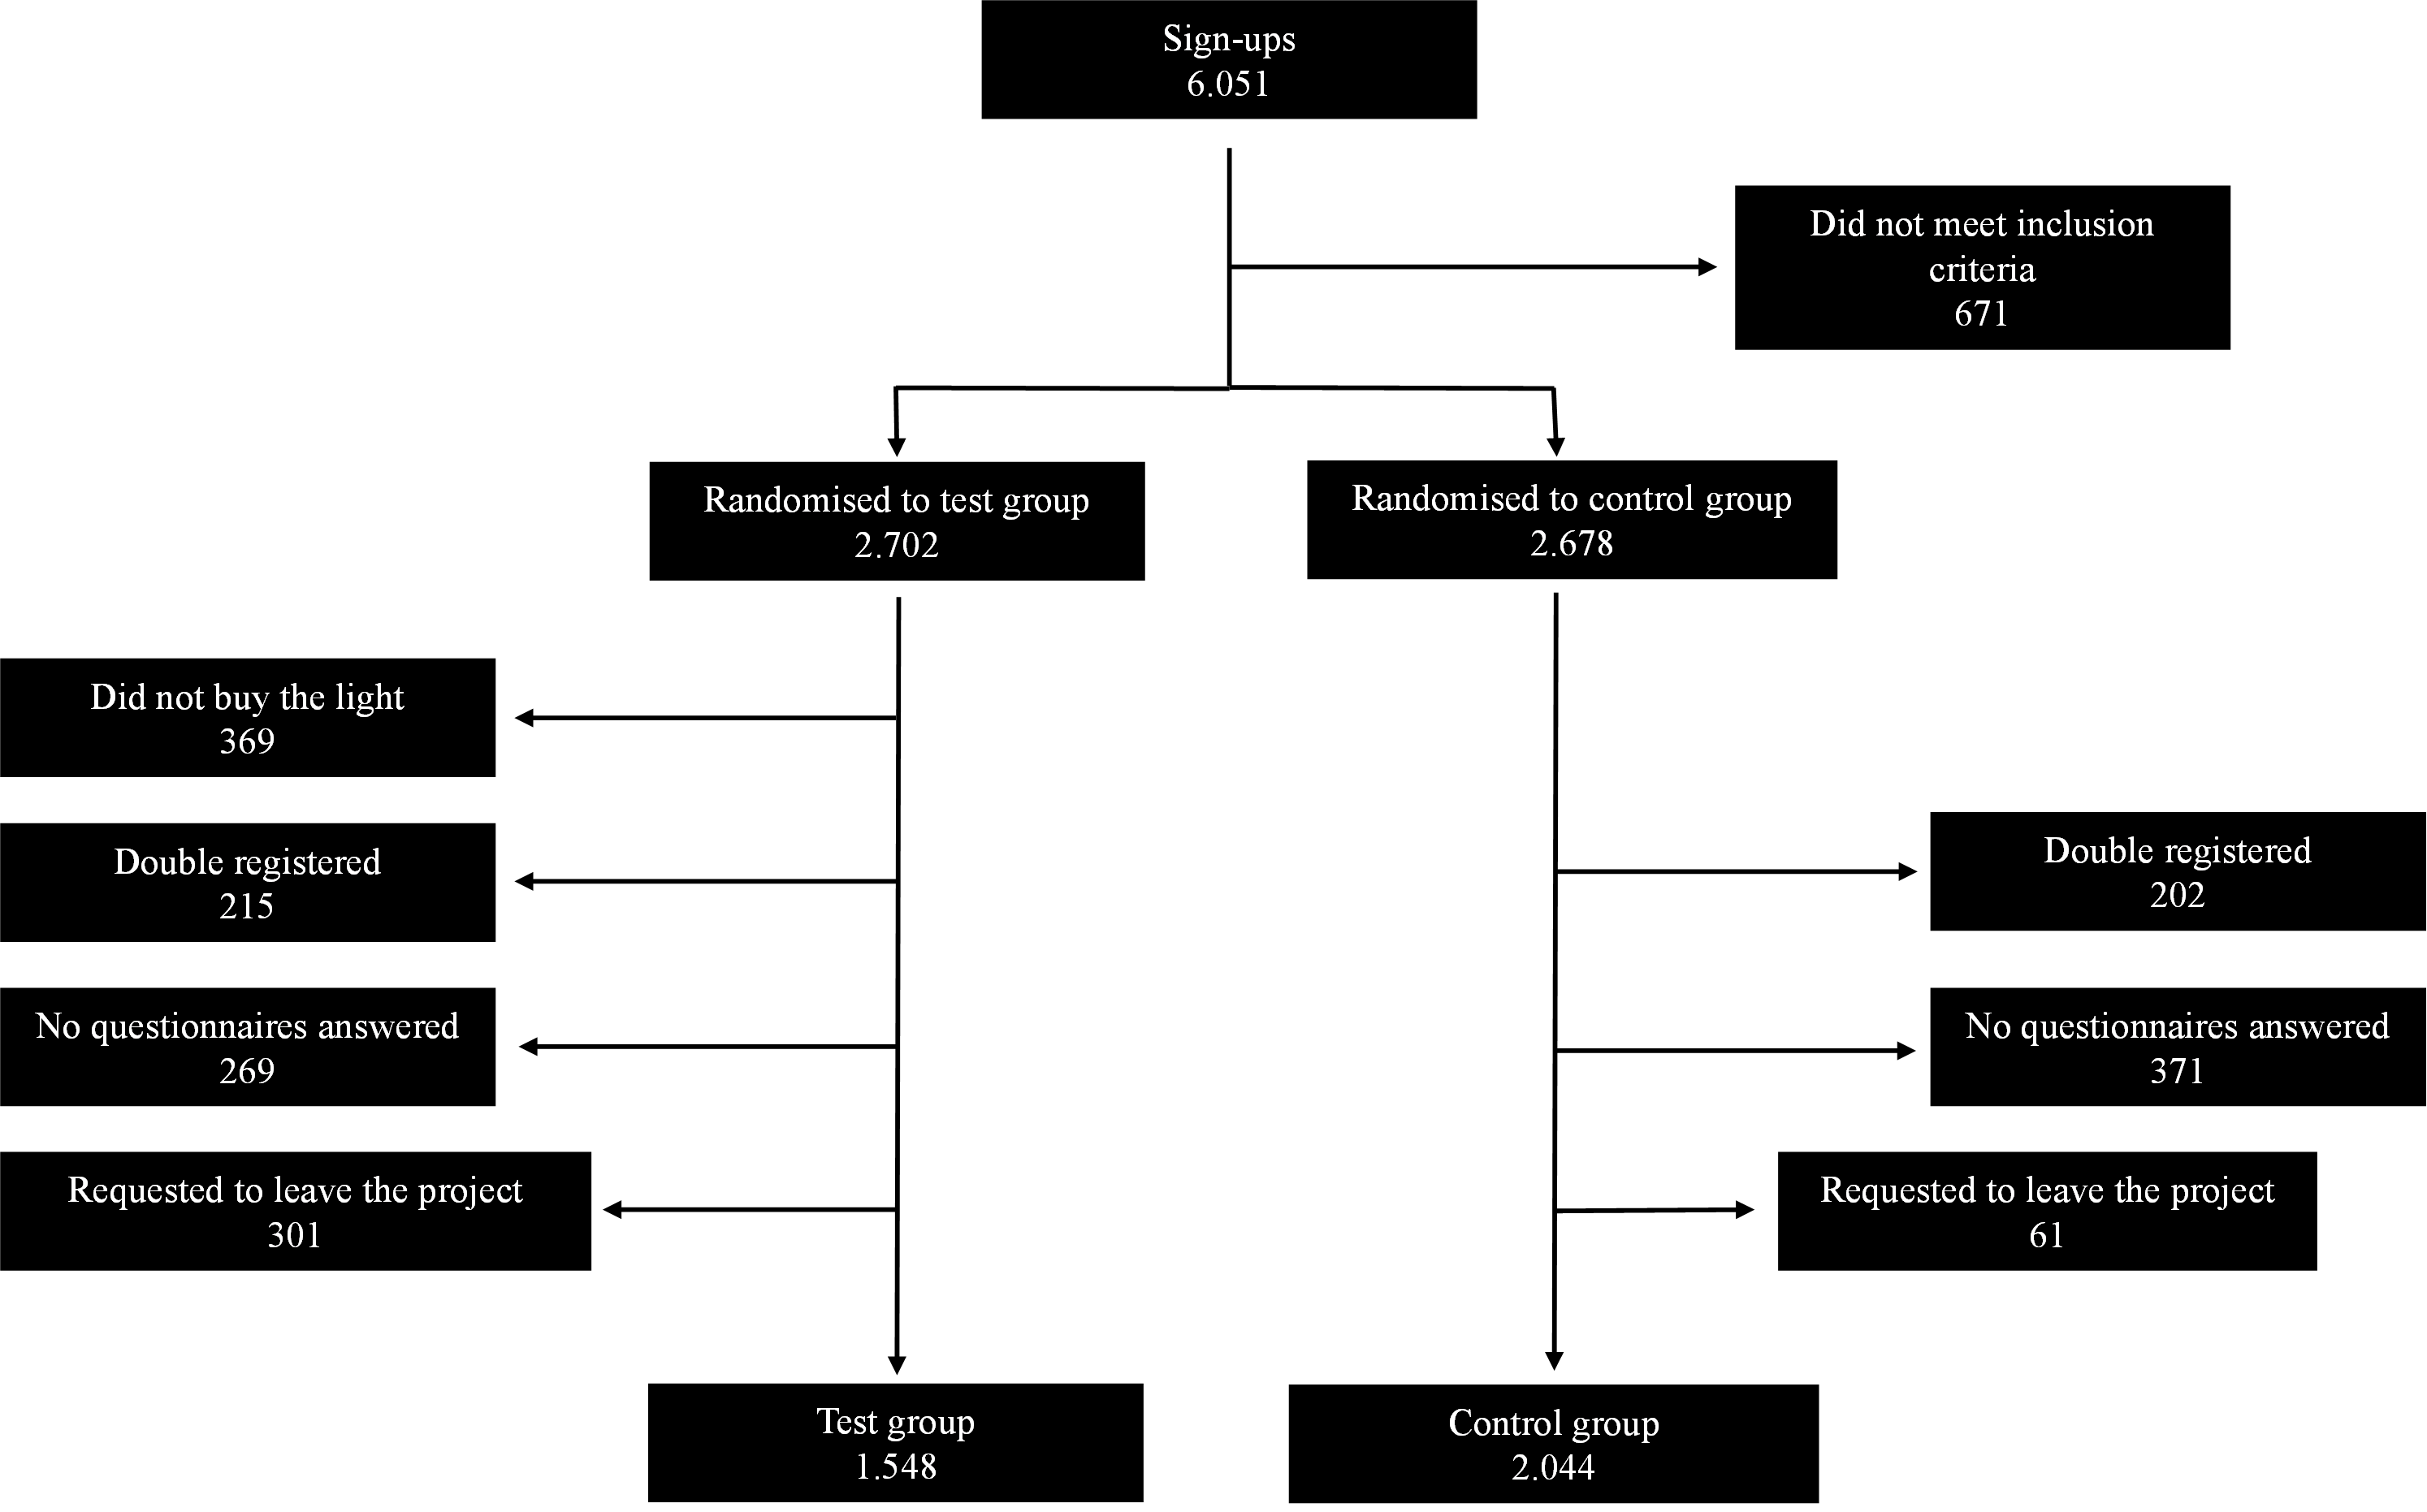
This resulted in 5,380 cyclists participating, with 2,702 in the test group and 2,678 in the control group. Participants in the test group were required to pay a deposit of 100 DKK (13.5 EUR). After the experiment, they would either get the money refunded or own the light (market price: 80 EUR); participants in the control group could buy the light for 100 DKK after the experiment. In the test group, 369 participants did not buy the light. 417 respondents had registered multiple times (test: 215, control: 202). 640 participants (test: 269, control: 371) did not respond to any surveys and 362 (test: 301, control: 61) requested to be withdrawn. Finally, there were 1,548 participants in the test group and 2,044 in the control group. They reported for at least one month whether they had experienced a cycling accident.
Some of the participants may have been influenced by the desire to purchase bicycle lights at a discounted price.
Communication with the participants took place via the project's website and via a hotline, which could be contacted both by phone and by email. During the project period, the hotline received over 2,000 inquiries—primarily through email; most inquiries related to registration and distribution of bicycle lights.
Each month (13 times in total), all participants were prompted through an email with a link to an online SurveyXact survey for potential cyclist accident data the previous month. Data requested included accident location, time, counterpart, lighting conditions, weather and road surface, personal injuries, the use of bike lights, helmets, and brightly coloured clothing, the participant’s and counterpart’s behaviour. On no response, a reminder was sent after one week. If a participant still did not respond, they were excluded from the survey for that month. Only participants who actively opted out of the study were excluded from all subsequent mailings.
3. Results
3.1 Test and control group characteristics
Participants were provided with surveys once each month for a year, i.e. the study period (November 2020 to November 2021), 13 surveys in total. 36,503 surveys were completed: 15,836 in the test group and 20,667 in the control group (Table 1–Table 3). Despite the disproportionate cancellation of respondents in the test group and the control group, there was no significant difference in any of the variables listed in Table 3. We therefore reason that randomisation was successful.
| Test group | Percentage of group (%) | Control group | Percentage of group (%) | |
|---|---|---|---|---|
| Respondents that completed > 0 surveys | 1 548 | 100 | 2 044 | 100 |
| Responders to 1 to 12 surveys | 865 | 55.9 | 1 156 | 56.6 |
| Responders to all (13) surveys | 683 | 44.1 | 888 | 43.4 |
| Total number of completed surveys | 15 836 | 20 667 |
| Accident recording months | Test group | Control group | ||
|---|---|---|---|---|
| Respondents | Percentage of group (%) | Respondents | Percentage of group (%) | |
| 0 | 269 | 14.8 | 371 | 15.3 |
| 1 | 102 | 5.6 | 143 | 5.9 |
| 2 | 49 | 2.7 | 79 | 3.3 |
| 3 | 29 | 1.6 | 50 | 2.1 |
| 4 | 37 | 2.0 | 41 | 1.7 |
| 5 | 38 | 2.1 | 40 | 1.7 |
| 6 | 35 | 1.9 | 41 | 1.7 |
| 7 | 35 | 1.9 | 51 | 2.1 |
| 8 | 47 | 2.6 | 62 | 3.6 |
| 9 | 49 | 2.7 | 75 | 2.1 |
| 10 | 76 | 4.2 | 100 | 4.1 |
| 11 | 116 | 6.4 | 151 | 6.2 |
| 12 | 252 | 13.9 | 323 | 13.4 |
| 13 | 683 | 37.6 | 888 | 36.8 |
| Total | 1 817 | 100.0 | 2 415 | 100.0 |
| Characteristics | Test group | Control group | ||
|---|---|---|---|---|
| Respondents | Percentage of group, % | Respondents | Percentage of group, % | |
| Gender | ||||
| Women | 866 | 56.0 | 1 189 | 58.2 |
| Men | 679 | 43.9 | 852 | 41.7 |
| Do not wish to answer | 2 | 0.1 | 3 | 3 |
| Missing | 1 | 1 | 0 | 0 |
| Age (years) | ||||
| 15-17 | 33 | 2.1 | 31 | 1.5 |
| 18-29 | 432 | 27.9 | 560 | 27.4 |
| 30-59 | 871 | 56.3 | 1 177 | 57.6 |
| 60-69 | 178 | 11.5 | 212 | 10.4 |
| 70-85 | 33 | 2.1 | 63 | 3.1 |
| Missing | 1 | 0.1 | 1 | 0 |
| Weekly distance cycled | ||||
| Mean | 59.4 km [57.3–61.6] | 57.8 km [55.9–59.6] | ||
| Missing | 0 | 1 | ||
| Most common trip purposes (multiple answers allowed) | ||||
| To/from work/education | 1 354 | 87.5 | 1 777 | 86.9 |
| To/from shopping | 764 | 49.4 | 1 087 | 53.2 |
| To/from leisure activities | 860 | 55.6 | 1 156 | 56.6 |
| To/from training/work out | 476 | 30.7 | 577 | 28.2 |
| To/from other | 85 | 5.5 | 116 | 5.7 |
| Self-reported use of bicycle helmet | ||||
| Always | 1 115 | 72.0 | 1 486 | 72.7 |
| Now and then | 238 | 15.4 | 304 | 14.9 |
| Never | 195 | 12.6 | 253 | 12.4 |
| Missing | 0 | 0 | 1 | 0 |
| Self-reported use of brightly coloured clothes | ||||
| Always | 185 | 12.0 | 229 | 11.2 |
| Now and then | 567 | 36.6 | 706 | 34.5 |
| Never | 796 | 51.4 | 1 108 | 54.2 |
| Missing | 0 | 0 | 1 | 0.1 |
| Type of bicycle | ||||
| European city bike | 855 | 55.2 | 1 084 | 53.0 |
| Classic bicycle | 479 | 31.0 | 701 | 34.3 |
| Road bike | 145 | 9.4 | 161 | 7.9 |
| Cargo bike | 22 | 1.4 | 34 | 1.7 |
| Other/don’t know | 47 | 3.0 | 63 | 3.1 |
| Missing | 0 | 0 | 1 | 0 |
The mean number of questionnaires responded to was 8.6. There was a significant positive linear correlation between respondent’s age and the number of completed questionnaires (N = 4,230; R2 = 0.70, P < 0.0001). This implies that dropouts were mainly younger individuals. There was neither a significant difference between the test group’s and control group’s completed questionnaires (ANOVA, N = 4,225, df = 1, P = 0.35), nor between the males’ and females’ number of completed questionnaires (ANOVA, N = 4,225, df = 1, P = 0.47).
3.2 Accident data
An accident was defined as an event where the respondent was cycling, and one or more of the following criteria were met:
-
The cyclist had unintentional and abrupt physical contact with another road user.
-
The cyclist fell and/or was injured while cycling, without other road users being involved.
-
The cyclist fell and/or was injured because of another party's behaviour, including damage to the cyclist's property, even though there was no physical contact between the road users.
Only accidents that occurred on a road, square, or area used for general traffic by one or more types of road users Denmark were included in the project, excluding accidents on, for example, forest trails (general delimitation of road accidents referring to section 1 of the Danish Road Traffic Act). 20 accidents from the test group and 20 from the control group were removed from the analysis because they did not meet the inclusion criteria.
Based on the respondent’s accident description, each accident was categorised as a single-party or multi-party accident, and the severity of the accident was assessed following Lahrmann et al. (2018) (Table 5).
From November 2020 to November 2021, a total of 230 accidents were reported: 121 in the test group and 109 in the control group (Table 4). Most accidents were MPAs, took place in winter and in daylight (Table 5–Table 6).
| Group | Number of reported bicycle accidents | Total number of accidents | |||
|---|---|---|---|---|---|
| 0 | 1 | 2 | 3 | ||
| Test group | 1 455 | 103 | 9 | 0 | 121 |
| Control group | 1 949 | 98 | 4 | 1 | 109 |
| Total | 3 404 | 201 | 13 | 1 | 230 |
| Accident characteristics | Test group | Control group | ||||||
|---|---|---|---|---|---|---|---|---|
| All accidents | Percent (%) | Personal injury accidents | Percent (%) | All accidents | Percent (%) | Personal injury accidents | Percent (%) | |
| Type* | ||||||||
| Single accidents | 59 | 48.8 | 14 | 56.0 | 36 | 33.0 | 12 | 34.3 |
| Multi-party accidents | 62 | 51.2 | 11 | 44.0 | 73 | 67.0 | 23 | 65.7 |
| Season* | ||||||||
| Winter (October-March) | 79 | 65.3 | 18 | 72.0 | 70 | 64.2 | 22 | 62.9 |
| Summer (April-September) | 42 | 34.7 | 7 | 28.0 | 39 | 35.8 | 13 | 37.1 |
| Self-reported light conditions* | ||||||||
| Daylight | 87 | 71.9 | 14 | 56.0 | 80 | 73.4 | 28 | 80.0 |
| Dusk | 12 | 9.9 | 3 | 12.0 | 8 | 7.3 | 1 | 2.9 |
| Darkness | 22 | 18.2 | 8 | 32.0 | 21 | 19.3 | 6 | 17.1 |
| Contact to police, ER, insurance§ | ||||||||
| Police recorded accidents | 6 | 5.0 | 4 | 16.0 | 6 | 5.5 | 3 | 8.6 |
| Insurance company recorded accidents | 20 | 16.5 | 7 | 28.0 | 23 | 21.1 | 13 | 37.1 |
| Treatment in ER | 19 | 15.7 | 12 | 48.0 | 27 | 24.8 | 18 | 51.4 |
| Treatment by GP | 16 | 13.2 | 12 | 48.0 | 24 | 22.0 | 15 | 42.9 |
| Use of light, helmet, brightly coloured clothes§ | ||||||||
| Bicycle light (all kinds) | 112 | 92.6 | 23 | 92.0 | 48 | 44.0 | 14 | 40.0 |
| Bicycle helmet | 104 | 86.0 | 20 | 80.0 | 83 | 76.1 | 27 | 77.1 |
| Brightly coloured clothes | 30 | 24.8 | 4 | 16.0 | 20 | 18.3 | 7 | 20.0 |
| Total | 121 | 25 | 109 | 35 | ||||
| Accident characteristics | Test group | Control group | ||
|---|---|---|---|---|
| All accidents | Personal injury accidents | All accidents | Personal injury accidents | |
| Season | ||||
| Winter (October-March) | 34 | 6 | 47 | 15 |
| Summer (April-September) | 28 | 5 | 26 | 8 |
| Light conditions | ||||
| Daylight | 52 | 7 | 51 | 17 |
| Dusk | 4 | 2 | 5 | 0 |
| Darkness | 6 | 2 | 17 | 6 |
| Counterpart | ||||
| Light counterpart | 23 | 5 | 22 | 7 |
| Motorised counterpart | 39 | 6 | 51 | 16 |
| Use of light, helmet, brightly coloured clothes | ||||
| Bicycle light (all kinds) | 57 | 10 | 34 | 9 |
| Bicycle helmet | 50 | 8 | 57 | 20 |
| Brightly coloured clothes | 16 | 1 | 14 | 5 |
| Multi-party accidents, total | 62 | 11 | 73 | 23 |
3.3 Safety effect of daytime running lights
Daytime running lights are presumed to only affect multi-party accidents (MPAs); thus, the effect was assessed exclusively on MPAs. However, the respondents were asked to report all accidents—including single bicycle accidents (SBAs) in daylight, where it is difficult to imagine that daytime running lights would have any effect.
Safety effect of daytime running lights was estimated as incidence rate ratio (IRR) between the test and control group. The incidence rate is the number of accidents per person-month. For example, the test group rode with daytime running lights for 15,836 person-months throughout the project period and had 11 MPAs with personal injury. This resulted in an incidence rate of (11/15,836) = 0.00069. In the same period, the control group rode with daytime running lights for 20,667 person-months and reported 23 multi-party accidents with personal injury, resulting in an incidence rate of (23/20,667) = 0.0011.
The IRR is thus (0.00069/0.0011) = 0.62, representing a 38% lower number of MPAs in the test group normalized by group size relative to the number of MPAs in the control group normalized by group size.
As it turned out, the incidence rate for all single bicycle accidents in daylight for the test group was higher than for the control group (Table 7). This suggests that there may have been reporting bias with more accidents being reported by the test group. For personal injury accidents (PIAs) the reverse was true: reporting of more accidents by the control group. It should be noted, however, that the confidence intervals are wide, and none of the results are significant.
| SBAs in daylight | SBA | Incidence rates * 1,000 | IRR | 95% CI (IRR) | ||
|---|---|---|---|---|---|---|
| Test group | Control group | Test group | Control group | |||
| All SBAs | 35 | 29 | 2.21 | 1.40 | 1.58 | [0.96–2.58] |
| SBA with personal injury | 7 | 11 | 0.44 | 0.53 | 0.83 | [0.32–2.14] |
Reports of single bicycle accidents in daylight were used to correct for potential report bias following Madsen et al. (2013): The incidence rates for test group accidents in all multiparty accidents were divided by 1.58 (corrected values in Table 8); test group accidents in multiparty personal injury accidents were divided by 0.83 (Table 9).
| Multiparty accidents | Number of accidents | Incidence rates * 1,000 | IRR | 95 % CI (IRR) | ||
|---|---|---|---|---|---|---|
| Test group | Control group | Test group (Corrected) | Control group | |||
| Season | ||||||
| Winter | 34 | 47 | 2.39 | 3.99 | 0.60 | [0.31–1.16] |
| Summer | 28 | 26 | 2.60 | 2.91 | 0.89 | [0.43–1.85] |
| Light conditions | ||||||
| Daylight | 52 | 51 | 2.08 | 2.46 | 0.84 | [0.45–1.58] |
| Dusk | 4 | 5 | 0.16 | 0.24 | 0.66 | [0.16–2.70] |
| Dark | 6 | 17 | 0.24 | 0.82 | 0.29 | [0.10–0.84] |
| Counterpart | ||||||
| Truck/bus, van, personal car, MC, moped | 23 | 22 | 0.92 | 1.06 | 0.87 | [0.40–1.86] |
| Bicyclist, pedestrian | 39 | 51 | 1.56 | 2.46 | 0.63 | [0.33–1.21] |
| Total | 62 | 73 | 2.48 | 3.53 | 0.70 | [0.39–1.28] |
| Multiparty PIA | Number of accidents | Incidence rates * 1,000 | IRR | 95% CI (IRR) | ||
|---|---|---|---|---|---|---|
| Test group | Control group | Test group (Corrected) | Control group | |||
| Season | ||||||
| Winter | 6 | 15 | 0.80 | 1.28 | 0.63 | [0.16–2.40] |
| Summer | 5 | 8 | 0.88 | 0.90 | 0.98 | [0.23–4.25] |
| Light conditions | ||||||
| Daylight | 7 | 17 | 0.53 | 0.82 | 0.65 | [0.18–2.36] |
| Dusk | 2 | 0 | 0.15 | 0.00 | - | [- ; -] |
| Dark | 2 | 6 | 0.15 | 0.29 | 0.52 | [0.08–3.36] |
| Counterpart | ||||||
| Truck/bus, van, personal car, MC,moped | 5 | 7 | 0.38 | 0.34 | 1.12 | [0.25–4.97] |
| Bicyclist, pedestrian | 6 | 16 | 0.46 | 0.77 | 0.59 | [0.16–2.24] |
| Total | 11 | 23 | 0.84 | 1.11 | 0.75 | [0.23–2.47] |
For multiparty personal injury accidents, the corrected overall effect of daytime running lights was a 25% risk reduction. The effect was insignificant. For all multiparty accidents, the corrected overall effect of daytime running lights was an insignificant 30% risk reduction. For multiparty accidents in the dark, the effect of daytime running lights was significant (71% risk reduction).
It is noted that with the corrected values for the test group’s incidence rates, the incidence rate ratio and thereby the estimated effect are slightly smaller than the uncorrected values for personal injury accidents. For example, the total effect is only a 25% risk reduction compared to the uncorrected effect of 38% (not shown). It should still be emphasized that none of the corrected values in Table 9 are significant. It is also noted that with the corrected values for the test group’s incidence rates for all accidents the effect of daytime running lights is again positive, but not statistically significant for most groups. However, there was a statistically significant risk reduction using daytime running lights for accidents in the dark (Table 8).
4. Discussion
Project participants made up a convenience sample of volunteers: they were recruited through a press release, and participants were encouraged to share the information in their networks and on the municipalities' social media and networks. Moreover, a major boost in registrations came after a feature on Danish Broadcasting Corporation (DR).
Potential participants actively joined the study via a registration link on the project’s website. All in all, participants were interested in the project at the time of registration, which most likely positively impacted the retention of participants throughout the project. Some of the participants may have been influenced by the desire to purchase bicycle lights at a discounted price.
With a convenience sample the question arises whether participants are representative of the cycling population. In 2021, 50% of cycle trips in Denmark (991,000 trips) were performed by males, 50% (990,000 trips) by females (Danish Centre for Cycling Knowledge 2025). In our sample, there was an overrepresentation of female respondents: 2.055 (= 57.3%) of the respondents who responded to one or more questionnaires were females, whereas 1.531 (= 42.7%) were males. However, the skewness affected the test and control group similarly and thus there is no reason to believe that it has had an influence on the end risk result.
Recruitment and experiment took place during Corona. This may have resulted in unexpected effects, for example more participants signing up due to a lack of alternative activities and/or lower number of kilometres cycled in the experiment period as most people remained at home. None of these effects are believed to have influenced the results to any significant extent: If more participants signed up, it would benefit the experiment as a whole; if lower number of kilometres were cycled, it would affect the test and control group equally because of the randomisation and thus the effects would cancel each other out.
Various numbers of participants responded to the 13 accident forms (Table 2). Who were the dropouts, and did the dropouts introduce a bias in the result? There was neither a significant difference between the pattern of dropout (Cox proportional hazards model, N = 4,225, P = 0.82) nor between the number of completed forms in the test and control group (Anova, N = 4,225, P = 0.35) or between males’ and females’ number of completed forms (Anova, N = 4,225, P = 0.49). There was a significant difference in the number of completed forms in the various age groups (Anova, N = 4,224, P < 0.0001): more completed forms with increasing participant age. The dropouts are believed to not affect the final result, primarily because there was neither a difference in the number of completed forms nor in the dropout pattern in the test and control group. The difference in response rate related to age affected the test and control group in the same way and thus had no overall effect. The mean number of questionnaires responded to was lowest in the group of 15-17 years of age (6.2). This number is high enough for the results to include all age groups in the results.
There may be a probability that dropout rate in the test group (unlike in the control group) filtered out uncommitted and un-invested participants. The feedback from the test group could thus, in theory, be expected to be more detailed, "sensitive", and generally more "eager". However, we have no data to confirm this.
The random allocation of participants to the test and control groups makes it likely that the groups were similar. Thus, any differences in their accident risk as cyclists could reasonably be attributed to the use of daytime running lights in the test group. Both groups shared the same characteristics and were followed over the same period, with one group being “treated” and the other not (Elkins 2015). The fact that no characteristics were significantly different between the test and the control group (Table 3) is an indicator of similarity between the groups.
Participants were volunteers, self-selected, and as such they are non-representative and may differ from the rest of the population when it comes to e.g. risk awareness and cycling exposure. There is, however, no reason to believe that self-selection affected the test group and the control groups differently. Moreover, because incidence rate ratios are just that: ratios between two risk measures (number of accidents per exposure, in this case number of respondent months), potential differences caused by self-selection balance each other out in the final incidence rate ratio.
The use of daytime running lights resulted in an overall reduction of multiparty personal injury accidents of 38% [95% CL 0.30;1.28] ranging from 7% [0.29;2.93] to 56% [0.08;2.15] when looking at different counterparts and light/dark - summer/winter and for multiparty accidents a general increase of 11% [0.79;1.55] ranging from a 54% decrease [0.18;1.17] to a 41% increase [0.82;2.40]. None of the results are statistically significant. The hypothesis based on Madsen et al. (2013) was a greater effect in daylight/summer than in darkness/winter, based on the assumption that cyclists already use lights in the dark. However, the results do not support this hypothesis. There is no reason to believe that using daytime running lights in daylight would lead to more accidents.
For multiparty personal injury accidents, the correction for potential report bias led to smaller, still insignificant, effects of daytime running lights (Table 9): Overall, a 25% reduction in all multi-party accidents with personal injury. For all multiparty accidents (Table 8), the results after correction led to a 30% reduction in multiparty accidents in general, and reductions between 11% and 71% in the specific categories. The number of multiparty accidents in the dark was significantly reduced by 71%. This result seems surprising, since it would be fair to assume—given that the 24-hour bicycle lighting increases visibility and that this increased visibility decreases the number of accidents—that daytime running lights primarily would affects accidents in daylight, where cyclists typically do not have lights on.
This particular finding could be due to participants in the test group having much better lighting at night than participants in the control group—or simply because some cyclists in the control group non-compliantly with the Road Traffic Act did not use lights at night during the experiment, thus increasing the number of accidents and incidence rates in the control group and decreasing the incidence rate ratio.
The effects of daytime running lights in this study are considerably smaller than those in Madsen et al. (2013). After correction for potential bias the effects are insignificant reductions of the number of accidents. There are likely several explanations for why the differences between the two studies are so large.
Methodologically, the studies were similar, but participants in Madsen et al. (2013) were probably more dedicated, as a permanently mounted light without a battery and with virtually no resistance when cycling was a major novelty at the time of that study. Nowadays, this type of bicycle light does not have the same novelty, and many participants likely signed up primarily to get a cheap bicycle light. Therefore, their accident reports may be subject to greater variation than in the previous study. This is supported by the fact that the response rate for the monthly surveys was much lower in this study. Moreover, in Madsen et al. (2013) the participants in the control group probably used less (often) lighting than nowadays which would result in a greater effect of the light.
The study was designed based on the assumption that a statistically significant effect could be demonstrated if there was a difference in the incident rate between the two groups of at least 25%, with 4,000 participants, and if 10% of these (i.e., 400) would report an accident during the project period. The assumption of 10% was adopted from Lahrmann et al. (2018). However, we reached 3,592 active participants only, and these participants reported 230 accidents, corresponding to 6.4%. One explanation for the fewer reported accidents could be that participants in this study, as a group, cycle fewer kilometres than the participants in Lahrmann et al. (2018). However, since Lahrmann et al. (2018) did not measure exposure, this explanation cannot be substantiated. This explanation points to lack of statistical power to document a potential small effect.
There are two fundamental explanations to the insignificant effect of daytime running lights, namely 1) the lights tested do not make a difference between the test and control group in terms of visibility, 2) cyclists are visible “enough” as they are and accidents have other reasons than lack of visibility.
When using self-reported accidents as a data source in effect studies, one must be aware that there are various potential biases or distortion of results:
First, there are demand characteristics, where participants form an interpretation of the experiment's purpose and unconsciously alter their behaviour to fit this interpretation (Bhandari 2022). Both the test group and the control group in this project were aware of the hypothesis that the bicycle light would protect the test group from accidents. To test whether demand characteristics occur in this project, we examined single-vehicle accidents in the two groups based on the hypothesis that if demand characteristics appeared in the participants' reports, they would also appear in single-vehicle accidents. This is because the participants may not have realized that their bias should only apply to multiparty accidents, not single bicycle accidents.
Report bias due to demand characteristics most likely appears in single-vehicle daylight accidents, because in this group of accidents, daytime running lights most likely have no effect. In the "all single vehicle accidents in daylight"-category there are more accidents reported in the test group than in the control group (35 and 29, respectively, Table 9). The control group, on the other hand, reported more single-vehicle personal injury accidents than the test group (11 vs. 7). It must be noted that the numbers are small and the confidence intervals consequently wide. A difference in reporting of single-vehicle accidents has been observed in two similar studies: Madsen et al. (2013, effect of bicycle running light) and Lahrmann et al. (2018, effect of a yellow bicycling jacket). In both studies, the test group reported fewer single-vehicle accidents than the control group (64 vs. 91 and 80 vs. 96, respectively). One explanation could be that the participants in these two previous studies were highly dedicated and safety-conscious cyclists, whereas the participants in the present study were, to a much greater extent, cyclists who just wanted an inexpensive bicycle light. For instance, in Lahrmann et al. (2018), 76% and 85% of the test and control groups, respectively, responded to all accident questionnaires, while in this project, only 38% and 37%, respectively, responded to all accident questionnaires.
There may also be bias related to the respondents' descriptions of the accident. This is known as social desirability bias where due to self-presentation concerns, survey respondents underreport socially undesirable activities and overreport socially desirable ones (Krumpal 2013). However, the bias that may arise in this context only relates to a few of the parameters that respondents report about their accident, like questions about driving under the influence of alcohol and other psychoactive substances and fault, while parameters such as accident situation, own and counterpart transport mode and accident location are not expected to be affected by this bias (Møller 2019).
Generally, two types of social desirability bias are discussed: (1) Self-deceptive enhancement and (2) Impression management. Self-deceptive enhancement occurs when the respondent believes something is true when it is not. In this case, the respondent is not consciously trying to present themselves positively or attempting to do so, but does so, nonetheless. An example of this could be the assessment of who is at fault in an accident. Driving under the influence of alcohol could be an example of 'impression management': The respondent is aware of a high blood alcohol level but consciously attempts to conform to social or group norms (Paulhus 1984; Lajunen et al. 1997; Nikolopoulou 2022).
However, there is no reason to assume that the effect measures of this project—the relative difference in the number of accidents per participant month between the test and control groups—are affected by social desirability bias. Should one of these biases be present, it would likely occur in both the test and control groups and therefore probably cancel out in the ratio between the groups.
Both Madsen et al. (2013) and Lahrmann et al. (2018) conclude that the use of self-reported accidents has been quite useful. It is also our assessment in this project that the quality of the responses has been sufficient. Therefore, it is our evaluation that self-reporting of accidents, as a method and design, still holds potential for use in traffic safety projects. This applies particularly in randomised controlled trials such as this one where potential biases likely cancel each other out.
5. Conclusion
In this study, we tested the effect of daytime running lights on the number of self-reported cyclist-vehicle accidents. Using a randomised controlled trial design, 5,380 voluntary cyclist participants were randomly assigned to a test group (using daytime running lights continuously for one year) or a control group (using their usual light routine for one year). Safety effect was estimated as incidence rate (accidents per person months) ratio between test and control group. Multiparty accidents in the test group were corrected for reporting bias.
Main findings:
230 accidents were reported: 121 (25 personal injury accidents) in the test group and 109 (35 personal injury accidents) in the control group.
Most accidents were multiparty accidents, took place in winter and in daylight.
For all multiparty accidents, the effect of daytime running lights was an insignificant 30% risk reduction.
For multiparty personal injury accidents, the effect of daytime running lights was an insignificant 25% risk reduction.
For multiparty accidents in the dark, the effect of daytime running lights was a significant 71% risk reduction. We attribute this to participants in the test group having better lighting at night than participants in the control group.
We conclude that there may be safety potential in the use of daytime running lights; however, this experiment has not been able to significantly document an effect apart from the category multiparty accidents in the dark. This may be due to either the fact that the bicycle lights tested in this experiment did not significantly increase visibility of the cyclists in the test group, or to the fact that an increased visibility did not significantly decrease accident risk. The significant decrease in risk reduction for multiparty accidents in the dark points to increased visibility in the dark of the bicycle lights tested. It could be that the bicycle lights tested do not make a difference between the test and control group in terms of visibility in the day or that cyclists are visible “enough” as they are in the day and accidents have other reasons than lack of visibility.
Acknowledgement
This paper is based on the report (in Danish) Lahrmann, H., Christensen, M. C., Tallaksen, A. B., Tønning, C., Larsen, M. K., Madsen, T. K. O., Rasmussen, L. R., & Olesen, A. V. (2023). Projekt Cykelliv: en undersøgelse af den sikkerhedsmæssige effekt af kørelys på cykler. (1 udg.) Institut for Byggeri, By og Miljø (BUILD), Aalborg Universitet. BUILD Rapport Bind 2023 Nr. 02 https://vbn.aau.dk/ws/portalfiles/portal/515256123/Projekt_Cykelliv.pdf
CRediT contribution statement
Tove Hels: Formal analysis, Validation, Visualization, Writing—original draft. Tanja Kidholm Osmann Madsen: Conceptualization, Data curation, Formal analysis, Investigation, Writing—review & editing. Michelle Cederstrøm Christensen: Data curation, Investigation, Visualization. Anders Brogaard Tallaksen: Data curation, Investigation, Visualization. Harry Lahrmann: Conceptualization, Funding acquisition, Methodology, Project administration, Writing—review & editing.
Declaration of competing interests
The authors report no competing interests.
Declaration of generative AI use in writing
The authors declare that no generative AI was used in this work.
Ethics statement
At the time of this study, there was no requirement for ethical approval. Before conducting the study, ethical aspects were indeed considered. Particularly, we considered that the test group could potentially be of higher accident risk with the bicycle lights tested in this study compared to what they used before. The tested bicycle lights did, however, comply with the regulations in terms of visibility, and we excluded cyclists who were already using permanent bicycle lights that may have been stronger than the bicycle light provided.
Funding
This research was partly funded by A.P. Møller Fonden and Det Nissenske Familiefond. Reelight (Reelight.com) provided the lights while respecting the necessary arm’s-length distance between the manufacturer of the lights and those evaluating them.
Editorial information
Handling editor: Aliaksei Laureshyn, Lund University, Sweden.
Reviewers: Jakub Sliacan, Swedish National Road and Transport Research Institute, Sweden; Maartje de Goede, SWOV Institute for Road Safety Research, Netherlands.
Submitted: 16 June 2025; Accepted: 13 November 2025; Published: 5 December 2025.