The validity of the short driver behaviour questionnaire in varying road users groups in India: age, gender, and driving frequency
Abstract
The Driver Behaviour Questionnaire (DBQ) is a widely used tool for assessing driving behaviours and their implications for road safety. This study examined the factor structure of the DBQ in an Indian context, where cultural and regulatory conditions may shape aberrant driving patterns differently. Data were collected from 1,665 drivers across multiple states through both online and in-person surveys, with 1,657 valid responses retained after outlier removal. The dataset included 28 DBQ items rated on a 5-point Likert scale, along with demographic variables. Exploratory Factor Analysis (EFA) was conducted to explore alternative two-, three-, and four-factor structures, followed by Confirmatory Factor Analysis (CFA) to evaluate the model fit. EFA suggested a two-factor solution as a simpler data-driven representation; however, it demonstrated weak reliability in one factor and a limited ability to distinguish between constructs. In contrast, the four-factor solution not only explained more variance (37.55%) with balanced reliability across factors, but also aligned with theoretical expectations and prior DBQ research. CFA further confirmed the superiority of the four-factor model, which yielded stronger fit indices (χ²/df = 7.601, CFI = .851, RMSEA = .063) and demonstrated measurement invariance across gender, age, and driving frequency. The four factors—Risky and Rule-Violating Behaviours, Safe and Responsible Driving Practices, Driving Errors and Cognitive Lapses, and Distracted and Emotionally Influenced Driving—offer a robust, culturally adapted framework for understanding driver behaviour in India. This validated structure provides a reliable basis for identifying high-risk behaviours and guiding evidence-based road safety interventions.
1. Introduction
The Driver Behaviour Questionnaire (DBQ) is one of the most widely used instruments for analyzing driving behaviors and their implications for road safety. First introduced by Reason (1990) as part of the Generic Error Modelling System (GEMS), the original DBQ contained 50 items designed to measure three categories of aberrant driving behavior—lapses, errors, and violations. Subsequent work further refined the framework. For example, Blockey and Hartley (1995) classified driving behaviors in Australia as general, dangerous, or extremely dangerous, whereas Lawton et al. (1997) distinguished between ordinary and aggressive violations. Later, Åberg and Rimmo (1998) subdivided errors into dangerous, inattention-related, and inexperience-related types.
Over time, the DBQ has been applied in diverse cultural contexts, including the USA, UK, Qatar, China, and Australia (Martinussena et al., 2013), and has become one of the most frequently used tools in traffic psychology research (De Winter & Dodou, 2010). Despite variations in factor structures across studies, the distinction between unintentional errors and deliberate violations remains consistent, underscoring the importance of driver motivation (Ozkan et al., 2006).
Demographic influences on driving behavior have also been well documented. Research shows that younger drivers, males, and frequent drivers are more likely to commit violations, whereas females report more lapses and attention-related slips (Lajunen et al., 2004; Reason et al., 1990). Violations are stronger predictors of road accidents, particularly among younger drivers, whereas errors and lapses are more often linked to crashes among older drivers (De Winter & Dodou, 2010). These findings highlight the need for targeted interventions, such as education and training, to reduce errors and attitude change combined with stricter law enforcement to reduce violations (Parker et al., 1995).
Adaptations of the DBQ to cultural contexts have further advanced its applicability. In Lebanon, items were removed, merged, or linguistically modified following expert feedback and pilot testing (Youssef et al., 2023). In India, the questionnaire was reduced to 22 items to better reflect local driving norms (Gupta et al., 2021). Similarly, in Amman, Jordan, the Manchester DBQ was expanded to 26 items with additional violations and demographic questions (Jadaan et al., 2021). These examples illustrate how cultural and environmental differences necessitate localized revisions of the DBQ.
Recent developments have expanded the DBQ framework to include positive driving behaviors—actions intended to protect other road users, even if they may occasionally lead to mistakes (Ozkan & Lajunen, 2005). Such refinements underscore the complexity of driving behavior and reinforce the value of the DBQ as a research tool (Hussain et al., 2023). Common classification schemes now distinguish between violations, aggressive violations, errors, and lapses (Koppel et al., 2018). Given that driver inattention remains a major contributor to accidents (Ledesma et al., 2010), and that driving style strongly affects safety (Long & Ruosong, 2019), validating the DBQ across diverse populations remains essential.
Although some studies have validated the DBQ for specific groups, such as elderly drivers in France (Gabaude et al., 2010), no comprehensive validation has yet been conducted for Indian drivers across different age groups, genders, and driving frequencies.
To address this research gap, the present study sought to validate a revised DBQ tailored for Indian drivers. Drawing on prior adaptations (Aberg & Rimmo, 1998; Lawton, Parker, Stradling, et al., 1997; Ozkan & Lajunen, 2005), this study incorporated both positive and negative aspects of driving behavior and evaluated two-, three-, and four-factor models. The objectives are twofold: (i) to identify the most suitable factor structure for representing aberrant driving behaviors in India and (ii) to develop a culturally adapted “Indian DBQ” capable of more accurately assessing high-risk driving patterns. By doing so, this study aims to provide a reliable, context-specific tool to inform behavioral interventions and support targeted road safety initiatives in India.
The remainder of this paper is organized as follows. Section 2 outlines the methodology, including participant recruitment, data collection procedures, and statistical analyses such as EFA and CFA. Section 3 presents the results, comparing the fit and reliability of the two-, three-, and four-factor DBQ models, along with subgroup analyses. Section 4 discusses the findings in relation to Indian driving behaviour, emphasizing the implications of adopting a four-factor structure. Finally, Section 5 concludes the paper with key insights, limitations, and potential directions for future research, including the development of an India-specific DBQ.
2. Method
2.1. Development of the Driver Behaviour Questionnaire
Prior to administering the DBQ for data collection, a pilot study involving 39 participants was undertaken to refine the instrument and enhance its clarity and contextual validity. The preliminary version of the questionnaire was developed with guidance from the faculty members of the Transportation Engineering Research Wing at the Institute. Subsequently, feedback was solicited from both the local traffic police and the participants to assess the situational appropriateness of the items. Based on this feedback, several modifications were incorporated, including simplification of technical terminology, clarification of ambiguous scenarios, and contextual adaptation of items to reflect Indian traffic conditions. For instance, the term “amber” was replaced with “yellow,” and examples of traffic violations were revised to align with the prevailing local traffic regulations. Furthermore, while the DBQ statements were originally provided only in English, they were later supplemented with regional language translations in brackets to enhance the participants’ clarity. Following these revisions, the final version of the DBQ was used for data collection.
2.2. Participation and data collection
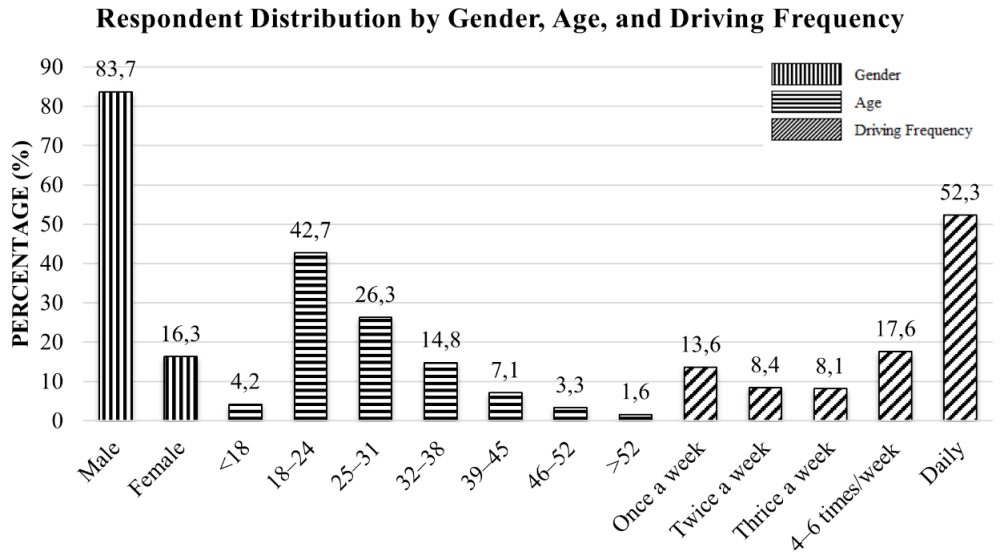
Responses to the DBQ were collected through both online and in-person modes. Stratified random sampling was employed based on the number of registered motor vehicles across states/UTs as reported by the Ministry of Road Transport and Highways. The participants were proportionally recruited from Andhra Pradesh, Delhi, Karnataka, Kerala, and Maharashtra to align with the vehicle population in these regions. Recruitment efforts combined targeted outreach to driver associations and social media groups with in-person visits to driving schools, parking areas of academic institutions, toll booths on state and national highways, and shopping mall parking facilities. This approach yielded 1,665 responses. A predominance of male participants (83.7%) was observed, reflecting the higher proportion of male drivers in India. According to the latest official statistics from the Ministry of Road Transport & Highways (MoRTH), women accounted for 12.02% of the total driver licences in India in 2019–20 (Road Transport Year Book 2019–20, Annexure 1.8, p. 66). The gender composition of our sample (83.7% male, 16.3% female) was broadly consistent with the national distribution (87.98% male, 12.02% female). This gender imbalance is acknowledged as a limitation, as it may affect the generalizability of the findings. Figure 1 presents the distribution of respondents by gender, age, and driving frequency.
The differences between the online and in-person samples were also considered. Online respondents were more likely to be younger, urban, and technologically adept, whereas in-person respondents included a higher proportion of older drivers and those who were less familiar with digital platforms. While this dual approach enhances the diversity of the sample, it may also introduce systematic biases. Additionally, urban drivers and nonprofessional drivers were somewhat overrepresented compared to rural and professional drivers, a limitation explicitly recognized in the discussion regarding the study’s representativeness.
Responses were recorded on a 5-point Likert-type scale to measure the frequency of various driving behaviours: “Never” (1), “Rare” (2), “Sometimes” (3), “Often” (4), and “Very Often” (5). This scale provided a standardized framework for assessing self-reported driving behaviours and distinguishing between occasional and frequent occurrences. Detailed characteristics of the samples are listed in Table 1.
To ensure data quality, outlier detection was conducted using the Mahalanobis D² statistic, with the cut-off based on the chi-square distribution at p < 0.001, consistent with the established multivariate analysis guidelines. This procedure identified eight multivariate outliers that were subsequently removed, leaving 1,657 valid responses for the final analysis.
| Item no. | Items | Mean | St.D. |
|---|---|---|---|
| i | Age | 2.95 | 1.26 |
| ii | Gender | 1.16 | 0.37 |
| iii | Driving frequency | 3.87 | 1.46 |
| 1 | Listening to music or following a map while driving | 2.29 | 1.16 |
| 2 | Experienced frustration with the actions and words of other drivers resulting in exceeding the speed limit | 2.12 | 0.88 |
| 3 | Drinking water or eating while driving | 1.83 | 0.83 |
| 4 | Give way to other drivers to merge or change lanes | 2.69 | 1.28 |
| 5 | Driven at higher speeds to impress other drivers on road or people | 1.64 | 0.81 |
| 6 | Talking to a co-passenger while driving | 2.71 | 1.08 |
| 7 | Change lanes to avoid potholes while driving | 2.78 | 1.10 |
| 8 | Your mood influences your driving speed | 2.35 | 1.02 |
| 9 | Sounded the horn to indicate frustration to other drivers in traffic | 1.96 | 0.95 |
| 10 | Before driving you check your vehicles condition such as fuel level tyre pressure etc. | 2.68 | 1.30 |
| 11 | Underestimate the speed of a vehicle coming from the opposite direction while overtaking | 2.34 | 1.06 |
| 12 | Accidentally turn on or off your vehicle’s indicator lights | 2.04 | 0.96 |
| 13 | Forget to change gears for the speed at which you are driving | 1.85 | 0.82 |
| 14 | Misread traffic signs road markings and got confused while driving | 1.89 | 0.84 |
| 15 | Maintain a safe distance from the vehicle in front | 2.59 | 1.29 |
| 16 | Felt confused when choosing an entry or exit at a junction | 2.00 | 0.86 |
| 17 | Give preference to pedestrians when they cross the road | 2.51 | 1.31 |
| 18 | Consume alcohol before driving a vehicle | 1.27 | 0.62 |
| 19 | Overtaken vehicles without checking the position of the vehicle coming from the back | 1.86 | 0.86 |
| 20 | Driven on the wrong side of a one-way road | 1.85 | 0.76 |
| 21 | Increased your speed to cross an intersection when the traffic signal changes from amber (yellow) to red | 2.04 | 0.91 |
| 22 | Overtake the other vehicles on the left | 2.23 | 0.94 |
| 23 | Find yourself parking or stopping your vehicle in no-parking zones | 2.09 | 0.99 |
| 24 | Go over the speed limit while driving | 2.12 | 0.89 |
| 25 | Tried stunts for pleasure or participated in informal races | 1.39 | 0.72 |
| 26 | Use your phone while driving such as placing it in your helmet or holding it between your shoulders and head | 1.79 | 0.87 |
| 27 | Jumped a red traffic light while driving | 1.65 | 0.75 |
| 28 | Wear a helmet or fasten your seat belt for driving shorter distances | 3.03 | 1.38 |
2.3. Statistical analysis
Statistical analysis was conducted using both Exploratory Factor Analysis (EFA) and Confirmatory Factor Analysis (CFA) to examine underlying dimensions and model fit. For the EFA, the adequacy of the correlation matrix was first assessed using the Kaiser–Meyer–Olkin (KMO) measure and Bartlett’s test of sphericity. Factor retention was guided by a scree plot. Principal axis factoring with Varimax rotation was employed to enhance interpretability, and factor loadings with absolute values below 0.40 were suppressed for clarity. The EFA was performed with forced two-, three-, and four-factor solutions. Subsequently, CFA was conducted using IBM SPSS (version 23.0) with maximum likelihood estimation to validate the factor structures derived from the EFA and evaluate the model fit for the two-, three-, and four-factor solutions. To account for demographic differences, a multi-group CFA was conducted to test measurement invariance across gender (male/female), age groups, and driving frequency categories. Configural, metric, and scalar invariances were examined to ensure that the DBQ factor structure was comparable across the groups.
3. Results
3.1. Factor structure
The initial analysis was conducted using Exploratory Factor Analysis (EFA) with principal axis factoring, extracting forced two-factor, three-factor, and four-factor solutions with varimax rotation. Examination of the scree plot indicated that a four-factor solution provided the best representation of the data. This outcome suggests that the two- and three-factor solutions of the DBQ are less appropriate for the present dataset.
A four-factor structure accounted for 37.55% of the total variance. To improve interpretability, factor loadings with absolute values below 0.40 were excluded from the results. The internal consistency of each factor was assessed using Cronbach’s alpha to confirm the reliability of the extracted factors. Detailed factor loadings for the four-factor solution are listed in Table 2.
| DBQ Items | Mean (SD) | Factor 1 | Factor 2 | Factor 3 | Factor 4 | ||
|---|---|---|---|---|---|---|---|
| α = 0.796 | α = 0.793 | α = 0.656 | α = 0.671 | ||||
| Risky and Rule-Violating Driving Behaviours | 20 | Driven on the wrong side of a one-way road | 1.85 (0.76) | .591 | |||
| 23 | Find yourself parking or stopping your vehicle in no-parking zones | 2.09 (0.99) | .586 | ||||
| 22 | Overtake the other vehicles on the left | 2.23 (0.94) | .529 | ||||
| 24 | Go over the speed limit while driving | 2.12 (0.89) | .501 | ||||
| 26 | Use your phone while driving such as placing it in your helmet or holding it between your shoulders and head | 1.79 (0.87) | .489 | ||||
| 27 | Jumped a red traffic light while driving | 1.65 (0.75) | .447 | ||||
| 21 | Increased your speed to cross an intersection when the traffic signal changes from amber yellow to red | 2.04 (0.91) | .446 | ||||
| 3 | Drinking water or eating while driving | 1.83 (0.83) | .432 | ||||
| 18 | Consume alcohol before driving a vehicle | 1.27 (0.62) | .417 | ||||
| 19 | Overtaken vehicles without checking the position of the vehicle coming from the back | 1.86 (0.86) | .401 | ||||
| Safe and Responsible Driving Practices | 17 | Give preference to pedestrians when they cross the road | 2.51 (1.31) | .763 | |||
| 10 | Before driving you check your vehicles condition such as fuel level tyre pressure etc | 2.68 (1.30) | .693 | ||||
| 15 | Maintain a safe distance from the vehicle in front | 2.59 (1.29) | .686 | ||||
| 4 | Give way to other drivers to merge or change lanes | 2.69 (1.28) | .567 | ||||
| Driving Errors and Cognitive Lapses | 16 | Felt confused when choosing an entry or exit at a junction | 2.00 (0.86) | .575 | |||
| 14 | Misread traffic signs road markings and got confused while driving | 1.89 (0.84) | .549 | ||||
| 12 | Accidentally turn on or off your vehicle’s indicator lights | 2.04 (0.96) | .524 | ||||
| 13 | Forget to change gears for the speed at which you are driving | 1.85 (0.82) | .483 | ||||
| Distracted and Emotionally Influenced Driving | 6 | Talking to a co-passenger while driving | 2.71 (1.08) | .566 | |||
| 7 | Change lanes to avoid potholes while driving | 2.78 (1.10) | .490 | ||||
| 8 | Your mood influences your driving speed | 2.35 (1.02) | .486 | ||||
| 1 | Listening to music or following a map while driving | 2.29 (1.16) | .402 | ||||
3.2. Evaluation of fit indexes for three model
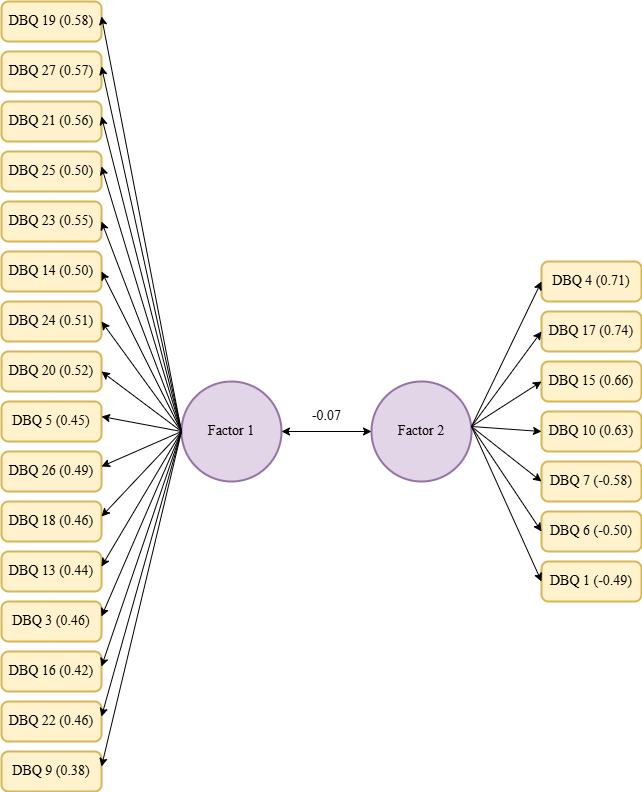
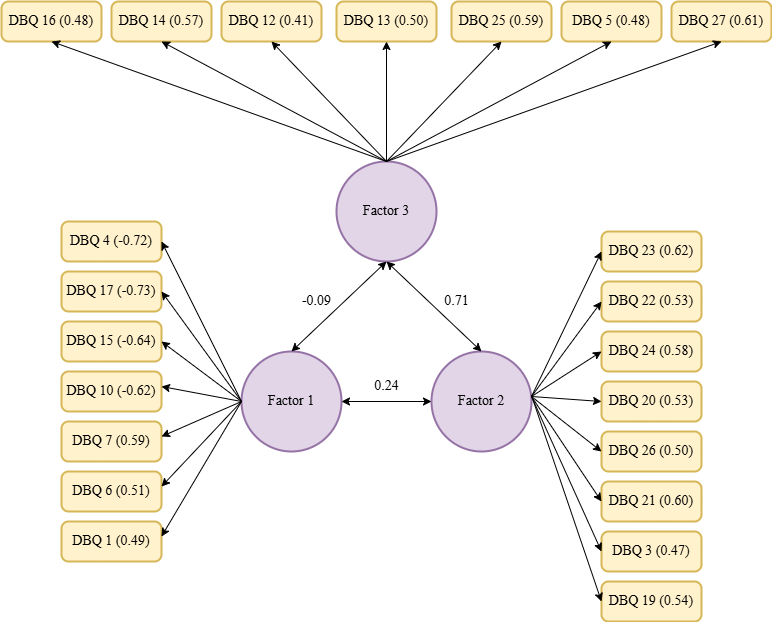
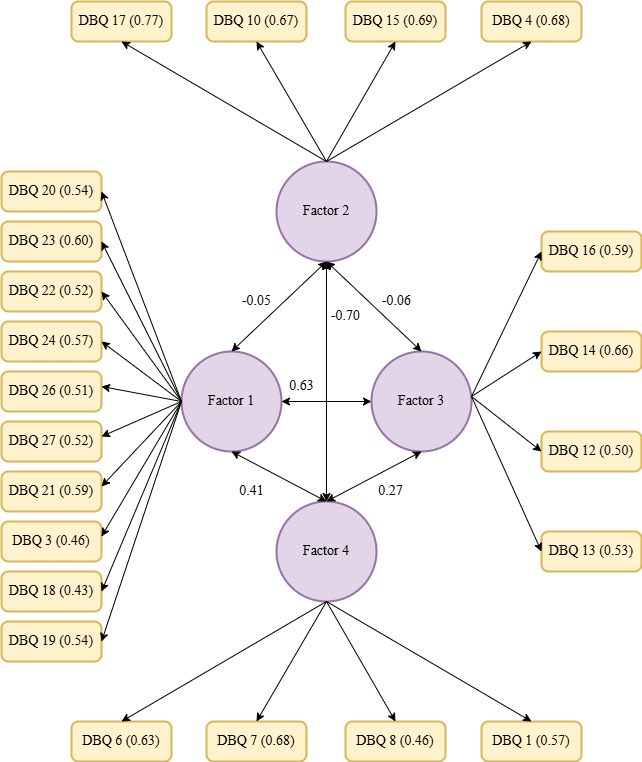
CFA was carried out to check how well the DBQ model fit the data, testing the four-factor model found in the EFA, and the forced three-factor and two-factor models. The structures of these models are shown in Figures 2–4, which illustrate that two, three, and four factors that are connected to each other and together explain aberrant driver behaviour. It is important to note that no item was linked to more than one factor. The goodness of fit indices (CFI, RMSEA, and Chi-square/df) were calculated for all three models using the entire sample. In addition, these models were tested on data from different groups of drivers, and the results are shown in Table 3. This approach helped determine whether the models worked well across the various driver subgroups.
3.3. Interpretation of EFA and CFA
This study examined three models of the Driver Behaviour Questionnaire (DBQ) structure using Exploratory Factor Analysis (EFA) and Confirmatory Factor Analysis (CFA): (i) forced two-factor, (ii) forced three-factor, and (iii) four-factor structures. The EFA results showed that the two-factor model had 23 items with loadings above 0.4, whereas the three-factor model had 22 items above this threshold. However, both models struggled to clearly distinguish between different driving behaviours. In contrast, the four-factor model revealed a more nuanced structure with 22 items exceeding the 0.4 threshold, identifying four distinct factors (see Table 2): (i) Risky and Rule-Violating Driving Behaviours, (ii) Safe and Responsible Driving Practices, (iii) Driving Errors and Cognitive Lapses, and (iv) Distracted and Emotionally Influenced Driving.
The CFA results provide further support for the four-factor model. The two-factor model showed a weak negative correlation (-0.07) between the factors, indicating an oversimplification of the driving behaviours. The three-factor model demonstrated mixed correlations, including a highly positive correlation (0.71) between the two factors, suggesting overlapping dimensions. In contrast, the four-factor model presented a clearer pattern of relationships, with strong negative correlations between certain factors (e.g., -0.70 between Safe and Responsible Driving Practices and Distracted and Emotionally Influenced Driving) and moderate positive correlations among others, confirming their theoretical distinctiveness.
Overall, the four-factor structure demonstrated the most comprehensive and theoretically consistent model of driving behaviours, effectively distinguishing between risky, safe, erroneous, and emotionally influenced actions.
3.4. Model fit indexes from CFA
Table 3 presents the model fit indices obtained from the CFA for the two-, three-, and four-factor DBQ structures. These indices, including χ²/df, CFI, and RMSEA, help evaluate the suitability and effectiveness of each model. A higher CFI and lower RMSEA indicate better model fit.
| Sub-group | Two- factor | Three- factor | Four- factor | ||||||
|---|---|---|---|---|---|---|---|---|---|
| Chi- square/ df | CFI | RMSEA | Chi- square/ df | CFI | RMSEA | Chi- square/ df | CFI | RMSEA | |
| Entire sample (n = 1657) | 11.198 | .759 | .078 | 9.689 | .807 | .072 | 7.601 | .851 | .063 |
| Age | |||||||||
| Less than 18 years (n =69) | 1.721 | .604 | .103 | 1.638 | .658 | .097 | 1.669 | .638 | .099 |
| 18 to 24 years (n =707) | 5.211 | .799 | .077 | 4.922 | .822 | .075 | 3.555 | .886 | .060 |
| 25 to 31 years (n =435) | 4.328 | .693 | .088 | 3.723 | .764 | .079 | 3.087 | .812 | .069 |
| 32 to 38 years (n =246) | 2.645 | .640 | .082 | 2.292 | .738 | .073 | 2.144 | .764 | .068 |
| 39 to 45 years (n =118) | 2.438 | .535 | .111 | 2.154 | .639 | .099 | 2.106 | .616 | .097 |
| 46 to 52 years (n =55) | 2.486 | .522 | .166 | 2.474 | .562 | .165 | 2.271 | .610 | .153 |
| More than 52 years (n =27) | 2.318 | .225 | .225 | 2.078 | .292 | .204 | 2.054 | .328 | .201 |
| Gender | |||||||||
| Male (n=1387) | 9.327 | .753 | .078 | 7.718 | .813 | .070 | 6.305 | .850 | .062 |
| Female (n=270) | 3.449 | .733 | .095 | 3.530 | .734 | .097 | 2.763 | .815 | .081 |
| Driving Frequency | |||||||||
| Once in a week (n =225) | 3.104 | .746 | .097 | 2.979 | .765 | .094 | 2.036 | .880 | .068 |
| Twice in a week (n =139) | 2.834 | .518 | .115 | 2.608 | .608 | .108 | 2.379 | .665 | .100 |
| Thrice in a week (n =135) | 2.522 | .471 | .107 | 2.010 | .653 | .087 | 2.171 | .617 | .093 |
| 4 to 6 times a week (n =291) | 3.041 | .685 | .084 | 2.586 | .769 | .074 | 2.583 | .769 | .074 |
| Daily (n =867) | 5.167 | .813 | .069 | 5.041 | .831 | .068 | 4.009 | .871 | .059 |
Table 4 presents the Factor Transformation Matrix, Cronbach’s alpha values for each factor, and Total Variance Explained for the two-, three-, and four-factor DBQ structures. These values indicate the reliability and explanatory power of each model, helping assess the most suitable factor structure. A higher alpha value signifies better internal consistency, while a greater total variance reflects a stronger representation of the underlying constructs (Hair et al., 2009).
| Two- factor | Three- factor | Four- factor | ||||||||||||
|---|---|---|---|---|---|---|---|---|---|---|---|---|---|---|
| Factor | 1 | 2 | Alpha Value | Factor | 1 | 2 | 3 | Alpha Value | Factor | 1 | 2 | 3 | 4 | Alpha Value |
| 1 | .932 | -.364 | .834 | 1 | -.302 | .724 | .620 | .159 | 1 | .699 | -.167 | .542 | .412 | .796 |
| 2 | .364 | .932 | .159 | 2 | .946 | .149 | .288 | .773 | 2 | .194 | .847 | .298 | -.350 | .793 |
| 3 | .116 | .674 | -.730 | .722 | 3 | .621 | .133 | -.724 | -.082 | .656 | ||||
| 4 | -.242 | .454 | -.211 | .293 | .671 | |||||||||
| Total Variance Explained=27.98% | Total Variance Explained=31.39% | Total Variance Explained=37.55% | ||||||||||||
4. Discussion
4.1. EFA results interpretations on two, three and four-factor DBQ structure
The EFA of the DBQ Structure demonstrated that the total explained variance increased progressively with the number of factors, indicating an improved representation of the underlying data. Specifically, the two-factor, three-factor, and four-factor structures explained 27.98%, 31.39%, and 37.55% of the variance, respectively. The Two-Factor DBQ Structure showed acceptable internal consistency for Factor 1 (α = .834), but exhibited very low reliability for Factor 2 (α = .159), suggesting that the second factor lacks cohesiveness as a construct. Although the Three-Factor Structure enhanced the explained variance, it displayed inconsistent reliability across factors (α = .159, .773, and .722), particularly Factor 1, which showed poor internal consistency. In contrast, the Four-Factor Structure not only accounted for the highest variance, but also demonstrated balanced and acceptable internal consistency across all factors (α = .796, .793, .656, and .671). This indicates a more nuanced representation of the data and better alignment with the underlying constructs. Furthermore, the Four-Factor Structure effectively captured more complex patterns within the data, enhancing both interpretability and validity. Therefore, the Four-Factor DBQ Structure emerged as the most robust and reliable model among the three, offering a more comprehensive and consistent representation of the underlying constructs.
4.2. CFA results interpretations on two, three and four-factor DBQ structure
Confirmatory Factor Analysis (CFA) of the DBQ structure across two-, three-, and four-factor models revealed that the Four-Factor Structure provided the best overall fit and validity. For the entire sample (n = 1657), the Four-Factor Structure demonstrated superior fit indices, with a chi-square/df of 7.601, CFI of .851, and RMSEA of .063, outperforming the two-factor (chi-square/df = 11.198, CFI = .759, RMSEA = .078) and three-factor models (chi-square/df = 9.689, CFI = .807, RMSEA = .072). This pattern of better fit was consistently observed across most age groups, with the four-factor model achieving higher CFI values and lower RMSEA, particularly in the 18–24 (CFI = .886, RMSEA = .060) and 25–31 (CFI =.812, RMSEA =.069) year categories. Similarly, the Four-Factor Structure showed improved fit indices across genders, with better results for both males (chi-square/df = 6.305, CFI = .850, RMSEA = .062) and females (chi-square/df = 2.763, CFI = .815, RMSEA = .081). In terms of driving frequency, the model demonstrated a stronger fit among daily drivers (chi-square/df = 4.009, CFI = .871, RMSEA = .059).
Nevertheless, some subgroups, particularly older age groups and low-frequency drivers, yielded lower CFI values (e.g., CFI < 0.70). These results are likely due to two factors: first, these subgroups had smaller sample sizes (e.g., n = 27 for drivers above 52 years, n = 135–139 for some low-frequency driver categories), which may have reduced the stability of the parameter estimates in the CFA. Second, older and less frequent drivers may exhibit distinct behavioural patterns, such as limited exposure to complex traffic situations or more cautious driving styles, that differ from the broader population, thereby reducing the model fit. While these factors may affect subgroup-level fit indices, measurement invariance testing confirmed that the four-factor structure remained consistent across age, gender, and driving frequency groups, supporting its overall robustness.
Overall, the consistently higher CFI values and lower RMSEA values across the full sample and the majority of subgroups, along with evidence of measurement invariance, indicate that the Four-Factor Structure is the most robust, interpretable, and generalizable representation of the DBQ among the tested models.
4.3. Contribution of the present study
This study contributes significantly by examining the structure of the DBQ and verifying that the four-factor model is the most dependable and precise. Using both EFA and CFA, this study demonstrated that incorporating additional factors enhances the representation of driving behaviours. The Four-Factor model not only accounts for more data, but also performs effectively across various age groups, genders, and driving patterns, making it a robust and broadly applicable tool for researchers. The results offer future studies a clearer framework for comprehending risky driving behaviours. Researchers can expand this work by evaluating the model over time, utilizing actual driving data, and updating it to accommodate changes in traffic regulations and technologies. This study establishes a foundation for improved driver behaviour analysis that can contribute to enhancing road safety.
4.4. Limitations and future scope
Despite offering valuable insights, this study had several limitations. The findings are based on self-reported data, which may not always align with actual behaviours. This study is limited to specific regions in India, making it difficult to generalize the results to other areas with different social and infrastructural conditions. Additionally, the absence of observational data might have affected the accuracy of the reported behaviours. The sample also showed a predominance of male participants (83.7%), which may limit the generalizability of our findings. Moreover, urban and nonprofessional drivers were somewhat overrepresented compared to rural and professional drivers, which could introduce sampling bias. Differences in data collection methods may also have influenced the responses: online participants were more likely to be younger, urban, and technologically adept, whereas in-person participants included relatively older drivers and those less familiar with digital platforms. These factors may affect the representativeness of the datasets.
Future studies could adopt observational methods and tools such as artificial intelligence to better capture driver behaviours. The study approach can be extended to other countries by considering local traffic regulations, cultural differences, and infrastructure, contributing to a broader understanding of driver behaviour across diverse settings.
5. Conclusions
The research determined that a Four-Factor Structure was the most robust and dependable approach to comprehending the DBQ framework. Analyses using both the EFA and CFA supported this model, indicating that it accounted for the greatest variation (37.55%) and demonstrated strong internal consistency. The CFA findings verified that this model was the best fit for data across different demographics, including various age groups, genders, and driving behaviours, making it the most appropriate model for examining driving behaviours. However, this study had certain limitations. Although the sample was diverse, it might not fully represent all drivers in India. Self-reported data could be subject to bias, and the study did not consider accident history, which could have provided additional insights. It also concentrates solely on two-wheeler and car drivers, excluding other road users, such as truck drivers and pedestrians. Future research should monitor changes in the Four-Factor Structure over time, employ actual driving data for validation, and investigate alternative methods such as PCA. Furthermore, updating the DBQ to incorporate new traffic regulations and technologies could enhance its utility in road safety research.
Acknowledgement
We sincerely thanks to our colleagues and all participants who contributed to the data collection process. We also appreciate the valuable feedback and support received from the research team and others who assisted in various stages of this study. Lastly, we acknowledge the contributions of those who supported this research but are not included as authors.
CRediT contribution
Rahul Kshatriya: Conceptualization, Data Curation, Formal Analysis, Investigation, Methodology, Resources, Writing—original draft. Pooja K M: Data Curation, Resources, Writing—original draft. Yogeshwar V Navandar: Methodology, Supervision, Validation, Writing—review & editing. K Krishnamurthy: Supervision, Validation, Writing—review & editing.
Data availability
The data are available on request to the authors.
Declaration of competing interests
The authors report no competing interests.
Declaration of generative AI use in writing
During the preparation of this work, the authors used ChatGPT 4.0 in order to improve the readability and language of the manuscript. After using this tool/services, the authors reviewed and edited the content as needed and takes full responsibility for the content of the published article.
Ethics statement
The authors confirm that the data collection for this study was conducted with proper ethical considerations. Approval was secured from the department head to ensure adherence to institutional guidelines.
Funding
No external funding was used in this research.
Editorial information
Handling editor: Sonja Forward, Swedish National Road and Transport Research Institute, Sweden.
Reviewers: Lokesh Gupta, Sir Padampat Singhania University, India; Sonja Forward, Swedish National Road and Transport Research Institute, Sweden.
Submitted: 5 June 2025; Accepted: 27 October 2025; Published: 9 November 2025.