Determinants of crash numbers and constellations at turbo roundabouts in Germany
Abstract
Turbo roundabouts are a relatively new design. Thus far, research on their safety has focused on comparisons with other types of intersection and the effects of physical lane dividers. This study investigates crash patterns at German turbo roundabouts, based on a largely complete sample of such roundabouts and detailed data on infrastructure characteristics, traffic volumes and crashes. We calculate the crash rates for turbo roundabouts as a whole, as well as for their individual elements, including entries and exits, and the circulatory roadway. In addition, crash constellations are analysed and crash prediction models are computed, for all crashes and for the two most relevant crash constellations right-of-way and rear-end crashes. The results confirm earlier research findings that turbo roundabouts effectively combine high capacity with high safety levels. The results add new insights, thanks to the more detailed analysis. Entries and right-of-way crashes are most relevant, followed by rear-end crashes which mainly occur at the circulatory roadway. Crash constellations differ significantly between the different elements of the roundabouts, traffic volumes increase crash numbers for all designs and elements. We find no significant effects of the different types of marked lane dividers in our sample, this suggests that drivers do not respect solid lines and that physical dividers are potentially needed to prevent drivers from changing lanes in the circulatory roadway. The detailed analysis of crash patterns in this study enables specific recommendations to be made for improving safety at turbo roundabouts further and exploiting their potential more effectively.
1. Introduction
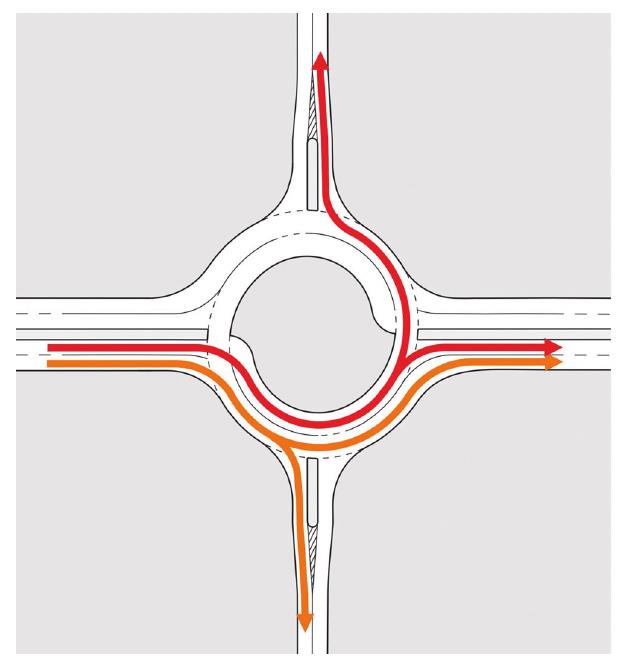
The turbo roundabout was invented in the 1990s in the Netherlands (Fortuijn, 2009). There are various types of turbo roundabouts, all of which share some common features. A typical design is illustrated in Figure 1. Like conventional roundabouts, turbo roundabouts have a circulatory roadway and give right of way to traffic in the circle. The special characteristic is the lane addition inside the circulatory roadway at one or more two-lane entries, vehicles on the left lane of the entry are then directed to the added lane on the inside. Vehicles on the right lane of the entry have to drive to the continued right lane of the circulatory roadway. Unlike conventional roundabouts with a single circular lane, turbo roundabouts have non-concentric circular lanes and multi-lane sections. Every lane that is added on the inside of the circulatory roadway is subtracted on the outside of the circulatory roadway at any of the following exits.
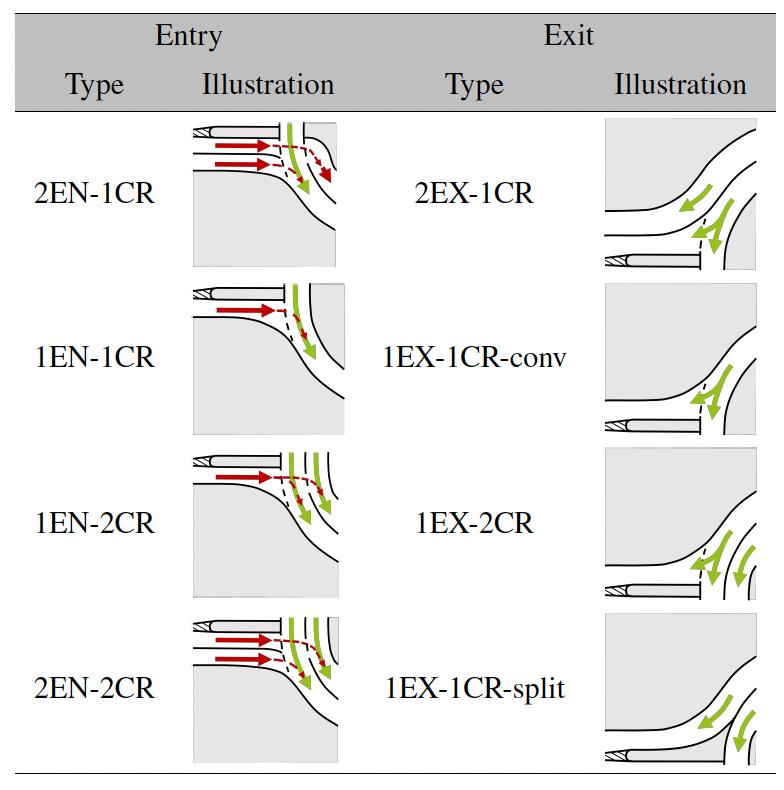
Although turbo roundabouts are widespread in the Netherlands, they are rare in other countries, with only a few examples in Germany, Poland, the Czech Republic and Austria. The German guidelines for turbo roundabouts (FGSV, 2015) define four entry and four exit types, which are shown in Table 1. Entries are grouped by the number of upstream entry and circulatory roadway lanes. Entry type 2EN-1CR represents a lane addition and is typical for turbo roundabouts. Single-lane entries similar to those at conventional single-lane roundabouts (e.g. 1EN-1CR) can be also found. Exits are grouped by the number of downstream exit and circulatory roadway lanes. A suffix is added to distinguish combinations with the same number of entry and exit lanes. 1EX-1CR-conv has one exit and one circulatory roadway lane. This design is frequently used in single-lane roundabouts and needs to be distinguished from 1EX-1CR-split, where a two-lane roadway splits into two single-lane roadways.
The entry and exit types shown in Table 1 are also common in turbo roundabouts in other countries, with the exception of 1EX-1CR-split. Turbo roundabouts with three-lane entries and corresponding circulatory roadways do not exist in Germany but can be found in the Netherlands.
With these characteristics, turbo roundabouts should combine the advantages of single-lane roundabouts, which are known for their high safety levels (Bondzio et al., 2012; Brilon et al., 1993; Schmotz et al., 2020; Spahn & Bäumler, 2007; Vieten et al., 2010), with the high capacity of multi-lane roundabouts. Safety issues such as lane changes on the circulatory roadway, which occur at multi-lane roundabouts, should not occur at turbo roundabouts, since incoming traffic is already assigned to the correct lane upon entering the turbo roundabout. An example of the reachable destinations by lane for 2EN-1CR is shown in Figure 1. At the same time, turbo roundabouts allow entries and exits with multiple lanes and therefore provide a higher capacity than single-lane roundabouts. The capacity of turbo roundabouts is up to 4 500 vehicles per hour (Brilon & Geppert, 2014) and depends to a large extent on the distribution of traffic flows across entries and exits (Kocianova, 2016). A key aspect of ensuring high safety levels at turbo roundabouts is preventing lane changes on the partially two-lane circulatory roadway, which is why solid markings or physical lane dividers separate the parallel lanes. Speed reducing elements like perpendicular entries and exits are also possible at turbo roundabouts to increase safety levels.
Previous research on the safety of turbo roundabouts mainly focuses on comparing safety levels with those of other types of intersection. This is achieved through before-and-after study designs or by making direct comparisons between intersections with different designs in real-world case studies or simulations (Arun et al., 2021). The safety levels of turbo roundabouts are consistently higher than those of conventional two-lane roundabouts, thanks to the reduction in conflict points and driving speed (Kocianova, 2016). Eliminating the dangerous conflict points at the exits from the inner circular lane and removing weaving (lane changing) from the circulatory roadway are particularly effective in ensuring high safety levels. Compared to two-lane roundabouts, crash risk at turbo roundabouts is reduced by about 70% (D. de Baan, 2009; Hansen & Fortuijn, 2006), similar reductions are found for signalised intersections (Skvain et al., 2017; Vos, 2016), conventional single-lane roundabouts and yield-controlled intersections (Vos, 2016). Studies comparing the safety levels of turbo roundabouts and single-lane roundabouts come to different conclusions. For example, D. de Baan (2009) find higher crash risks for turbo roundabouts, whereas Vasconcelos, Silva, and Seco (2013) find similar safety levels. Comparative studies analysing conflicts mainly use the time-based conflict indicators Time-To-Collision (TTC) and Post-Encroachment Time (PET), and also find advantages for turbo roundabouts (Arun et al., 2021). Bulla Cruz, Lyons, and Darghan (2021), in a simulation study, find 72% fewer conflicts at turbo roundabouts compared to conventional two-lane roundabouts, Shetty, Sauciur, and Pande (2025) find less conflicts compared to signalised intersections. Lower speed at turbo roundabouts is one key factor for their higher safety levels, compared to conventional two-lane roundabouts (Leonardi & Distefano, 2023) and to signalised intersections (Shetty et al., 2025). Macioszek and Kurek (2020) investigate the perceived risk and find lower levels at turbo roundabouts compared to conventional two-lane roundabouts.
Very few studies could be identified that analyse more detailed crash constellations and their determinants at turbo roundabouts. Early studies from Germany find that there are more crashes at the entries than at the circulatory roadway and exits, and that right-of-way and rear-end crashes are the most common crash types. However, these studies rely on very small sample sizes, with some studies examining just one turbo roundabout (Brilon & Harding, 2008; Hantschel & Maier, 2013). These findings are in line with those of studies that analyse conventional single-lane or two-lane roundabouts (Bondzio et al., 2012; Schmotz et al., 2020; Spahn & Bäumler, 2007). Křivda et al. (2020) investigate conflicts and behaviour at 100 turbo roundabouts in Europe and identify the following types of conflict as the most relevant: failure to give way, vehicles becoming intertwined, and drivers taking shortcuts.
Studies investigating the determinants of crashes at turbo roundabouts focus on the impact of various types of lane dividers on the circulating roadway. An exception is the study by Vos (2016), which analyse the influence of giving priority to cyclist at crossings and the design of the inner lane at 204 turbo roundabouts in the Netherlands. Turbo roundabouts that give priority to bicyclists are found to have a higher level of safety compared to those where motorized vehicles have right of way. Although not statistically significant, roundabouts with a rectangular inner lane addition at the circulatory roadway also demonstrate a higher level of safety than those with a smoother, curved design. Macioszek (2015) compare turbo roundabouts with physical and solid line marked lane separation, and find a low proportion of crashes with personal injury for both groups (4% and 7%). Not yielding the right-of-way (33% and 40%), rear-end (23% and 29%) and incorrect lane changes (16% and 19%) are the main cause of crashes in both groups. For turbo roundabouts with physical lane dividers, additional crashes due to inappropriate speed to traffic conditions (25%) have a notable share. By analysing the behaviour in turbo roundabouts with physical lane dividers, Chodur and Bąk (2016) conclude, that physical lane dividers are an effective measure to prevent lane changes at the circulatory roadway. Macioszek (2015) and Kieć et al. (2019) report more vehicle side impact crashes with pavement markings as lane dividers compared to physical raised dividers. Smaller radii reduce the likelihood of crashes in several studies investigating turbo roundabouts (Kieć et al., 2019; Porter et al., 2019) and conventional roundabouts (Spahn & Bäumler, 2007). Spahn and Bäumler (2007) investigate conventional roundabouts and find that those with lighting and tangential entries have lower crash rates, while raised kerbs on the inner traffic island lead to higher crash rates.
The literature review shows that there is a good level of knowledge about the general safety levels of turbo roundabouts compared to signalised intersections and conventional roundabouts. Research gaps have been identified with regard to the effects of the specific turbo roundabout characteristics on safety levels and detailed crash constellations, which have only been considered in studies with very small sample sizes thus far. Previous studies are mainly based on descriptive statistics. Model-based approaches, such as regression analysis, have rarely been applied thus far.
The following aims are formulated for this study in order to address these research gaps: (1) to provide an overview of turbo roundabouts in Germany with their specific characteristics, (2) to investigate how different characteristics affect safety levels, and (3) to identify detailed crash constellations and their determinants.
To achieve these aims, we conduct a thorough research on existing turbo roundabouts in Germany, thereby obtaining a largely complete sample. Data on traffic volumes, infrastructure design and operation, and crashes are collected for all sites in the sample. Next, turbo roundabouts are categorised according to their various characteristics. Crash rates are calculated for each category and detailed crash constellations are identified, based on the standardised crash types and detailed narrative crash reports. Finally, crash prediction models are developed to take into account the interdependencies between the various factors that influence crash occurrence. The detailed data enable the analysis at two levels: the turbo roundabout as a whole, and individual elements, including entries, exits and circulatory roadway.
2. Data
2.1. Study sites
In this study, a turbo roundabout is defined as a multi-lane roundabout that has at least one two-lane entry in combination with a lane addition on the inside of the circulatory roadway (2EN-1CR in Table 1). Roundabouts with spiral markings and other roundabouts similar to turbo roundabouts are not included. The turbo roundabouts listed by S. D. L. de Baan (2021) were used as a starting point for the identification of the sites for this study. They were complemented by a systematic online search, which was conducted in 2023 and included e.g. articles in newspapers and information on the websites of public authorities. Overall, 35 turbo roundabouts in operation were identified with this approach in Germany. It can be assumed that this sample covered major parts of turbo roundabouts in Germany at that time. The lanes of the circulatory roadway of the turbo roundabouts in our sample are separated by solid line or dashed line pavement markings. Dashed lines as separation are not in line with the German guidelines for turbo roundabouts (FGSV, 2015), which state that lane changes on the circulatory roadway should at least be prevented by solid line pavement markings. Physical dividers at German turbo roundabouts only exist at a few sites which were opened after 2020 and are not part of the sample for this study.
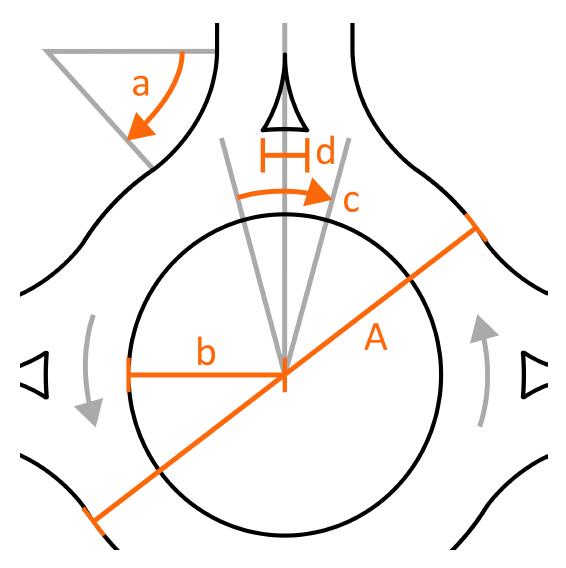
In order to ensure that crash data from a period of five years were available for each site in the sample, only turbo roundabouts were taken into account, that were put into operation before 1 January 2016, and at which crashes involving at least minor property damage were recorded by the police. The resulting final sample comprises 25 turbo roundabouts. Table 2 lists the characteristics collected for each site. Figure 2 visualises the geometric characteristics, which were taken from planning documents and aerial imagery.
| Label | Characteristic | |
|---|---|---|
| For each roundabout | Average daily traffic of motorised vehicles (ADT) for each intersection arm | |
| A | Diameter of the circulatory roadway | |
| Number of intersection arms | ||
| Lanes separation of the circulatory roadway | ||
| Number of roadsides with a sidewalk | ||
| Number of entries with two lanes | ||
| Lighting | ||
| For each entry | Entering ADT | |
| Type of entry (for exit as well) | ||
| a | Right corner radius | |
| b | Deflection by the central island | |
| c | Angle to the exit upstream | |
| Type of the pedestrian crossing | ||
| Shape of the splitter island | ||
| Speed limit | ||
| Factor for environmental use [@503522] | ||
| d | Distance between entry and the corresponding exit | |
| Distance from the first signpost |
Local public authorities provided traffic counts and forecast data for over a third of the turbo roundabout arms. Data from the 2015 nationwide manual road traffic census (BW, 2015; NRW, 2015) were available for 29 different arms. For the other 29 intersection arms, the Average Daily Traffic (ADT) of motorised vehicles was estimated based on the ADT values of nearby road sections from the 2015 census, and considering the road surroundings and the function of the turbo roundabout in this study within the network. ADT values for each entry and exit were estimated based on the assumption of an equal distribution of the overall ADT at the roundabout across all arms. For the entries and exits parallel to bypasses, the ADT was reduced by a third for four-arm and by half for three-arm turbo roundabouts.
Cyclists, pedestrians and scooter riders were categorised as Vulnerable Road Users (VRUs). As a proxy for VRU volumes, the “factor for environmental use” was calculated based on the method proposed and validated by Schüller (2009). This factor considers the length and type of roadside development on both sides of the road and is calculated as:
where is the factor for environmental use, is the length of the roadside considered (in m), and is the length of all buildings facing the road (in m) in (1). The land use categories residential retail mixed residential and retail and other commercial are used as indices for For each intersection arm, a total roadside length of 200 meters was considered, corresponding to 100 meters along each side of the roadway.
The number of roadsides with a sidewalk refers to the two roadsides of each arm of the turbo roundabout. Thus, a turbo roundabout with four arms can have a maximum of eight roadsides with sidewalks. No distinction was made regarding sidewalk width, distance from the roadway, the presence of bicycle traffic, or the availability of nearby bicycle facilities.
2.2. Crash data
Crash data were provided by local authorities for the years 2016 to 2020, including geolocation, crash severity, crash type, collision partners and a narrative report of the course of each crash. The data include crashes with injuries as well as crashes with major and minor property damage.
All crashes within the outer edge of the roundabout and in the next 50 m sections were taken into account to ensure that the crashes were related to the corresponding turbo roundabout and that roundabouts with different geometries were comparable. Only crashes classified by the police as loss-of-control, turning, right-of-way, pedestrian crossing, or longitudinal crashes were considered. Parking crashes, crashes involving wildlife, and crashes caused by technical failures accounted for 3.5% of all cases and were excluded from the analysis, as they are typically not related to the design or operational characteristics of the roundabouts.
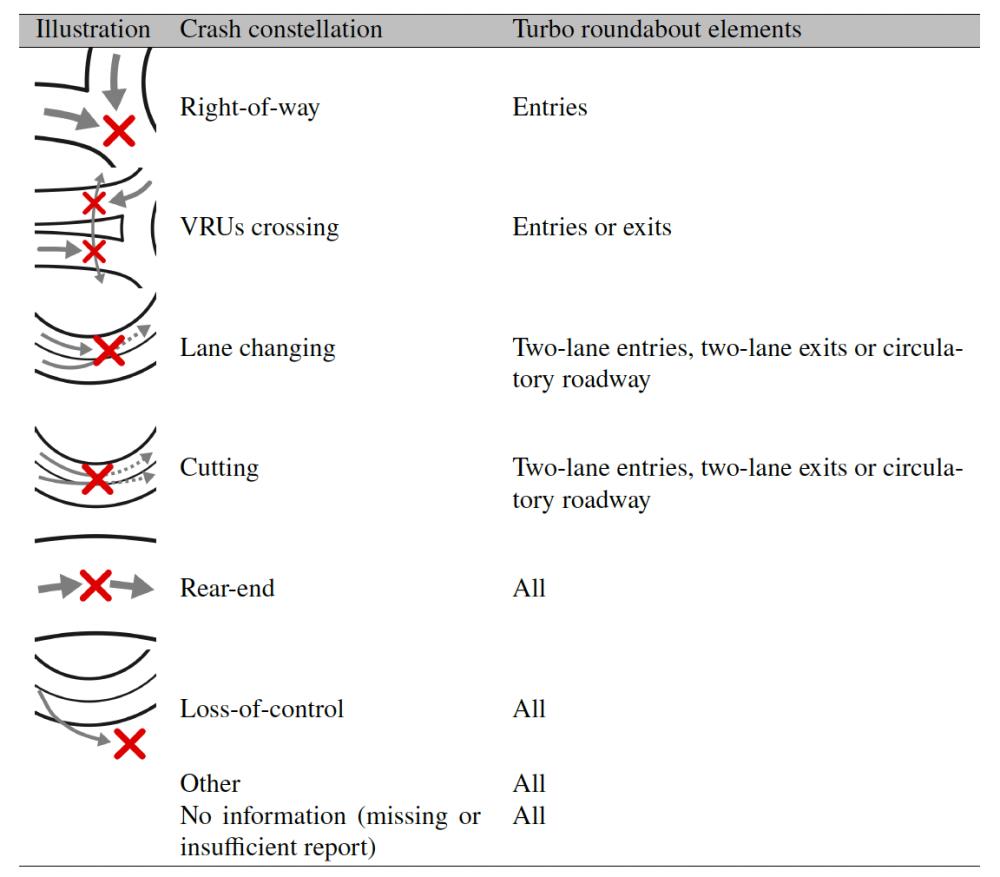
In order to gain more detailed insights, the narrative report and the geolocation were analysed for a total of 1 013 crashes in terms of the crash constellation and the associated turbo roundabout element as defined in Table 3. The classification of crashes is summarised in the same table. Crashes were assigned to the corresponding entry, exit, circulatory roadway or bypass whenever possible. Some crashes could not be assigned to any of the crash constellations defined in Table 3, even though the narrative crash report was complete. Those crashes, which were grouped as ‘Other’, often had contradictory information in the narrative report.
3. Methods
A three-step approach involving several methods was chosen for the analysis. In the first step, crash rates were calculated for each roundabout and its entries and exits, based on the volume of motorised vehicles at each site. To avoid potential biases caused by lower exposure during the COVID-19 pandemic, only crashes from 2016 to 2019 were considered in this step, resulting in 842 crashes. Pearson correlation matrices were computed for the characteristics of each roundabout and its entries to determine interdependencies between the various characteristics and to assess whether the observed effects of individual variables could possibly be attributed to their relationship with other features. Only significant correlations with coefficients above 0.3 or below -0.3 were taken into account.
In the second step, detailed crash constellations as defined in Table 3 were computed to gain a deeper understanding of crash patterns at the different elements of the turbo roundabouts and the factors that determine them in terms of infrastructure and operation. We tested the relevance of the COVID-19 pandemic for this analysis by comparing the proportions of crash types for all roundabouts in Saxony, Saxony-Anhalt and Hesse in the years 2016 to 2020. We found no significant effect of the lower exposure in 2020 on the distribution of crash types and therefore included crashes from 2020 in this second step, resulting in a total of 1 013 crashes.
In the third step, crash prediction models were developed for entries, as this element got identified as the most relevant in terms of crash numbers. Models were computed for all crashes, as well as for the two most common crash constellations, right-of-way and rear-end, as defined in Table 3. The modelling procedure followed a stepwise approach, starting with an intercept-only model, followed by the addition of exposure variables, and concluding with a full model incorporating all relevant parameters. Initially, poisson regression was applied to assess the individual explanatory power and statistical significance of each variable. To address overdispersion commonly observed in crash count data, final parameter estimation was carried out using negative binomial regression. Only variables with coefficients statistically significant at the 10% level and not highly correlated with each other were included in the final model specification. Correlations between the variables were assessed using the Pearson correlation matrix modelled in step one.
4. Results
4.1. General characteristics of the turbo roundabouts and crash risk
The 25 turbo roundabouts in our sample vary in their infrastructural and operational characteristics. The smallest turbo roundabout has an outer diameter of the circulatory roadway of 31 m, while the largest has an outer diameter of 80 m. The arrangement and number of the various entry and exit types (see Table 1), as well as the number of bypasses, are almost unique for each turbo roundabout. The surroundings of the 25 turbo roundabouts range from rural to urban.
Regarding the crossing facilities for VRUs, there is at least one at-grade crossing at 12 turbo roundabouts and one grade-separated crossing at 6 turbo roundabouts. At-grade crossings always include a refuge island between the entry and exit roadway. One roundabout gives priority to VRUs at at-grade crossings on all the exits and entries, including those with two lanes. At this roundabout, refuge islands are not only located between entry and exit roadways, but also between the individual lanes of two-lane entries and exits. Next to the differences in crossings for VRUs and diameter, there are notable differences in traffic volume, road marking, and the number of intersection arms between the turbo roundabouts.
Table 4 displays the distributions of different characteristics of the turbo roundabouts in our sample along with the corresponding crash rates, where stands for the number of sites of the category. Table 5 shows the Pearson correlation matrix for the characteristics. The crash rates at the turbo roundabouts in our sample range from 0.19 to 2.36 crashes per one million motorised vehicles (crashes/mot) with a variance of crashes/mot On average, there is one crash/mot at the turbo roundabouts. Turbo roundabouts with three to five roadsides featuring sidewalks exhibit an average crash rate of 0.74 crashes/mot, which is lower than that of turbo roundabouts with fewer than three (1,01 crashes/mot) or more than five such roadsides (1.09 crashes/mot). Only a small difference in average crash rates is observed between turbo roundabouts with three arms (1.13 crashes/mot) and those with four arms (0.92 crashes/mot). Turbo roundabouts with diameters greater than 65 m show a noticeably lower crash rate (0.82 crashes/mot) compared to those with smaller diameters (1.03 and 1.01 crashes/mot). Moreover, turbo roundabouts featuring dashed lane separation markings exhibit a substantially lower average crash rate (0.66 crashes/mot) compared to those with single solid line markings (1.04) and double solid line (1.55 crashes/mot).
Turbo roundabouts with an average daily traffic (ADT) of 26 000 motorised vehicles or more exhibit a higher average crash rate (1.23 crashes/mot) compared to those with lower traffic volumes (0.88 and 0.77 crashes/mot). This crash rate of 1.23 crashes/mot is only slightly below the maximum values observed among turbo roundabouts with lower ADT (1.32 crashes/mot).
Furthermore, an increasing number of two-lane entries appears to come along with higher crash rates. The only exception is a single turbo roundabout with four two-lane entries, which shows a comparatively low crash rate (0.55 crashes/mot) and may represent a special case. In addition, turbo roundabouts equipped with roadway lighting, which is more commonly implemented, tend to have higher crash rates (1.06 crashes/mot) than those without lighting (0.81 crashes/mot).
A statistically significant negative correlation is observed between the number of roadsides with a sidewalk and both the diameter (r = -0.45, p < 0.05) and the Entries with two lanes (r = -0.36, p < 0.05). In contrast, a positive correlation is found between the number of roadsides with a sidewalk and lighting (r = 0.51, p < 0.05).
The Diameter is positively correlated with the ADT (r = 0.46, p < 0.05), while showing a negative correlation with lighting (r = -0.37, p < 0.05).
The Number of Entries with two lanes shows a significant positive correlation with the presence of a single solid line separation (r = 0.52, p < 0.01) and a significant negative correlation with dashed line separation (r = -0.48, p < 0.05).
| Characteristic | Category | Crash rate [crashes mot] |
|||
|---|---|---|---|---|---|
| Min | Mean | Max | |||
| All | 25 | 0.19 | 0.98 | 2.36 | |
| ADT [mot/24h] | < 19 000 | 9 | 0.19 | 0.77 | 1.28 |
| >= 19 000; < 26 000 | 6 | 0.55 | 0.88 | 1.32 | |
| >= 26 000 | 10 | 0.35 | 1.23 | 2.36 | |
| Diameter of the circulatory roadway | < 50 m | 12 | 0.19 | 1.01 | 2.36 |
| > = 50 m; < 65 m | 8 | 0.30 | 1.04 | 2.30 | |
| > = 65 m | 5 | 0.35 | 0.82 | 1.23 | |
| Number of intersection arms | 3 | 7 | 0.43 | 1.13 | 2.30 |
| 4 | 18 | 0.19 | 0.92 | 2.36 | |
| Lane separation of the circulatory roadway | Double solid line | 4 | 0.70 | 1.55 | 2.36 |
| Single solid line | 9 | 0.55 | 1.04 | 1.65 | |
| Dashed line | 7 | 0.19 | 0.66 | 1.06 | |
| Number of roadsides with a sidewalk | < 3 roadsides | 13 | 0.19 | 1.01 | 2.30 |
| >= 3; < 6 roadsides | 5 | 0.30 | 0.74 | 1.65 | |
| >= 6 roadsides | 7 | 0.56 | 1.09 | 2.36 | |
| Number of entries with two lanes | 1 | 7 | 0.19 | 0.71 | 1.28 |
| 2 | 10 | 0.30 | 1.11 | 2.36 | |
| 3 | 7 | 0.43 | 1.13 | 2.30 | |
| 4 | 1 | 0.55 | 0.55 | 0.55 | |
| Lighting | Yes | 17 | 0.30 | 1.06 | 2.36 |
| No | 8 | 0.19 | 0.81 | 1.32 | |
| Diameter | Arms | Single solid line lane separation | Dashed line lane separation | Double solid line lane separation | Roadsides with a sidewalk | Entries with two lanes | Lighting | |
|---|---|---|---|---|---|---|---|---|
| ADT | 0.46* | - | - | - | - | - | - | 0.31 |
| Diameter | - | - | - | - | -0.45* | - | -0.37 | |
| Arms | - | - | - | - | - | - | ||
| Single solid line lane separation | -0.47* | -0.33 | - | 0.52** | - | |||
| Dashed line lane separation | - | - | -0.48* | - | ||||
| Double solid line lane separation | - | - | - | |||||
| Roadsides with a sidewalk | -0.36 | 0.51** | ||||||
| Entries with two lanes | - |
Table 6 and Table 7 presents the number of observations and average crash rates for the entries and exits as classified in Table 1, as well as for the different entry characteristics. stands for the number of entries of the category. Table 8 shows the Pearson correlation matrix for the entry characteristics. Crash rates are significantly lower at exits than at entries, regardless of the configuration. With regard to entry types, 2EN-2CR has the highest crash rate (1.08 crashes/mot). 2EN-1CR (0.83 crashes/mot) and 1EN-2CR (0.70 crashes/mot) show comparatively lower crash rates; however, the likelihood of a crash remains higher for these entry types than for 1EN-1CR (0.50 crashes/mot), which represents the entry design of conventional roundabout. The inner lane addition at the circulatory roadway of 1EN-1CR is always smooth, in contrast to the rectangular inner lane addition also commonly found in the Netherlands (Vos, 2016). Only minor differences in the mean crash rates are found for the different categories of the variables right corner radius, angle to the exit upstream and types of pedestrian crossing.
Notable differences are found between the different types of exits. 1EX-1CR-split exhibits the highest crash rate with 0.13 crashes/mot. In contrast, 2EX-1CR, the typical two-lane exit design used in turbo roundabouts, shows the lowest average crash rate with 0.08 crashes/mot.
A statistically significant positive correlation exists between the entry type 2EN-1CR and the ADT (r = 0.65, p < 0.001), the right corner radius (r = 0.32, p < 0.01), and the angle to the exit upstream (r = 0.41, p < 0.001). The entry type 1EN-2CR is positively correlated with the right-of-way for motorised vehicles at at-grad crossings (r = 0.34, p < 0.01), while the entry type 2EN-2CR shows a positive correlation with the angle to the exit upstream (r = 0.49, p < 0.001).
Among the geometric and operational characteristics, a significant correlation is found between deflection by the central island and the presence of a curved splitter island (r = 0.32, p < 0.01), as well as the factor for environmental use (r = -0.37, p < 0.001) and the distance between entry and exit (r = 0.52, p < 0.001).
Further, the angle to the exit upstream is significantly correlated with the factor for environmental use (r = 0.52, p < 0.001). Non-at-grade crossings also show a correlation with the factor for environmental use (r = 0.46, p < 0.001).
| Characteristic | Category | Crash rate [crashes / 106mot] | |||
|---|---|---|---|---|---|
| Mean | |||||
| Type | 2EN-1CR | 42 | 0.29 | 0.83 | 1.30 |
| 1EN-1CR | 14 | 0 | 0.50 | 1.08 | |
| 1EN-2CR | 25 | 0 | 0.70 | 1.53 | |
| 2EN-2CR | 10 | 0.20 | 1.08 | 2.36 | |
| ADT [mot/34h] | < 4 000 | 33 | 0 | 0.85 | 1.72 |
| >= 4 000; < 8 000 | 39 | 0.18 | 0.64 | 1.08 | |
| >= 8 000 | 21 | 0.29 | 0.88 | 1.91 | |
| Right corner radius | < 14 m | 22 | 0.02 | 0.83 | 1.70 |
| > = 14 m; < 20 m | 34 | 0 | 0.79 | 1.65 | |
| > = 20 m | 35 | 0.29 | 0.75 | 1.14 | |
| Deflection by the central island | > 10 m | 21 | 0.27 | 0.85 | 1.71 |
| > = 10 m; < 20 m | 47 | 0.06 | 0.83 | 1.40 | |
| > = 20 m | 24 | 0 | 0.61 | 1.15 | |
| Angle to the exit upstream | > 30° | 24 | 0 | 0.74 | 1.56 |
| > = 30°; < 45° | 38 | 0 | 0.76 | 1.28 | |
| > = 45° | 31 | 0.32 | 0.80 | 1.25 | |
| Type of the pedestrian crossing | Non-priority crossing | 14 | 0.07 | 0.79 | 1.65 |
| Right-of-way VRUs | 10 | 0 | 0.81 | 1.86 | |
| No at-grade crossing | 61 | 0.14 | 0.75 | 1.18 | |
| Shape of the splitter island | curved | 43 | 0.15 | 0.68 | 1.16 |
| straight | 47 | 0.06 | 0.85 | 1.71 | |
| Speed limit | < 50 km/h | 12 | 0 | 0.71 | 1.67 |
| > = 50 km/h; < 60 km/h | 68 | 0.21 | 0.81 | 1.43 | |
| > = 60 km/h | 13 | 0 | 0.61 | 1.02 | |
| Factor for environmental use | < 0.1 | 52 | 0.14 | 0.72 | 1.18 |
| >= 0.1; < 0.9 | 18 | 0 | 0.64 | 1.56 | |
| >= 0.9 | 23 | 0.27 | 0.98 | 1.75 | |
| Distance between entry and exit | < 6 m | 38 | 0.10 | 0.93 | 1.81 |
| > = 6 m; < 10 m | 15 | 0.28 | 0.73 | 1.31 | |
| > = 10 m | 34 | 0 | 0.60 | 1.01 | |
| Distance from the first signpost | < 40 m | 23 | 0.02 | 0.68 | 1.11 |
| >= 40 m; < 100 m | 32 | 0.25 | 0.76 | 1.23 | |
| > = 100 m | 32 | 0.08 | 0.80 | 1.82 | |
| Characteristic | Category | Crash rate [crashes / 106mot] | |||
|---|---|---|---|---|---|
| Mean | |||||
| Type | 2EX-1CR | 21 | 0 | 0.08 | 0.16 |
| 1EX-1CR-conv | 13 | 0 | 0.10 | 0.19 | |
| 1EX-2CR | 35 | 0 | 0.12 | 0.14 | |
| 1EX-1CR-split | 23 | 0 | 0.13 | 0.26 | |
| 1EN-1CR | 1EN-2CR | 2EN-2CR | ADT | Right corner radius | Deflection by the central island | Angle to the exit upstream | ||
|---|---|---|---|---|---|---|---|---|
| 2EN-1CR | -0.38*** | -0.55*** | -0.31** | 0.65*** | 0.32** | - | 0.41*** | |
| 1EN-1CR | - | - | - | - | - | - | ||
| 1EN-2CR | - | -0.49*** | - | - | -0.43*** | |||
| 2EN-2CR | - | - | - | - | ||||
| ADT | - | - | - | |||||
| Right corner radius | - | - | ||||||
| Deflection by the central island | - | |||||||
| Non-priority crossing | Priority crossing | No at-grade crossing | Curved splitter island | Speed limit | Factor for environmental use | Distance between entry and exit | Distance from the first signpost | |
| 2EN-1CR | -0.38*** | - | - | - | - | - | - | - |
| 1EN-1CR | - | 0.34*** | - | - | - | - | - | - |
| 1EN-2CR | 0.49*** | - | - | - | - | - | - | -0.35*** |
| 2EN-2CR | - | - | - | - | - | - | - | - |
| ADT | - | - | - | - | - | - | - | 0.37*** |
| Right corner radius | - | - | - | - | - | - | 0.30** | - |
| Deflection by the central island | - | - | - | 0.32** | - | -0.37*** | 0.52*** | - |
| Angle to the exit upstream | -0.32** | - | - | - | - | - | 0.52*** | - |
| Non-priority crossing | - | -0.58*** | - | - | 0.46*** | - | - | |
| Priority crossing | -0.48*** | - | - | - | - | - | ||
| No at-grade crossing | - | - | -0.39*** | - | - | |||
| Curved splitter island | - | - | 0.60*** | - | ||||
| Speed limit | - | - | - | |||||
| Factor for environmental use | -0.43*** | - | ||||||
| Distance between entry and exit | - |
4.2. Detailed crash patterns
Figure 3 shows the distribution of crash constellations leading to crashes for turbo roundabouts with different characteristics in our sample, where stands for the number of crashes and for the number of sites. Regardless of the design of the turbo roundabout, right-of-way (between entering vehicles and vehicles) is the most common crash constellation (42% to 58%). At turbo roundabouts with more than five roadsides with sidewalks and those with a diameter greater than 65 m, the proportion of this crash constellation is highest. Crash constellations with crossing VRUs have a share of 11% at turbo roundabouts with three to five roadsides with sidewalks. This proportion is lower for turbo roundabouts with more than five roadsides with sidewalks. At turbo roundabouts with less than three roadsides, crash constellations with crossing VRUs are rare. It is also low at turbo roundabouts with three arms.
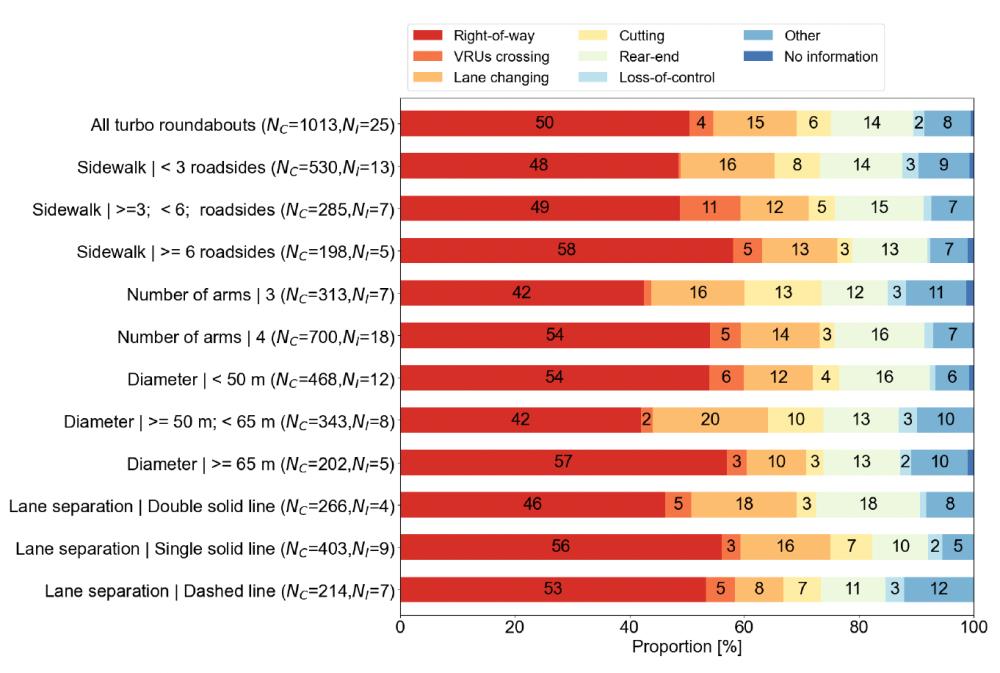
The proportion of lane changing crash constellations ranges from 8% to 20%. Compared to lane changing, cutting crash constellations show a lower share in each case. At turbo roundabouts with a diameter between 50 m and 65 m, the proportion of lane changing as well as cutting crash constellations is significantly higher compared to diameters smaller 50 m or greater 65 m. The proportion of cutting crash constellations is significantly higher at turbo roundabouts at three-arm turbo roundabouts compared to those with four arms. While turbo roundabouts with double solid lines as lane separation have a higher share of lane changing crash constellations in comparison to those with single solid lines and especially those with dashed lines, only a small proportion of 3% are cutting crash constellations. More than one in ten crashes is a rear-end crash. The proportion is particularly high at turbo roundabouts with a double solid line as lane separation. Loss-of-control crashes are rare at turbo roundabouts, regardless of the expression of the four different characteristics. 5% to 12% of the crashes could not be assigned to any of the six crash constellations.
Figure 4 shows the crash constellations for the specific elements of the turbo roundabouts, including exits, the circulatory roadway and entries. stands again for the number of crashes and for the number of entries, exits, or circulatory roadways. The proportions of the crash constellations at the exits are distributed quite evenly, with the highest shares of VRUs crossing, lane changing, rear-end and other. Half of all crashes on the circulatory roadway are of the type lane changing, followed by cutting crashes with 19%. With around 70% of all lane changing or cutting crash constellations at turbo roundabouts, the circulatory roadway is also the most significant source of crashes for this crash constellations in absolute terms. A qualitative analysis of the narrative crash reports reveals that approximately 50% of these cutting crashes are caused by drivers selecting the wrong entry lane when entering the turbo roundabout. For a further 35%, this cause cannot be ruled out. In relation to the total number of crashes at all turbo roundabouts, such incidents account for 5% to 9%.
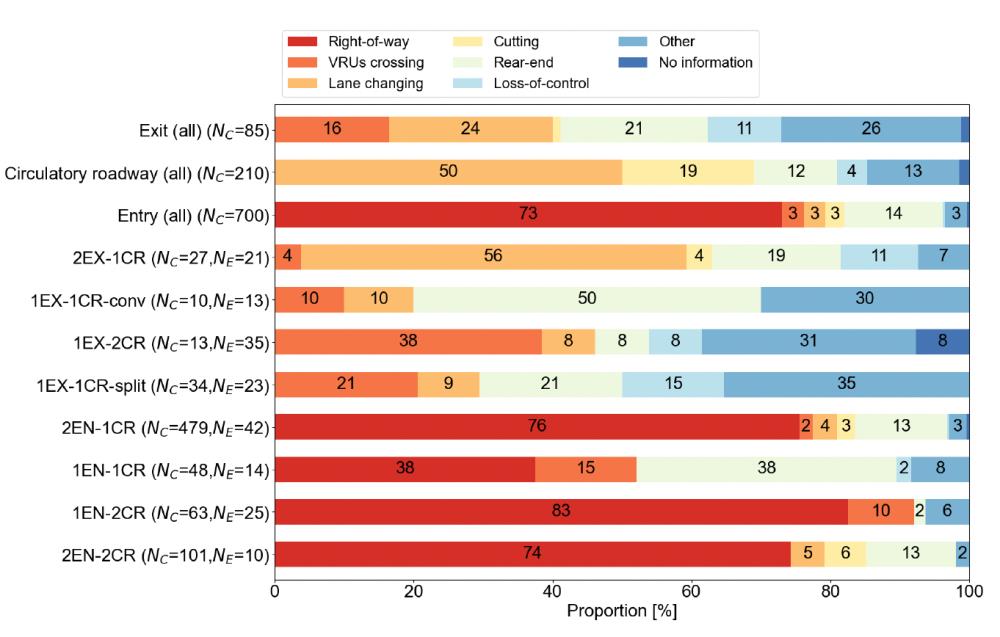
By definition, right-of-way crash constellations are observed exclusively at the entries. Overall, they account for 73% of all entry-related crashes. This high share of right-of-way crashes at the entries dominates also the entire sample as shown in Figure 3, because of the high number of 700 crashes at the entries, compared to 210 at the circulatory roadway and 85 at the exits. Among the different entry types, 1EN-2CR shows the highest share of right-of-way crashes with 83%, whereas 2EN-1CR shows the lowest proportion of only 38%. Rear-end crashes represent the second most frequent crash constellation at the entries, comprising 14% of crashes. Regarding the entry types, 1EN-1CR entries show a substantially higher proportion of rear-end crashes (38%) compared to 1EN-2CR (2%).
Furthermore, the proportion of VRUs crossing crash constellations is significantly higher at the single-lane entry types 1EN-1CR and 1EN-2CR than at the two-lane entries 2EN-1CR and 2EN-2CR. Looking at the distribution of all crash constellations, patterns are very similar for entries of the types 2EN-1CR and 2EN-2CR, with significant differences to the single-lane entries (1EN-1CR, 1EN-2CR). Both, lane changing and cutting crashes occur at the two-lane entry types 2EN-1CR and 2EN-2CR, but only with a combined share of 7% and 11%. The distribution of the crash constellations differ greatly for the different exit types. These distributions are more difficult to interpret than for the entries because of the lower number of crashes and because of the higher share of the constellation of other crashes. The high share of lane changing crashes (56%) at the exits of type 2EX-1CR, rear-end at 1EX-1CR (50%) and of VRUs crossing at 1EX-2CR (38%) stand out.
As can be seen from the definition of crash constellations in Table 3, crossing VRUs crash constellations are predominantly associated with the direct involvement of VRUs. It is worth mentioning, however, that in 25% of these crash constellations, no cyclists or pedestrians are listed as participants in the narrative crash report. Their involvement is only apparent from the text describing the circumstances of the crash. These are predominantly rear-end collisions in moving traffic resulting from a braking manoeuvre due to crossing VRUs. In the other crash constellations, cyclists and pedestrians are rarely involved. Nevertheless, 3% of crashes between cyclists and motorised vehicles are cutting and right-of-way crash constellations.
4.3. Crash prediction models for entries of the turbo roundabouts
Crash models are computed for the entries as the most relevant elements in terms of crash numbers, for all crashes involving only motorised vehicles, and for the two most relevant crash constellations right-of-way and rear-end. Table 9 provides an overview of the model outcomes. All three crash models show the significantly positive influence of the natural logarithmic entering ADT. Crashes involving only motorised vehicles have a higher likelihood of crashes with an higher number of entries. In contrast, a larger right corner radius of the entry and one entry lane with no bypass have a crash-reducing effect. For right-of-way crashes, the right corner radius and the entry type 1EN-1CR get significant, and for rear-end crashes the distance between entry and exit and the entry type 2EN-2CR. The right corner radius of the entry is the only parameter that gets significant in more than one model.
| Parameter | All crashes involving only motorised vehicles | Right-of-way crash constellations | Rear-end crash constellations |
|---|---|---|---|
| Regression Parameter | |||
| Intercept | -11.610*** | -9.480*** | -18.180*** |
| 0.953*** | 0.875*** | 1.719*** | |
| Right corner radius | -0.032 ** | -0.020 | |
| Distance between entry and the corresponding exit | -0.100 *** | ||
| One entry lane with no bypass | -0.842 ** | ||
| Number of entries of the turbo roundabout | 0.552 * | ||
| 1EN-1CR | -1.623*** | ||
| 2EN-2CR | 0.956 *** | ||
5. Discussion
The analysis shows a high diversity in the German turbo roundabouts in our sample. The categories are evenly distributed for most characteristics of the roundabouts, and few correlations could be found between the variables. It seems like each roundabout is a unique one, and that design characteristics are tailored to the specific local requirements. This diversity is probably due to the fact that, prior to the publication of the official guidelines in 2015 (FGSV, 2015), there were no clear recommendations for the design and scope of application of turbo roundabouts in Germany. The picture becomes more nuanced when the individual entries and exits are examined.
As a general tendency, crash rates increase with increasing complexity of the turbo roundabouts and their elements. Traffic volumes are particularly relevant, crash rates at turbo roundabouts with an ADT of >= 26 000 are significantly higher than with lower ADT values. The same holds for pedestrian and cyclist volumes which are considered in this study via the proxy variable “factor for environmental use”. Significantly higher crash rates are found for sites with a higher factor for environmental use of >= 0.9. Crash rates for the “smallest” entry type 1EN-1CR are lowest, they increase with each added lane in the entry and the circulatory roadway, and are highest for the most complex entry type 2EN-2CR. This negative effect of entry complexity on safety is consistent with previous studies (see e.g. Novák et al., 2018). Crash rates at the exits are generally low and all in the same order of magnitude.
The diameter of the roundabout and related variables are particularly interesting. Crash rates are lowest for turbo roundabouts with a diameter of >= 65m, for entries with a deflection by the central island of >= 20m, and for higher distances between entry and exit of >= 10m. Higher diameters of roundabouts tend to increase the speed in the circulatory roadway with adverse effects for safety (Spahn & Bäumler, 2007). At the same time, higher diameters mean a higher deflection by the the central island for approaching vehicles. This supports a reduction of the approaching and entering speed (Hydén & Várhelyi, 2000) and therefore can result in a higher safety level (Al-Marafi et al., 2020; Kim & Choi, 2013). In the balance of these two contrary effects, the positive effects of higher dimensions and deflection outweigh the negative effects in our sample.
Crash rates are higher for turbo roundabouts equipped with lighting, despite the generally well-established positive effect of lighting on safety levels (Elvik, 1995). These results may be attributed to complex interactions between various design features, although few significant correlations could be identified in the data. Furthermore, the lack of detailed information on lighting, such as whether it is in operation throughout the night, its intensity, or whether it covers the approaches, represents a limitation of the analysis.
By definition, right-of-way crashes can only occur at the entries, but they are most relevant for all different types of turbo roundabouts in our sample, regardless of which variable is chosen to categorise the sites. The high share of crashes at the entries is the main reason for this, it has also been found in previous studies investigating roundabouts in general (Mandavilli et al., 2009; Spacek, 2004). The distribution of crash constellations at turbo roundabouts with solid line markings differ from the finding by (Macioszek, 2015); the share of right-of-way crashes are 16% higher, whereas the share of rear-end crashes are 19% lower.
Differences in the proportions of right-of-way crashes at the different entry types show that their design matters, the share is lowest at entries of type 1EN-1CR, which is the “smallest design” and highest for 1EN-2CR, which is more complex. Drivers need to cross the outer lane to get to the inner lane at this entry type.
Lane changing and cutting are the most relevant constellations in the circulatory roadway, independent from the type of lane separation. We need to consider that all of the roundabouts in our sample have marked lane dividers in the form of dashed, single solid and double solid lines; there are no raised dividers. The results of our analysis suggest that drivers do not respect single or double solid lines, resulting in similar crash constellations and rates for all types of markings.
The proportions of crash constellations at the exits are evenly distributed, but different patterns are found for the exit types. The proportion of lane changing crashes is particularly high at exits of type 2EX-1CR and lower at exits of type 1EX-1CR-split. Complexity of the infrastructure seems not only to have an effect on crash rates but also on the distribution of the different crash constellations. No clear patterns could be found for the proportion of crashes with crossing VRUs, this crash constellation just seems to “appear” when VRUs are present. Rear-end crashes have also high proportions, which are highest at the entry type 1EN-1CR. This suggests that crashes at this smallest entry type are being displaced from the roundabout onto the access road. This effect may be more pronounced during periods of high traffic volume.
The crash prediction models for entries confirm the findings from the descriptive analysis. Traffic volumes have a significant effect on crash numbers for all crashes and also the two constellations right-of-way and rear-end. Coefficients are slightly below or, for rear-end crashes above one, which means that there is no safety-in-numbers effect in our sample. Greater distances between the entry and exit reduce the likelihood of crashes, which confirms the descriptive analysis; deflecting drivers seems to be more important than the size of a roundabout for achieving high safety levels. Similarly, larger right corner radii reduce the likelihood of crashes which comes somewhat unexpected, but has also been observed at roundabouts in general (Al-Marafi et al., 2020). Larger corner radii typically reduce vehicle deflection by the central island, potentially allowing higher speed in the approach and entry and, as the consequence, might increase crash risks. One possible explanation for our counter-intuitive result could be that a larger corner radius improves the visibility of oncoming traffic on the circulatory roadway, which may help drivers to better assess gaps in traffic and enter more safely. The other significant variables (one lane with no bypass, number of entries at the roundabout, entry type) are linked to the overall complexity of the roundabout and confirm the descriptive findings that higher complexity of a roundabout increases the likelihood of crashes.
6. Conclusions and outlook to further research
This study uses a largely complete sample of turbo roundabouts in Germany to investigate detailed crash patterns in terms of location at the different roundabout elements and crash constellation. The analysis shows that driving properly through a turbo roundabout is a complex task for drivers. Ideally, turbo roundabouts should be simple in terms of their size, entry types, additional infrastructure characteristics and low traffic volumes. For higher traffic volumes, which need larger and more complex designs, drivers need clear guidance and support to achieve high safety levels. The current German guidelines on turbo roundabouts (FGSV, 2015) allow for multiple and very different individual turbo roundabout designs, a higher degree of standardisation might support higher safety levels. Similar to findings from previous studies investigating roundabouts (Mandavilli et al., 2009; Spacek, 2004), the entries are most critical in terms of crashes also in this study. The early and intuitive guidance of drivers to the correct lane when entering the turbo roundabout should get highest emphasis to reduce all types of crash constellations, and specifically right-of-way, lane changing and cutting crashes. Fish hook pavement markings and corresponding arrows on the signposts in the approach can support drivers, these markings are not common in Germany thus far. Reduced maximum allowed speed and clear sight lines can be also assumed to increase safety levels. VRUs increase complexity, locations with low VRUs volumes are preferable for turbo roundabouts in general, and particularly when the motorised traffic volumes are high. The effect of VRUs volumes was assessed in this study based on the proxy variable “factor for environmental use”, future studies with detailed data on the volumes of pedestrians, cyclists and micro-mobility users would be helpful to better understand these effects.
In terms of infrastructure characteristics, previous studies have paid particular attention to lane dividers. This study finds no significant differences between the various types of pavement marking on the circulatory roadway. Future studies comparing marked and physical dividers would be helpful. Deflection increases safety levels and can be measured using various variables. Both should definitely be considered in the future design guidelines for roundabouts. Standardisation can be also assumed to increase safety levels, when drivers use the turbo roundabout more intuitively, just because of their experience from driving through other turbo roundabouts with similar designs. While standardisation at the level of roundabouts as a whole may be difficult, it is feasible and necessary at the level of individual elements, including entries, exits, and the circulatory roadway. Our sample points to this direction: there is far greater diversity at the level of roundabouts than at the level of individual elements.
Future international studies investigating detailed crash patterns at the level of individual turbo roundabout elements, as examined in this study, would allow for comparisons to be made and demonstrate the transferability of this study’s results. A deeper understanding of the mechanisms that influence safety could be achieved by supplementing crash research with studies on conflicts and safety perceptions, at the level of individual turbo roundabout elements and involving large samples. Our sample is with 25 turbo roundabouts small but largely complete for Germany. We could only compute crash prediction models for the entries, too many exits had no crashes at all. However, the three regression models computed in this study provide valuable insights into the effect of traffic volumes and infrastructure characteristics on crash numbers. To the best of our knowledge, this is the first study to go beyond descriptive statistics and focus on entries rather than turbo roundabouts as a whole. Future studies that compute similar crash prediction models would be valuable in helping to deepen our knowledge of the significance of the different effects. Including additional characteristics such as sight distances, surveyability, lane arrow pavement markings, and directional signage could help identify further parameters affecting safety levels. Further analyses of crashes with crossing pedestrians or cyclists would be also valuable but would need higher sample sizes and detailed exposure data.
Overall, this study confirms earlier research findings that turbo roundabouts effectively combine high capacity with high safety levels. The detailed analysis of crash patterns in this study enables specific recommendations to be made for improving safety even further and exploiting this potential more effectively.
CRediT contribution
Armin Kollascheck: Conceptualisation, Data curation, Formal analysis, Investigation, Methodology, Software, Visualisation, Writing—original draft, Writing—review & editing; Martin Bärwolff: Conceptualisation, Data curation, Formal analysis, Investigation, Methodology, Project administration, Software, Writing—original draft; Julian Schmitz: Conceptualisation, Data curation, Formal analysis, Visualization, Writing—original draft; Justin Geistefeldt: Conceptualisation, Supervision, Writing—original draft, Writing—review & editing; Sebastian Hantschel: Supervision, Writing—review & editing; Regine Gerike: Conceptualisation, Supervision, Writing-original draft, Writing—review & editing
Data availability
The crash data is not available due to restrictions by the providing authorities.
Declaration of competing interests
The authors report no competing interests.
Ethics statement
This study did not involve any human or animal subjects, nor did it use any sensitive or personally identifiable data. Therefore, ethical approval was not required.
Funding
This report is based on parts of the research project carried out at the request of the Federal Ministry for Transport, represented by the Federal Highway and Transport Research Institute, under research project No. 02.0397/2016/FRB. The author is solely responsible for the content.
Declaration of generative AI use in writing
The authors declare that no generative AI was used in this work.
Editorial information
Handling editor: Haneen Farah, Delft University of Technology, the Netherlands.
Reviewers: Mariusz Kiec, Cracow University of Technology, Poland; Maria Salomons, Delft University of Technology, the Netherlands.
Submitted: 4 June 2025; Accepted: 30 September 2025; Published: 7 November 2025.