Using Crowdsourced Data to Assess Safety in Developing Countries: The Case Study of Eastern Cairo, Egypt
Abstract
Crowdsourced data refers to data that is collected and shared by a large number of individuals or organizations, often through the use of digital technologies such as mobile devices and social media. The shortage in crash data collection in developing countries makes it difficult to fully understand and address road safety issues in these regions. In developing countries, crowdsourced data can be a valuable tool for collecting crash data and improving road safety, particularly in urban areas where the majority of road crashes occur. This study is the first to develop safety performance functions using crowdsourced data by adopting a Negative Binomial structure model and Full Bayes (FB) model to investigate traffic safety for urban road networks and provide insights into the impact of roadway characteristics. Furthermore, as a part of the safety management process, network screening has been undergone through applying two different methods to rank the most hazardous road segments: Potential Collision Reduction (PCR) method (adopted in the Highway Safety Manual (HSM)) as well as a graphical method using GIS tools to compare and validate. The analysis revealed that segment length, number of lanes, and pedestrian density were significant factors positively associated with crash frequency. FB models with spatial correlation showed better performance in terms of logic and model fit compared to traditional models. The analysis found that both PCR and GIS-based kriging methods effectively identified hazardous segments, with kriging using summation criteria providing more consistent results when validated against PCR outcomes. Recommendations were proposed to improve pedestrian behavior, and control access points and U-turns, based on the observed impact on safety. Lastly, recommendations were suggested for policymakers to ensure safer roads and limitations regarding data coverage and the need for complementary official crash data were highlighted to guide future research.
1. Introduction
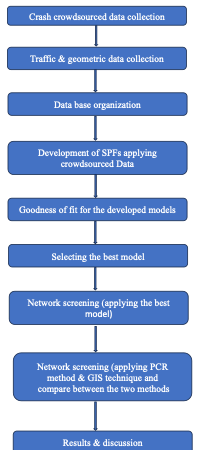
The World Health Organization (WHO) announced in June 2023 that 1.19 million people die annually as a result of road traffic crashes (WHO, 2023). One of the highest rates in the Eastern) Mediterranean is seen in Egypt, where there are 9.7 traffic fatalities for every 100,000 people (WHO, 2016). The cost of road crashes in Egypt in 2020 was estimated by the Central Agency for Public Mobilization and Statistics to be EGP 27.1 billion (CAPMAS, 2024). Most nations lose 3% of their gross domestic product because of road traffic crashes (WHO, 2023). Road safety issues in developing countries are difficult to completely comprehend and manage due to the lack of crash data collection in these areas. Crowdsourced data will be applied in this research to investigate traffic safety in urban road network. The study focused on two main neighborhoods in Cairo, Egypt where the crash, geometric and traffic data has been collected. Safety performance functions (SPFs) are statistical models that use crash data in road safety management. SPFs will be developed utilizing crowdsourced data. Further network screening was conducted applying two methods to assess and rank the most hazardous roads, thereby offering recommendations to policymakers aimed at fostering safer road environments. Figure 1 shows the flowchart of paper methodology. There are two main contributions from this study:
-
The first is to apply crowdsourced data to develop SPFs for urban road network in developing countries where there is a lack of official crash data.
-
The second is the comparison of two different methods of network screening: Highway Safety Manual (PCR) Method and a GIS spatial analysis tool method.
2. Literature review
2.1. Crowdsourced data
The term “crowdsourced data” refers to data that was gathered by regular people, generally through mobile applications or web mapping interfaces (Ferster et al., 2018). Given its relatively low cost, crowdsourced data collection enables researchers to outsource easy tasks or questionnaires on a budget, collect data in real-time, and obtain far more observations than with traditional data collection. Crowdsourced data has become a valuable source of information in many ways due to the widespread application of computers and mobile phones (Naseri, 2018). Traffic management systems can benefit from valuable real-time information provided by video data, roadway sensors, and car sensors (De Souza et al., 2017). Intelligent transportation systems collect data from distributed sensors to improve safety, service, and performance (Stylianou et al., 2019). Nevertheless, obtaining data from sensors and cameras can be costly, challenging to sustain, and may not be accessible for all roadways or crash locations.
Furthermore, there is a lack of comprehensive, real-time traffic data sets from sensors on a large scale (across states or nationwide) to facilitate evaluations of traffic safety performance. Early investigations into Waze data indicated that incidents reported by users reflect commuting patterns in various cities and can offer an understanding of the specific reasons behind traffic congestion (Silva et al., 2013). Another analysis was conducted to explore the feasibility of utilizing crowdsourced data to pinpoint hotspot locations through the observation of pedestrian-vehicle interactions (Telima et al., 2023). Safety analysis was conducted using traffic incident data from streetkey.net (formerly streetguards.com) for Eastern Cairo, Egypt, encompassing collisions, near misses, and infrastructure concerns. Spatial autocorrelation analysis was employed to ascertain the clustering, dispersion, or random distribution of incidents. The findings emphasized the importance of utilizing this data and revealed a general dispersion of incidents within the study area (Telima et al., 2023). In another research, a machine learning model based on Waze data was developed. It can predict crash counts in Louisville’s Road network with 30% higher accuracy than traditional methods (Flynn et al., 2022). It has been demonstrated that statewide safety performance functions using integrated Waze, traffic volume, census, and weather data provide trustworthy hourly estimates of police-reported crashes in 1-mi area grids at 1-h timescales (Flynn et al., 2018). As an extension for this study, it was suggested that Waze alerts may take into consideration the variation in traffic volume. Even while the crash prediction models integrated with Waze data performed well, additional parameters relevant to roadway characteristics, employment, and exposure data (such as the number of vehicle miles driven in each grid cell and hour) could enhance model predictions even more (Flynn et al., 2022). In another research, BikeMaps.org, a recently developed website, was designed for crowd-sourced mapping of cycling collisions and near misses. BikeMaps.org serves as a worldwide mapping platform enabling citizens to pinpoint locations of cycling incidents and provide details about the incident’s nature. Early assessments of data quality, measured by report completeness, reveal promising results, with 50% of reports being fully attributed and an additional 10% missing only one attribute. Those interested in utilizing BikeMaps.org are encouraged to engage by promoting citizen mapping activities within their respective regions (Nelson et al., 2015). Moreover, a novel and cost-effective conflict data collection approach was developed to better understand conflicts involving vulnerable road users (e.g., bicycle/pedestrian, bicycle/motor vehicle, and pedestrian/motor vehicle) and their severity (Rahman et al., 2019). The objective of this research is to evaluate the effectiveness and feasibility of the adopted approach and its accompanying crowd-sourced data collection. An Android-based app for crowd-sourced data collection was created. Data gathered through this app is compared with conventional fatality data to conduct hotspot analysis. It was found that the app would empower communities to initiate their own data collection endeavors, pinpointing hazardous locations within their neighborhoods. This would provide agencies with a valuable, cost-effective data repository to inform decision-making regarding bicycle and pedestrian education, promotion, enforcement, initiatives, policies, and infrastructure planning and design (Rahman et al., 2019).
2.2. Safety performance functions
Safety performance functions (SPFs) are statistical models that relate the frequency of traffic crashes to various roadway and traffic features, such as geometric design, traffic volume, and weather conditions. These models are used to estimate the expected number of crashes on a roadway segment or an intersection, given its characteristics and traffic volume, and can be used for safety evaluation and prediction purposes. The Highway Safety Manual (HSM) offers a quantitative evaluation and analysis of traffic safety (HSM, 2010). It provides techniques and tools for calculating crash frequency (CF) and for economically assessing suggested remedies for lowering CF and severity. The SPFs used by the HSM were created in the United States using local crash and road data. The development or calibration of SPFs locally to accommodate regional road and crash characteristics was encouraged. The influence of calibration of the HSM prediction models created for local road networks has been the focus of numerous studies in recent years (Alluri & Ogle, 2012; Bornheimer et al., 2012; Brimley et al., 2012; Garber et al., 2011; Martinelli et al., 2009; Tegge et al., 2010). (Al-Omari et al., 2021) conducted a study to develop SPFs in the framework of DOT roadway context classification in Florida, USA. The SPFs that were developed revealed that various factors impact the occurrence of crashes. These factors include variables like annual average daily traffic (AADT), densities of signalized intersections and access points, speed limits, and shoulder width. However, certain variables such as concrete surface and the presence of bicycle slots were found that they have no influence on crash occurrence. In a study in Egypt, (Asal & Said, 2019) evaluated the HSM models’ suitability for use on Egypt’s rural, multi-lane divided roadways. The findings demonstrated the necessity of creating locally generated SFPs using negative binomial models.
Other researchers apply full Bayesian models to develop SPFs. In a recent study conducted in Georgia, Bayesian generalized negative binomial modeling approaches was adopted to develop SPFs for rural four-lane roadway segment considering the linearity and independence assumptions of standard negative binomial models (Li et al., 2021). In another research, Bayesian inference was conducted to address the issue of the small sample size by integrating the current data with prior information to achieve trustworthy findings (Farid et al., 2017). Based on the results, (El-Basyouny & Sayed, 2010) recognized the importance of applying Full Bayes approach to evaluate the efficacy of the Stop-Sign In-Fill (SSIF) program of the Canadian Insurance Corporation of British Columbia.
In a study conducted by (Kaaf & Abdel-Aty, 2015), the calibration and transfer of HSM-SPFs were explored specifically for urban four-lane divided roads in Riyadh, Saudi Arabia. Local crash modification factors (CMFs) were developed as part of the calibration process. The findings demonstrated that using the local CMFs instead of HSM-CMF values resulted in improved prediction performance. Instead of depending on the conventional HSM procedure, certain researchers have put forward innovative techniques for calibrating SPFs. (Srinivasan et al., 2016) suggested the utilization of a calibration function as an alternative to calibration factors in the calibration process of HSM-SPFs. (Farid et al., 2018) utilized the K-Nearest-Neighbors regression method for calibrating HSM-SPFs. Both methods exhibited superior performance compared to the HSM procedure. Nonetheless, the K-Nearest Neighbors technique demonstrated even better performance than the calibration function approach.
Based on the first bicycle SPFs created by Krista Nordback in 2013, this study employed STRAVA bicycle count data, along with other traffic count data and bicycle crash data, to develop SPFs specific to the Pacific Northwest SPFs (Wang et al., 2016). These SPFs emphasize the association between crash frequency and both traffic and bike volumes. Furthermore, this project enhanced the functionality of a GIS tool previously developed in a PacTrans project for estimating bicycle exposure. State DOTs and other agencies can leverage these SPFs to assess and pinpoint historical bicycle black spots in the Pacific Northwest, facilitating more targeted safety investments.
In another approach, traffic conflicts are used to develop SPFs. (Sacchi & Sayed, 2016) established a relationship between predicted crashes and conflicts applying SPF with traffic conflicts serving as an exposure measure to predict the number of specific types of conflicts and crashes occurring at signalized intersections. Sacchi et al. (2016) used a two-stage SPF framework where conflict counts representing only unsafe interactions. First, a traffic-volume-based SPF estimated the number of conflicts. In the second stage, those estimated conflicts were used in another SPF to predict collisions revealing a significant proportional correlation between conflicts and collisions and justifying the use of conflicts as a more behaviorally relevant exposure measure.
2.3. Network screening
Safety performance functions (SPFs) serve as fundamental tools in transportation safety management, providing predictive models for estimating crash frequencies based on various roadway and traffic characteristics. Among the key objectives of SPFs is network screening, a process essential for identifying high-risk locations and prioritizing safety improvements within road networks. In previous research, a network screening process was conducted to identify the road segments having the most significant risk in the state of Florida, USA. The outcomes of the network screening revealed that the suburban commercial roads are the most problematic roads (Al-Omari et al., 2021). Another research introduced a framework for corridor-level network screening (Veeramisti et al., 2020). This approach aimed to establish a framework that would facilitate widespread adoption of suitable methodologies for conducting networkwide corridor and network screening for traffic safety analysis. The result is a unified framework that retrieves data from the source, integrates and oversees the data, executes analytical models, and delivers the outcomes through a web-based interface. It has better visualization capabilities than existing methods. Development costs, time requirements, necessary training, and maintenance are minimized. A study conducted by (Yao & Park, 2014) introduced a two-step method known as post-network screening analysis, aimed at identifying collision hot zones within a road network. The initial step involves conducting safety network screening utilizing AASHTO’s Highway Safety Manual (HSM) to identify and prioritize individual hotspot locations based on their potential for safety enhancement. The following step is innovative and entails network-constrained kernel density estimation (KDE), a form of spatial analysis. Three network screening measures were evaluated: (1) actual collision counts, (2) collision counts weighted by severity, and (3) projected collision counts weighted by severity. The results derived from the expected severity-weighted collision counts mitigated the impact of severity-weighting and effectively minimized regression-to-the-mean bias. The study suggests that the proposed two-step method can assist transportation safety professionals in prioritizing hotspots within high-collision corridors with greater efficiency.
Based on the previous literature, this research will develop local safety performance functions (SPFs) using crowdsourced data applying bot the Negative Binomial (NB) structure model and Full Bayesian (FB) approach. Additionally, network screening will be carried out applying two different methods: PCR method as well as a graphical method using GIS tool as part of the safety management process to assess the most hazardous and provide policymakers with recommendations to guarantee safer roads.
3. Data collection
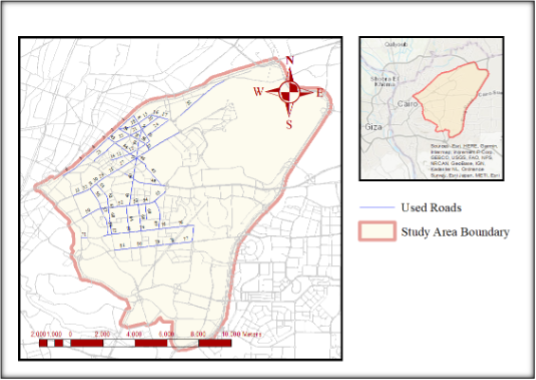
This section presents the data employed in the current research, data preparation, and the methodology adopted for safety performance functions (SPFs) and network screening analysis. The dataset was collected from 78 road segments distributed across 23 major urban roads within the Eastern Cairo Region. This area, particularly the neighborhoods of Nasr City and Misr El-Gedida, was selected as the focus of analysis due to the concentration of collected data and the high incidence of reported crashes. The reliability and credibility of the crowdsourced dataset used were previously validated (Farrag et al., 2022). The road segmentation was divided based on major intersections or flyover existence. The selected segments for the study are shown in Figure 2.
3.1. Crash data
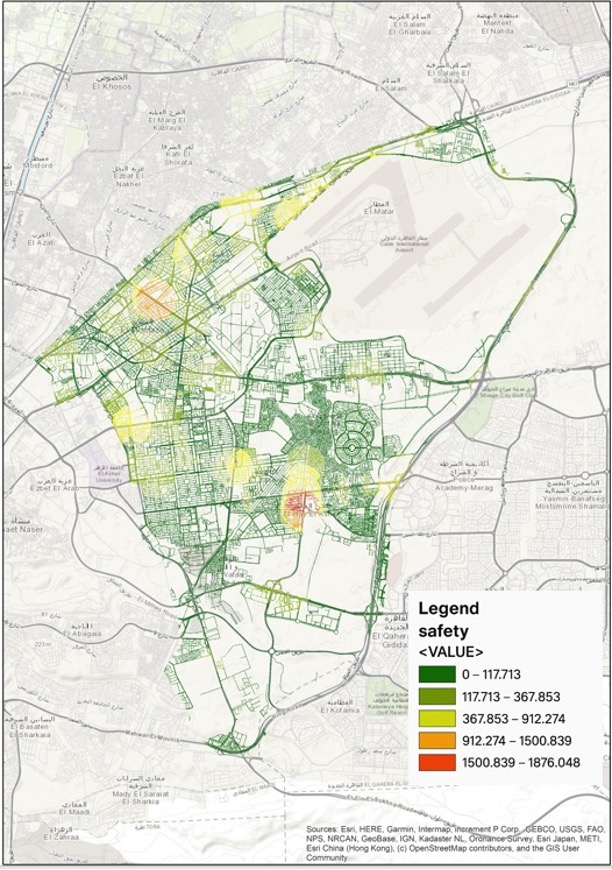
Crash data along with fatal (FC), injury (IC), and property damage only (PDO) was acquired from streetkey.net (formerly streetguards.com) (617 crashes on the selected segments). It is a crowdsourced data website related to road incidents (crashes, infrastructure issues, and threatening incidents). It is worth mentioning that the data obtained from the website has undergone thorough validation and its reliability has been confirmed, and it can be adopted for crash analysis (Farrag et al., 2022). The applied data in the study covered three years 2020, 2021 and, 2022. Crash data was separated for each road segment according to the applied segmentation. Figure 3 shows an initial heat map that was generated for the study area based on the data collected from accidents which can be useful in detection of hot spot locations. Severity of various hot spot locations was represented by EPDO as shown in the legend of the figure.
3.2. Traffic data
The annual average daily traffic (AADT) was utilized as the main exposure factor in the safety performance function. However, it was difficult to obtain AADT data for all segments due to limited availability of permanent traffic counts across different locations, AADT was estimated based on the peak hourly volume (PHV) for each segment. The peak hour for each segment was previously determined utilizing Google Maps by analyzing typical traffic patterns on the day when the traffic data was collected. PHV for each segment including all types of vehicles was collected through field traffic volume counts, with data recorded in 15-minute intervals. Then the PHV was converted from vehicle/hour to PCU/hour based on the Passenger Car Equivalency factor from the Egyptian Road Standards (ERS, 2018). The collected data was validated with previous data collected from camera videos in five locations and it was proved to be reliable with matching accuracy around 90%. AADT can be calculated using the following equations.
K-factor: Percentage of Design hourly volume to the AADT (Assumed = 10%)
The pedestrian crossing movement for road segments was collected manually from the field by observers, who monitored pedestrian crossing density and assigned a rate from 1 to 3, with each number representing different levels of the crossing density. A rating of 1 indicates low pedestrian density, 2 represents moderate density, and 3 corresponds to high pedestrian density. This classification allows for an understanding of pedestrian movement patterns across different road segments.
3.3. Geometric data
All geometric data including segment length, number of lanes, median width, number of U-turns, number of access points, on-street parking existence, and flyover existence were obtained from study area visits along with Google Earth support. The selected variables for developing safety performance functions (SPFs) include crash types (total, fatal, injury, and property damage only) to capture different severity levels, and traffic exposure (AADT) as a key predictor of crash likelihood. Roadway characteristics such as segment length, number of lanes, and median width influence traffic flow and safety. Access-related factors including the number of access points, U-turns, and presence of on-street parking introduce conflict points that affect crash risk. Lastly, the existence of flyovers is considered due to their impact on traffic patterns and potential to reduce at-grade conflicts. These variables were chosen based on their documented influence on crash frequency and severity in the literature. Table 1 presents the descriptive statistics of the used data of the selected segments for the study.
| Variable | Min. | Max. | Mean | SD |
|---|---|---|---|---|
| T (Total Annual Crash Frequency) | 0 | 57 | 7.4 | 8.1 |
| FC (Fatalities Crash) | 0 | 19 | 2.1 | 2.9 |
| IC (Injury Crash) | 0 | 21 | 3.6 | 4.4 |
| PDO (Property Damage Only Crash) | 0 | 17 | 2.6 | 3.2 |
| AADT (PCU/day/direction) | 3232 | 120496 | 40806.76 | 23434.75 |
| La (Number of lanes) | 2 | 10 | 4.93 | 1.22 |
| Med. (Median Width (m)) | 0 | 22 | 5.27 | 5.48 |
| L (Segment Length (km)) | 0.25 | 3.49 | 0.93 | 0.56 |
| Acc. (No. of Access Points) | 0 | 18 | 4.51 | 3.17 |
| U-turns (No. of U-Turns) | 0 | 6 | 1.32 | 1.17 |
| On (On-Street Parking (Presence of on-street parking: 1 = yes, 0 = no)) | 0 | 1 | 0.71 | 0.45 |
| Bri. (Flyover Existence (Presence of flyover: 1 = yes, 0 = no)) | 0 | 1 | 0.56 | 0.50 |
| Ped. (Pedestrian Movement (Pedestrian Crossing Density: 1= Low, 3=High)) | 1 | 3 | 1.74 | 0.69 |
4. Data processing
4.1. Safety performance functions
4.1.1. Generalized linear models
Various models and distributions can be utilized for the development of SPFs. In most research, the negative binomial model was adopted to develop SPFs (Abdel-Aty & Radwan, 2000; Abdelrahman et al., 2020; Elagamy et al., 2020; Fitzpatrick et al., 2008; Manuel et al., 2014; Mohammadi et al., 2014). The data used in this study were analyzed and fitted using the generalized linear modeling (GLM) technique with a Negative Binomial (NB) error term. Initially, the significance of all variables was tested to identify potential predictors to be included in the models. The calculation of model parameters was conducted using SPSSTM software. To identify the explanatory variables for inclusion in the model, a stepwise regression analysis was employed. Annual average daily traffic (AADT) and segment length were used as main exposures and then other variables were included in the models and tested through stepwise regression. The following equation shows the form of the SPF models that has been adopted for the analysis.
α, β1, β2, βn: Intercept and variables’ coefficients.
X: indicate any variable could be included in the SPF
After the calibration of SPFs, the goodness of fit for the developed models was investigated. Calibration was performed by optimizing the model parameters to best fit the observed crash data using maximum likelihood estimation within the GLM framework. Pearson Chi-square and scaled deviance (SD) were chosen to assess the model’s goodness of fit. The two measures can be calculated for each model as shown in the following equations. They were compared to the minimum Chi-square value according to the degree of freedom and significance level (77, 0.05). To determine the best models, two measures were used. Akaike Information Criterion (AIC) and the Bayesian Information Criterion (BIC) were deduced from the results for evaluating and comparing statistical models (Intini et al., 2021; Moomen et al., 2019). AIC prioritizes goodness-of-fit, favoring models with lower prediction error, while BIC introduces a stronger penalty for model complexity, helping to prevent overfitting.
yi: observed crashes
Np = µi: estimated crashes from SPF
k: dispersion parameter
4.1.2. Full Bayes models
Full Bayes models were applied also in this study to develop SPFs to compare the results with the traditional negative binomial models regarding significance and impact of parameters in the developed models. FB models allow for the integration of prior knowledge into the analysis, improving estimates in cases of limited data. They provide a complete posterior distribution of parameters, offering a more thorough understanding of uncertainty. These models can handle complex hierarchical structures and accommodate various data types and distributions. Bayesian approaches facilitate model selection using the deviance information criterion (DIC).
Two types of models were developed applying Full Bayesian analysis. FB models with and without unobserved heterogeneity and spatial correlation effects. FB models without those effects were developed to compare the results with the traditional NB models. To consider the effects of unobserved heterogeneity and spatial correlation of segments, the other models with those effects were developed. Spatial variables were integrated into the Full Bayes model by including a spatially structured random effect term to capture spatial correlation among adjacent segments. A conditional autoregressive (CAR) prior was used to model this effect, accounting for the influence of neighboring road segments based on their spatial adjacency. Incorporating a spatial effect term often improves the model’s goodness of fit, but it can sometimes impact the significance levels of the parameters (El-Basyouny & Sayed, 2010).
The WinBUGS tool is used to apply Markov Chain Monte Carlo (MCMC) methods for sampling the posterior distribution and estimating the parameters of the Full Bayesian (FB) model with 10,000 iterations. Parameter estimation, performance evaluation, and inference are achieved through subsequent iterations. To obtain Full Bayesian (FB) estimates, prior distributions for the parameters must be specified to reflect prior knowledge about them. These priors can be either informative or non-informative, depending on the availability of prior information. The most commonly used prior is a diffuse prior, which is a normal distribution with a zero mean and a large variance (El-Basyouny & Sayed, 2010; Kamel et al., 2019). For the dispersion parameter, a gamma distribution is commonly used as a prior distribution to define its parameters. Negative binomial model was adopted to structure the form of the FB model. The goodness of fit of the FB models was assessed using the Deviance Information Criteria (DIC). Lower DIC values indicate a better model fit (Farid et al., 2017).
4.2. Network screening
4.2.1. PCR method
Network screening is recognized as one of the primary applications of SPFs and is considered an essential element of the safety management process. Its primary objective is to identify the most problematic roadway segments by ranking them in descending order based on their perceived risk. The network screening aims to prioritize the implementation of countermeasures that effectively reduce both the frequency and severity of crashes throughout the entire roadway network. The Potential Collision Reduction (PCR) method, referred to as “Excess Expected Average Crash Frequency with EB Adjustments” in the Highway Safety Manual (HSM), is considered the most robust approach to investigate network screening. It is worth noting the distinction between Empirical Bayes (EB) and Full Bayes (FB). EB is commonly applied in network screening, providing straightforward correction for regression-to-the-mean bias, whereas FB offers more robust uncertainty quantification through the use of prior distributions and is particularly well-suited for SPF development, especially when data availability is limited (Cafiso et al., 2021; D’Agostino et al., 2019; Garber et al., 2011). It can be calculated as the following equations.
EBi: A measure that combines the previous two measures; the observed crash value yi and the estimated crash value µi
4.2.2. Spatial method
Moreover, ArcMap software is adopted for graphical representation of network screening and comparison with the PCR method. Crash data was imported into ArcMap and transformed into EPDO format. A spatial analysis tool (kriging) was employed to create a surface from the data points, facilitating interpolation and extrapolation. The kriging tool utilizes the nearby measured values to forecast outcomes for locations where data is lacking. Equation 11 shows the fundamental formula for this tool, representing a weighted sum of available data.
Z(Si) = the measured value at the ith location
λi = an unknown weight for the measured value at the ith location
So = the prediction location
N = the number of measured values
The average score can be obtained by dividing the result of Equation 11 by the number of measured EPDO values. In kriging, the weight (λi) is calculated by fitting a spatial autocorrelation model to the measured data, typically using a semi-variogram. The weights are determined by solving a system of equations that consider both the distances between the measured points and the prediction location, as well as the spatial structure of the data. This allows the method to account for spatial relationships and provide an optimal weighted sum for the prediction (ESRI, 2024). The resulting surface intersects each road segment. The surface is generated from EPDO data points. The severity of each segment can be indicated by either an average EPDO score or a cumulative EPDO score that can be calculated from the intersection of surface and road segments, both of which can be derived from the surface data for individual road segments.
5. Results
5.1. Safety performance functions
5.1.1. Generalized linear models
Table 2 shows the correlation matrix for all variables that were utilized for the modeling process. It was found that all variables have low correlation with each other and with ln AADT and ln L which means that all variables can be included in the models simultaneously or individually and preferred to be significant variables. Only no. of access points had a strong correlation with ln “L” and should not be included with it in the same model as the correlation coefficient was 0.532. Table 3. presents all developed SPFs in the modeling process. All variables were included in model 1 to obtain an initial insight into the impact and significance of roadway characteristics. As major exposure variables, AADT and segment length were included in the development of model 2. Based on the significance of variables from model 1 and the correlation matrix, one variable was added individually to AADT and segment length to be assessed (models 3,4,5,6). If the variable is significant (significance around 10 %) or has a weak correlation with main exposures (> 0.5), it will be selected to be added to the model.
| T | ln AADT | La | Med. | ln L | U | On | Acc. | Bri. | Ped. | |
|---|---|---|---|---|---|---|---|---|---|---|
| T | 1.000 | 0.257 | 0.284 | -0.058 | 0.518 | 0.207 | 0.077 | 0.312 | 0.203 | 0.484 |
| ln AADT | 0.257 | 1 | 0.341 | -0.005 | 0.103 | -0.117 | -0.207 | -0.071 | 0.290 | 0.376 |
| La | 0.284 | 0.341 | 1.000 | -0.213 | .001 | 0.126 | 0.171 | 0.039 | 0.051 | 0.248 |
| Med. | -0.058 | -0.005 | -0.213 | 1.000 | -0.164 | 0.017 | -0.347 | -0.157 | -0.206 | -0.216 |
| ln L | 0.518 | 0.103 | 0.001 | -0.164 | 1 | 0.213 | 0.040 | 0.532 | 0.257 | 0.171 |
| U-turns | 0.207 | -0.117 | 0.126 | 0.017 | 0.213 | 1.000 | 0.251 | -0.024 | -0.136 | 0.103 |
| On | 0.077 | -0.207 | 0.171 | -0.347 | 0.040 | 0.251 | 1.000 | 0.386 | 0.088 | 0.112 |
| Acc. | 0.312 | -0.071 | 0.039 | -0.157 | 0.532 | -0.024 | 0.386 | 1.000 | 0.067 | 0.224 |
| Bri. | 0.203 | 0.290 | 0.051 | -0.206 | 0.257 | -0.136 | 0.088 | 0.067 | 1.000 | 0.086 |
| Ped. | 0.484 | 0.376 | 0.248 | -0.216 | 0.171 | 0.103 | 0.112 | 0.224 | 0.086 | 1.000 |
Based on the significance, the next step was adding more than one variable to AADT and segment length in the modeling process to have a deep insight into the impact of variables on traffic safety (models 7,8,9,10). Through model 1, it was found that AADT, segment length, pedestrian density, number of lanes, flyover existence, and median width coefficients have positive values which means that they have a positive association with number of crashes. Only, the presence of on-street parking and the number of U-turns had a negative coefficient value, and this means that they lead to reduce the number of crashes. Variables’ significance has been investigated. It was found that the number of lanes, segment length, and pedestrian density were significant variables (significance > 0.05). It is worth mentioning that road crashes are random variables so even if the variables were not significant, they can be included in the models as they impact the number of crashes as AADT.
| Variable | Estimated Parameter (Standard error & P-Value) | ||||
|---|---|---|---|---|---|
| Model 1 | Model 2 | Model 3 | Model 4 | Model 5 | |
| Intercept | -3.878 (3.223 & 0.229) | -7.106 (2.0853 & 0.013) | -6.261 (2.812 & 0.026) | -7.109 (2.847 & 0.013) | -5.356 (2.797 & 0.056) |
| ln AADT | 0.280 (0.305 & 0.359) | 0.823 (0.255 & 0.001) | 0.658 (0.260 & 0.011) |
0.826 (0.255 & 0.001) |
0.552 (0.255 & 0.030) |
| ln L | 0.940 (0.344 & 0.006) | 1.154 (0.251 & 0.000) | 1.135 (0.253 & 0.000) | 1.140 (0.0.255 & 0.000) | 1.009 (0.247 & 0.000) |
| La | 0.095 (0.053 & 0.074) | - | 0.102 (0.047 & 0.030) | - | - |
| Med. | 0.046 (0.031 & 0.133) | - | -0.007 (0.025 & 0.783) | - | |
| U-turns | -0.007 (0.121 & 0.956) | - | - | - | - |
| On | -0.040 (0.415 & 0.924) | - | - | - | - |
| Acc. | 0.016 (0.036 & 0.649) | - | - | - | - |
| Bri. | 0.400 (0.296 & 0.176) | - | - | - | - |
| Ped. | 0.675 (0.213 & 0.002) | - | - | - | 0.654 (0.186 & 0.000) |
| SD | 33.062 | 51.541 | 47.004 | 51.466 | 38.822 |
| Chi-Square | 26.917 | 51.933 | 43.232 | 51.123 | 30.265 |
| Model 6 | Model 7 | Model 8 | Model 9 | Model 10 | |
| Intercept | -6.655 (2.914 & 0.022) | -4.818 (2.800 & 0.085) | -3.511 (2.857 & 0.219) | -4.285 (2.842 & 0.132) | -4.466 (2.856 & 0.118) |
| ln AADT | 0.772 (0.263 & 0.003) | 0.452 (0.263 & 0.086) | 0.253 (0.279 & 0.364) | 0.362 (0.273 & 0.185) | 0.428 (0.267 & 0.108) |
| ln L | 1.131 (0.252 & 0.000) | 0.986 (0.251 & 0.000) | 1.010 (0.266 & 0.000) | 1.048 (0.262 & 0.000) | 1.011 (0.257 & 0.000) |
| La | - | 0.067 (0.048 & 0.164) | 0.096 (0.051 & 0.061) | 0.088 (0.050 & 0.080) | - |
| Med. | - | 0.047 (0.029 & 0.105) | 0.034 (0.027 & 0.211) | 0.030 (0.028 & 0.278) | |
| U | - | - | - | - | - |
| On | - | - | |||
| Acc. | - | - | - | - | - |
| Bri. | 0.185 (0.262 & 0.480) | - | 0.394 (0.282 & 0.162) | - | 0.347 (0.284 & 0.220) |
| Ped. | - | 0.612 (0.192 & 0.001) | 0.701 (0.199 & 0.000) | 0.672 (0.198 & 0.001) | 0.722 (0.192 & 0.000) |
| SD | 51.046 | 36.920 | 33.348 | 35.268 | 36.774 |
| Chi-Square | 53.472 | 29.712 | 26.092 | 27.483 | 29.631 |
After this process, the goodness of fit for the models was investigated by calculating scaled deviance and the Chi-square test as shown in equations 5,6,7. With a comprehensive examination of the models and based on the variables’ significance and impact on road crashes, it was found that all variables in models 2,3, and 5 are significant (> 0.05) and have logical signs on the impact on traffic safety. Regarding the goodness of fit, scaled deviance and Chi-square values of models 1 and 8 are the lowest compared to the critical value (Pearson χ2 critical = 98.48) which means that the observed data fits well with the expected values based on the negative binomial model and there is no significant discrepancy between the observed and expected frequencies. Although these two models have insignificant variables, they were fitted well using the negative binomial modeling. Model 8 is recommended as it has more than one variable and different impacts on the crash frequency and all the variables are logical and more significant than model 1.
5.1.2. Full Bayes models
Table 4 presents the results of the FB developed models. FB models without spatial effects are using the same parameters as model 1 & 8 in traditional SPFs that previously mentioned in the analysis. Model A includes all the parameters and Model B includes the adopted parameters as in model 8. All parameters’ values in the two models are within the credible interval, do not contain null values (zeros) and have a positive association with the crash occurrence. These results conformed with the results of the previous traditional negative binomials models. The coefficient of parameters in FB models are close to the coefficients of the traditional NB models. One interesting result is that on-street parking, and the number of U-turns have a negative association with the number of crashes in the traditional model unlike the FB model. The results of FB model are more justifiable because the existence of U-turns or on-street parking is considered as conflict points in the road network, and this may increase the risk of crash occurrence. The results of FB models can be relied upon much more than the traditional models as they depend on prior information and have much more iterations to proceed to the posterior distribution and estimating the parameters of the Full Bayesian (FB) model (Surapunt & Wang, 2024).
| Variable | Estimate | SD | Credible Interval | Estimate | SD | Credible Interval | |||
|---|---|---|---|---|---|---|---|---|---|
| Model A | Model B | ||||||||
| 2.50% | 97.50% | 2.50% | 97.50% | ||||||
| Intercept | -4.663 | 1.619 | -6.894 | -2.194 | -4.290 | 1.114 | -5.989 | -2.270 | |
| ln AADT | 0.350 | 0.149 | 0.140 | 0.597 | 0.329 | 0.112 | 0.152 | 0.518 | |
| ln L | 0.925 | 0.176 | 0.581 | 1.254 | 1.001 | 0.154 | 0.702 | 1.307 | |
| La | 0.094 | 0.032 | 0.032 | 0.157 | 0.097 | 0.031 | 0.036 | 0.159 | |
| Med. | 0.041 | 0.018 | 0.004 | 0.077 | 0.040 | 0.017 | 0.006 | 0.076 | |
| U-turns | 0.007 | 0.069 | -0.128 | 0.144 | |||||
| On | 0.005 | 0.237 | -0.439 | 0.472 | |||||
| Acc. | 0.019 | 0.020 | -0.020 | 0.059 | |||||
| Bri. | 0.359 | 0.177 | 0.044 | 0.698 | 0.330 | 0.164 | 0.010 | 0.629 | |
| Ped. | 0.667 | 0.122 | 0.438 | 0.911 | 0.698 | 0.118 | 0.465 | 0.929 | |
| DIC | 419.500 | 414.600 | |||||||
| Model C | Model D | ||||||||
| 2.50% | 97.50% | 2.50% | 97.50% | ||||||
| Intercept | -4.658 | 1.582 | -6.882 | -2.190 | -4.230 | 1.116 | -5.992 | -2.280 | |
| ln AADT | 0.342 | 0.147 | 0.140 | 0.591 | 0.331 | 0.109 | 0.149 | 0.523 | |
| ln L | 0.895 | 0.169 | 0.580 | 1.261 | 1.004 | 0.151 | 0.705 | 1.311 | |
| La | 0.083 | 0.035 | 0.030 | 0.151 | 0.103 | 0.028 | 0.031 | 0.162 | |
| Med. | 0.052 | 0.020 | 0.007 | 0.073 | 0.038 | 0.023 | 0.010 | 0.080 | |
| U-turns | 0.006 | 0.072 | -0.123 | 0.141 | |||||
| On | 0.007 | 0.241 | -0.450 | 0.450 | |||||
| Acc. | 0.023 | 0.025 | -0.023 | 0.061 | |||||
| Bri. | 0.364 | 0.183 | 0.051 | 0.703 | 0.334 | 0.170 | 0.010 | 0.632 | |
| Ped. | 0.658 | 0.125 | 0.430 | 0.921 | 0.702 | 0.121 | 0.465 | 0.934 | |
| ψs | 0.623 | 0.072 | 0.572 | 0.703 | 0.681 | 0.076 | 0.564 | 0.710 | |
| DIC | 410.700 | 403.400 | |||||||
Regarding FB developed models with spatial effects, spatial effects were included as segments in the same corridor were considered as spatially affected. FB models are developed as model 1 & 8 in traditional SPFs that previously mentioned in the analysis. Model C includes all the parameters as in model 1 and Model D includes the adopted parameters as in model 8 but with spatial effects. Similar results were found as the models without spatial effects, but the Deviance Information Criteria (DIC) that was used to assess the FB models with spatial effect goodness of fit were marginally lower than the DIC values of FB models without spatial effects (410.7 & 403.4) which means that intervention of spatial correlation term in the models can marginally enhance the efficiency of the models.
5.2. Network screening
As one of the most important applications of safety performance functions, network screening has been undergone in the study area to investigate the most hazardous road segments and suggest recommendations for policymakers to enhance road safety on the network based on their priority. Road segments were arranged in descending order according to the potential collision reduction values as calculated in equations (8-10) based on predicted crashes from model D (FB model with spatial correlation effect). Table 5 lists the most hazardous road segments in the study area based on their PCR value.
| Road Segment ID | Road Name | PCR Rank | GIS Score-SUM Rank |
GIS Score-AVG Rank |
|---|---|---|---|---|
| 82 | Joseph Tito | 1 | 2 | 8 |
| 43 | Abou-Bakr El-Sedeek | 2 | 1 | 4 |
| 1 | Gesr Al Suez | 3 | 3 | 36 |
| 75 | Mostafa El-Nahaas | 4 | 5 | 29 |
| 25 | Salah Salem | 5 | 6 | 30 |
| 76 | Mostafa El-Nahaas | 6 | 4 | 13 |
| 74 | Mostafa El-Nahaas | 7 | 18 | 44 |
| 49 | El-Thawra | 8 | 8 | 16 |
| 23 | El Hegaz | 9 | 10 | 33 |
| 9 | Fareed Semeika | 10 | 9 | 21 |
| 33 | Salah Salem | 11 | 11 | 19 |
| 27 | Salah Salem | 12 | 13 | 7 |
| 61 | El-Tayran | 13 | 12 | 5 |
| 41 | El-Nozha | 14 | 20 | 47 |
| 53 | El -Nasr | 15 | 32 | 35 |
| 72 | Mostafa El-Nahaas | 16 | 16 | 14 |
| 73 | Mostafa El-Nahaas | 17 | 54 | 56 |
| 4 | Gesr Al Suez | 18 | 21 | 39 |
| 68 | Ahmed Fakhry | 19 | 51 | 40 |
| 66 | Makram Ebeid | 20 | 47 | 49 |
Joseph Tito road is the most hazardous road segment. It has seven lanes per direction. The biggest problem on this road is that pedestrians cross the road although the existence of pedestrian bridges (out of a total of 34 crashes, 7 were identified as pedestrian-related crashes). Abou-Bakr El-Sedeek came as the second hazardous road segment (out of a total of 44 crashes, 9 were identified as pedestrian-related crashes). As a main road having 6 lanes per direction, it has land uses on both roadsides and high pedestrian density. The reason why this road being hazardous is due to pedestrian crashes. Implementing safety countermeasures along these locations has the greatest potential and priority for improving safety by reducing the number and severity of crashes.
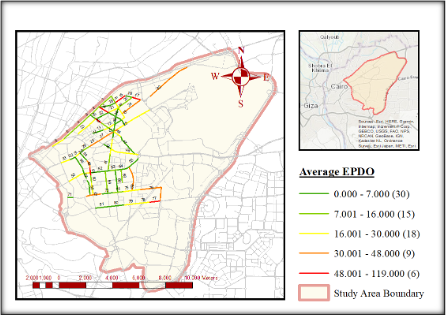
The network analysis has also been done using ArcMap software to be presented graphically and validate as well as compare the PCR method. Crash data has been imported into ArcMap and converted to EPDO based on the Egyptian insurance cost (Fatal:1994001.8 EGP, Injury: 84200.2 EGP & PDO: 55472.7 EGP) (Nasser et al., 2016). A surface from data points has been created using a spatial analysis tool (kriging) to interpolate and extrapolate the data points. Figures 4 and 5 present the most problematic road segments based on the average EPDO score and summation EPDO Score. Each road segment intersects with the surface can be represented by a number expressing average EPDO or sum EPDO. Segment severity can be represented by an average EPDO score or summation EPDO score that can be obtained for each road segment from the surface. The last two columns in Table 5 show the rank based on these two criteria that were applied using ArcMap.
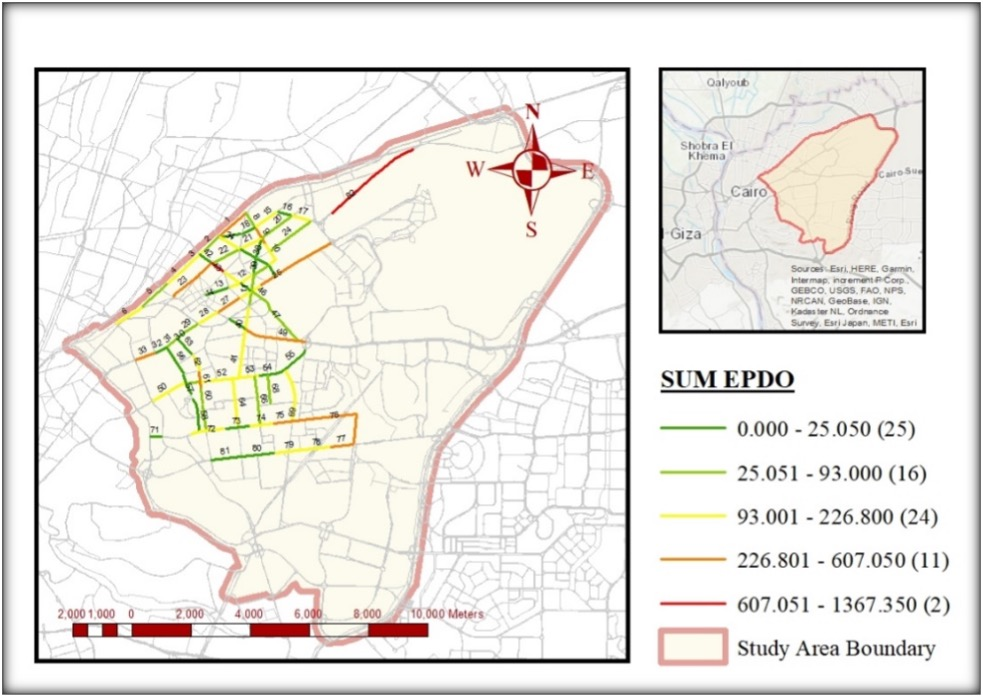
The adopted ArcMap tool (kriging) applying summation criteria gives a better result than average criteria when compared to and validated by the PCR method. While there is general agreement among the ranking methods, noticeable discrepancies can be observed in some segments. For example, segment 1 (Gesr Al Suez) was ranked 3rd by the PCR method and GIS Score-SUM, but dropped significantly to 36th using GIS Score-AVG. These differences highlight how each method captures severity differently—PCR and GIS Score-SUM emphasize cumulative crash impact, whereas GIS Score-AVG may underrepresent heavily clustered crashes. Therefore, understanding these discrepancies is essential for selecting the most suitable approach for prioritizing safety interventions. This may be because the PCR and GIS Score-SUM Rank both rely on aggregation methods, where multiple EPDO points are combined into a single score. This aggregation process leads to a more holistic and comprehensive ranking, making the GIS Score-SUM Rank potentially more aligned with the PCR Rank. In contrast, the GIS Score-AVG Rank considers average values, which may not capture the same level of detail in comparison, thus resulting in a weaker similarity with the PCR Rank. It can be applied in the preliminary analysis of the network screening. It is worth noting that the PCR method is considered the best method because it relies on safety performance functions (SPFs), which are statistically derived models that provide more accurate and reliable predictions of road safety. In contrast, GIS methods are primarily based on graphical representations, which, while useful for visualization, do not offer the same level of analytical rigor and predictive capability as SPFs.
Figure 6 shows safety issues extracted from recorded videos during data collection in the study areas. Figure 6.a shows random pedestrian crossing as he did not commit to cross the road from the designated place. Figure 6.b shows random stops of buses at the beginning and end of flyovers, and this may lead to crashes during moving or stopping suddenly.
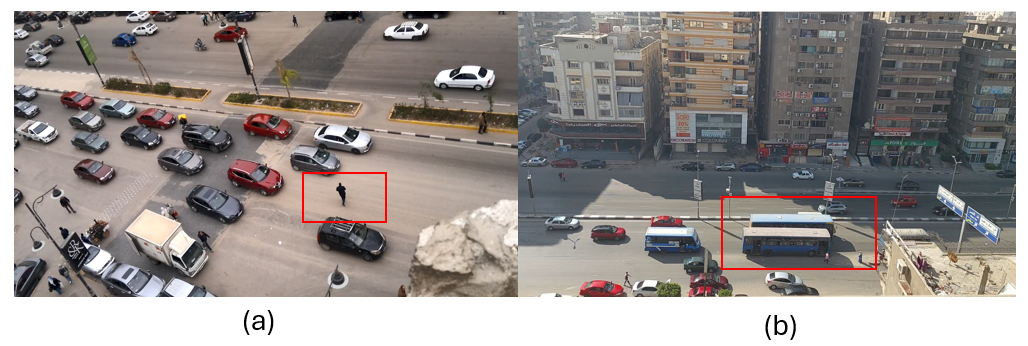
It was observed that public transit vehicles such as buses and microbuses stop frequently and suddenly at the beginning and end of flyovers and then move randomly, and this led to severe conflicts and resulted in more crashes. As a result of the bad behavior from pedestrians and because of the unavailability of associated infrastructure, pedestrians cross the road randomly and at any location and this consequently leads to more pedestrian conflicts and more crashes.
6. Discussion
The importance of developing safety performance functions (SPFs) lies in identifying factors associated with crash occurrences and understanding how these factors affect traffic safety. Based on the developed models, it was found that the number of crashes is expected to increase with the increase in AADT, number of lanes, segment length, number of access points, flyover existence, and pedestrian density. As AADT increases, potential traffic conflicts rise, which may lead to more crashes. The same trend applies to the increase in segment length, number of lanes, and access points, all of which contribute to a more complex traffic environment. These findings are consistent with previous research conducted in Florida, USA (Al-Omari et al., 2021) and Italy (Mohammadi et al., 2014), which also identified these factors as key contributors to crash frequency. However, contrasting results were observed in Egypt, where the presence of side access points was associated with reduced crash likelihood, potentially due to lower vehicle speeds in these zones (Elagamy et al., 2020). This suggests contextual variations in driver behavior and traffic enforcement between countries. Median width showed a non-significant positive association with crash frequency in our study, possibly due to its role in encouraging higher vehicle speeds. This aligns with findings from Al-Omari et al. (2021). In contrast, Asal et al. (2019) reported a 1% reduction in crash frequency for every foot increase in median width in a rural Egyptian context, emphasizing that the safety impact of median width may depend on the surrounding environment and road user behavior. Although some variables (e.g., flyover existence and number of access points) were statistically insignificant, they exhibited logical associations with crash frequency. For instance, flyovers often serve as conflict points due to sudden merging or stopping behaviors. Many drivers stop at the beginning or end of flyovers, especially in the study area, which can increase crash risk. A particularly insightful finding from the Full Bayes (FB) models was the negative association between the number of U-turns and crash frequency. The presence of U-turns appears to reduce traffic speed and exposure, thereby reducing crash risk. This aligns with findings from Carter et al. (2005), where increased U-turn frequency correlated with reduced saturation flow and fewer crashes. However, other studies (e.g., Azizi & Sheikholeslami, 2013) showed increased crash rates when converting direct left-turns to U-turns, emphasizing the importance of proper U-turn design.
In the safety management process, the network screening phase revealed valuable insights. PCR results, derived from the FB model with spatial correlation, were used to prioritize high-risk segments. Joseph Tito and Abou-Bakr El-Sedeek were identified as the most hazardous, primarily due to high pedestrian activity and unsafe crossing behaviors. To validate and complement the PCR results, a GIS-based spatial analysis using kriging was performed. EPDO values were derived from crash severity weights based on Egyptian insurance cost estimates. Two criteria were applied: average EPDO and summation EPDO scores. The GIS Score-SUM approach showed stronger alignment with PCR rankings than the average score method, likely due to both being aggregation-based measures. This confirms that GIS Score-SUM can be used effectively in preliminary network screening when SPFs are not available.
Pedestrian behavior and illegal parking practices emerged as major concerns. Many pedestrians cross roads unsafely, even in areas with pedestrian bridges. Drivers often stop illegally at flyover edges. Addressing these issues through public awareness, traffic enforcement, and improved infrastructure is essential. Additionally, installing traffic control devices at access points and enforcing no-stopping zones near flyovers are recommended to mitigate conflict points.
This study’s findings align with the principles of the Safe System approach and Vision Zero, which emphasize proactive, data-driven strategies to eliminate fatal and serious crashes. By identifying high-risk locations, assessing roadway features, and proposing targeted interventions such as improved pedestrian infrastructure and enforcement near flyovers, the study supports the goal of creating a forgiving road system that accommodates human error and prioritizes safety for all users.
7. Conclusion
The main contribution of this study is to explore the traffic safety of an urban road network through the analysis of crowdsourced data. It involved developing safety performance functions to gain a better understanding of how roadway characteristics influence safety outcomes. Besides and as a component of the safety management process, network screening has been conducted to prioritize the most hazardous roads and propose recommendations for policymakers, aiming to enhance road safety using two different methods. Crowdsourced crash data has been collected from streetkey.net for 79 segments in the Eastern Cairo Region. This crowdsourced data has undergone rigorous validation, confirmed its reliability, and made it suitable for crash analysis (Farrag et al., 2022). AADT and geometric data were obtained from the field with the aid of Google Earth. SPFs were developed by adopting a generalized linear model and full bayes model with and without considering spatial effects. AADT, segment length, number of lanes, median width, flyover existence and pedestrian density were included in this model. AADT, segment length, number of lanes, and pedestrian density were identified as significant predictors of crash frequency, reflecting their strong influence on traffic safety. Full Bayes models with spatial correlation outperformed traditional Negative Binomial models, offering improved goodness of fit and more logical parameter interpretations. Additionally, the number of U-turns exhibited a negative association with crash frequency, suggesting that well-designed U-turns can contribute to safer traffic conditions by reducing vehicle speeds and conflict points.
Pedestrians in the study area and generally, Egypt are used to cross the roads randomly in any location even if it is not specified to crossing and in bridge zones. Many drivers also stop frequently at the beginning and end of flyovers. Therefore, awareness campaigns among road users should be conducted to enhance drivers’ and pedestrians’ perceptions and behavior regarding road safety issues and traffic crash prevention. As access points lead to more crashes, it should be controlled properly to guarantee the safety for all road users. Traffic control devices have to be installed on the access point to control and mitigate traffic conflicts which may lead to crashes. As flyover existence causes more conflicts and maybe crashes, drivers must be prevented from stopping at the beginning and end of crossover at intersections by increasing enforcement efforts such as increasing patrol existence in these locations or fix traffic cameras that can take images or videos of vehicles committing traffic violations, allowing authorities to issue fines.
As part of the safety management process, network screening has been conducted to prioritize the most hazardous road segments and propose recommendations for policymakers, aiming to enhance road safety. PCR method was adopted using the developed SPFs to investigate the most problematic roadway segments and enhance road safety in the study area and to be compared with an ArcMap spatial analysis tool (kriging) that was applied to present the network screening and validate the PCR method. The results showed that this method can be applied efficiently to investigate network screening for urban road networks using crowdsourced data. The adopted ArcMap tool (kriging) applying summation criteria gives a better result than average criteria when compared to and validated by the PCR method.
Nevertheless, it is important to note, as a constraint of this study, that the data utilized pertains solely to two prominent neighborhoods in Cairo. It is recommended to generalize the study on more than those two neighborhoods. Crowdsourced data was applied for this study due to missing official crash data, however, it is recommended to utilize official crash data and complement the results of this study. Crowdsourced crash data, while valuable, may suffer from reporting bias, as minor or unreported incidents are often excluded. Spatial and temporal gaps can occur due to uneven user distribution and inconsistent reporting over time. Additionally, user-generated errors and lack of standardized data formats may affect accuracy, while limited contextual information—such as weather or driver behavior—can constrain deeper analysis. Countermeasures are being installed in many spots within the study area, it is recommended to perform and after analysis for these locations to investigate the effect on traffic safety using newer crowdsourced data as well as official crash data when available.
CRediT contribution statement
Mahmoud Ahmed Farrag: Conceptualization, Data curation, Formal analysis, Methodology, Resources, Writing—original draft. Ali Zain Elabdeen Heikal: Conceptualization, Data curation, Investigation, Methodology, Resources, Writing—original draft. Mohamed Shawky: Conceptualization, Data curation, Investigation, Resources. Ahmed Osama: Conceptualization, Data curation, Investigation, Methodology, Resources, Writing—review & editing.
Declaration of competing interests
No competing interests are reported by the authors.
Declaration of generative AI use in writing
The authors declare that no generative AI was used in this work.
Ethics Statement
The research presented in this manuscript involves the analysis of anonymized, publicly available crowdsourced traffic data and does not involve human subjects, identifiable personal information, or intervention. Therefore, ethical approval was not required under the applicable guidelines at our institution.
Funding
This work did not receive any financial support
Acknowledgement
An early version of this paper was presented at the 18th International Conference on Traffic and Transportation Engineering, held in Sydney, Australia, on 29–30 August 2024.
Editorial information
Handling editor: Carmelo D’Agostino, Lund University, Sweden
Reviewers: Filbert Francis, Lund University, Sweden; Thomas Miyoba, University of Zambia, Zambia | Zambia Road Safety Trust, Zambia; Praveen Kumar P, Manipal Institute of Technology, India