Investigation on road traffic safety in rural areas using trajectory data: case studies at two measurement sites
Abstract
Analyses of daily driving patterns and near misses offer valuable insights into road safety, particularly as crashes are expected to become increasingly rare. While research has largely focused on highway and urban environments, rural areas remain underexplored. This study addresses this gap by investigating traffic behavior with a specific focus on safety-relevant scenarios at two rural sites in Germany, located south of Berlin along the Federal Road 179. We collected trajectory data and video material over a two-week observation period at each site. Although no accidents or critical conflicts were observed, several behavioral patterns emerged that may comprise traffic safety. Drivers frequently exceed the speed limits and engaged in overtaking maneuvers at intersections. Additionally, vehicles on the main road often yielded their right of way to avoid potential conflicts with turning traffic. The study further reveals that road users adapt their behavior to existing—yet underdeveloped—infrastructure, posing a potential safety risk. In particular, heavy vehicles such as trucks or motorhomes were observed making turns by crossing oncoming lanes, and vulnerable road users have to use the main road, coming into conflict with motorized traffic. These findings underscore the importance of targeted safety assessment and infrastructure improvements in rural traffic environment to reduce the potential of conflicts between different road users.
1. Introduction
The future of transportation is centered on improving the overall driving safety. With Vision Zero, this has become a global concept aiming at a transportation environment without serious crashes and fatalities. In the past decades, research has mainly been conducted on highways and urban areas due to the focus of the development of automated and connected vehicles in these regions. However, for the release of automated vehicles into the public domain, including rural areas, research on rural traffic is vital, especially on the general driving behavior and, in particular, on traffic safety.
In Germany in 2022, the majority of fatalities (about 2,700) occurred on rural roads (57%) compared to highways (11%) and urban areas (32%). About half of the fatalities were caused by car drivers and a quarter by motorcyclists. The measurement sites analyzed in this study are located in Brandenburg, Germany. A total of 16,541 road accidents were recorded in Brandenburg in 2022, with an increase of 1.2% in district Dahme-Spreewald. A total of 790 people were injured in road accidents in Dahme-Spreewald, 211 of them outside built-up areas (excluding motorways). Excessive or inappropriate speed, failure to give way, insufficient distance and accidents caused by alcohol or drugs were the main causes of accidents (Polizei Brandenburg, 2023). Those factors associated with fatalities are also studied by Mason et al. (2022) examining 25 studies on rural roads in Australia and Canada. They identified 15 factors, including speed, infrastructure, stationary objects, time of day, animals, and also illegal driving and driving under the influence of drugs or alcohol. The wide variety of vehicles in rural areas and the higher risk of rural crashes for motorcycles and bicycles were noted.
The behavior of urban and rural drivers is not always comparable and must be considered individually. Studies show that rural drivers are less likely to buckle one's seatbelt and therefore have a higher risk of fatal crashes than urban drivers. (Li et al., 2008, Muelleman & Mueller, 1996) also found that the characteristics of fatal road accidents are not homogeneous and that one characteristic may be population density. Jaarsma (2010) also sees the risk of crossing interactions, different speeds and wild animals in rural areas, and suggest optimizing the transportation network in rural areas to combine nature conservation and rural tourism.
Accidents are usually caused by a combination of factors: the road user, the vehicle and the road surface (Campbell et al., 2012). After an accident, it is not always possible to clearly reconstruct which factor caused the accident, and investigations are often imprecise and not objective. As a result, the analysis material available for subsequent accident analysis is incomplete. In addition, not all accidents are always recorded by the police. For example, single vehicle accidents have been observed to have a particularly high number of unreported cases. Consequently, near misses are frequently analyzed. The recording of these critical encounters on camera facilitates a more comprehensive analysis, enabling the identification of various factors that could potentially result in accidents (Laureshyn & Varhelyi, 2018). In fact, the analysis of traffic data, particularly trajectory data, at the microscopic level enables a more in-depth analysis of specific situations. This allows to understand the behavior of traffic participants and how the various road users interact with each other in the rural environment. The latter is of particular concern, given that the rural road transport infrastructure tends to be underdeveloped and lacks dedicated space for vulnerable road users (VRUs).
The aim of this article is to investigate traffic behavior in rural areas and to enhance the understanding of rural traffic, particularly in terms of traffic safety. To this end, a mobile measurement station is utilized to conduct two measurement campaigns, each lasting two weeks, at two rural sites. The mobile station enables continuous collection of traffic data over the entire period, thereby providing a comprehensive picture of traffic conditions through trajectory data and anonymized video footage. This material is used to analyze traffic in its broader sense, including aspects such as traffic volume, route usage, and speed distribution. It is also utilized to examine specific traffic safety concerns, particularly in overtaking and crossing scenarios involving both, vulnerable and motorized road users (MRUs). The remainder of this paper is structured as follows: The two measurement sites and relevant methods that are used for traffic data acquisition and analysis are presented in Section 3. The results of the study are presented in Section 4 and discussed in Section 5. Finally, a conclusion in drawn and an outlook on future work is given in Section 6.
2. Materials and methods
To analyze the behavior of traffic participants in rural areas, two measurement campaigns were conducted. The first campaign focused on a rural intersection, while the second focused on a village entrance. The mobile measurement unit used for traffic observation (Knake-Langhorst & Gimm, 2016), both measurement sites and the utilized traffic analysis methods will be briefly described in the following.
2.1 Traffic observation
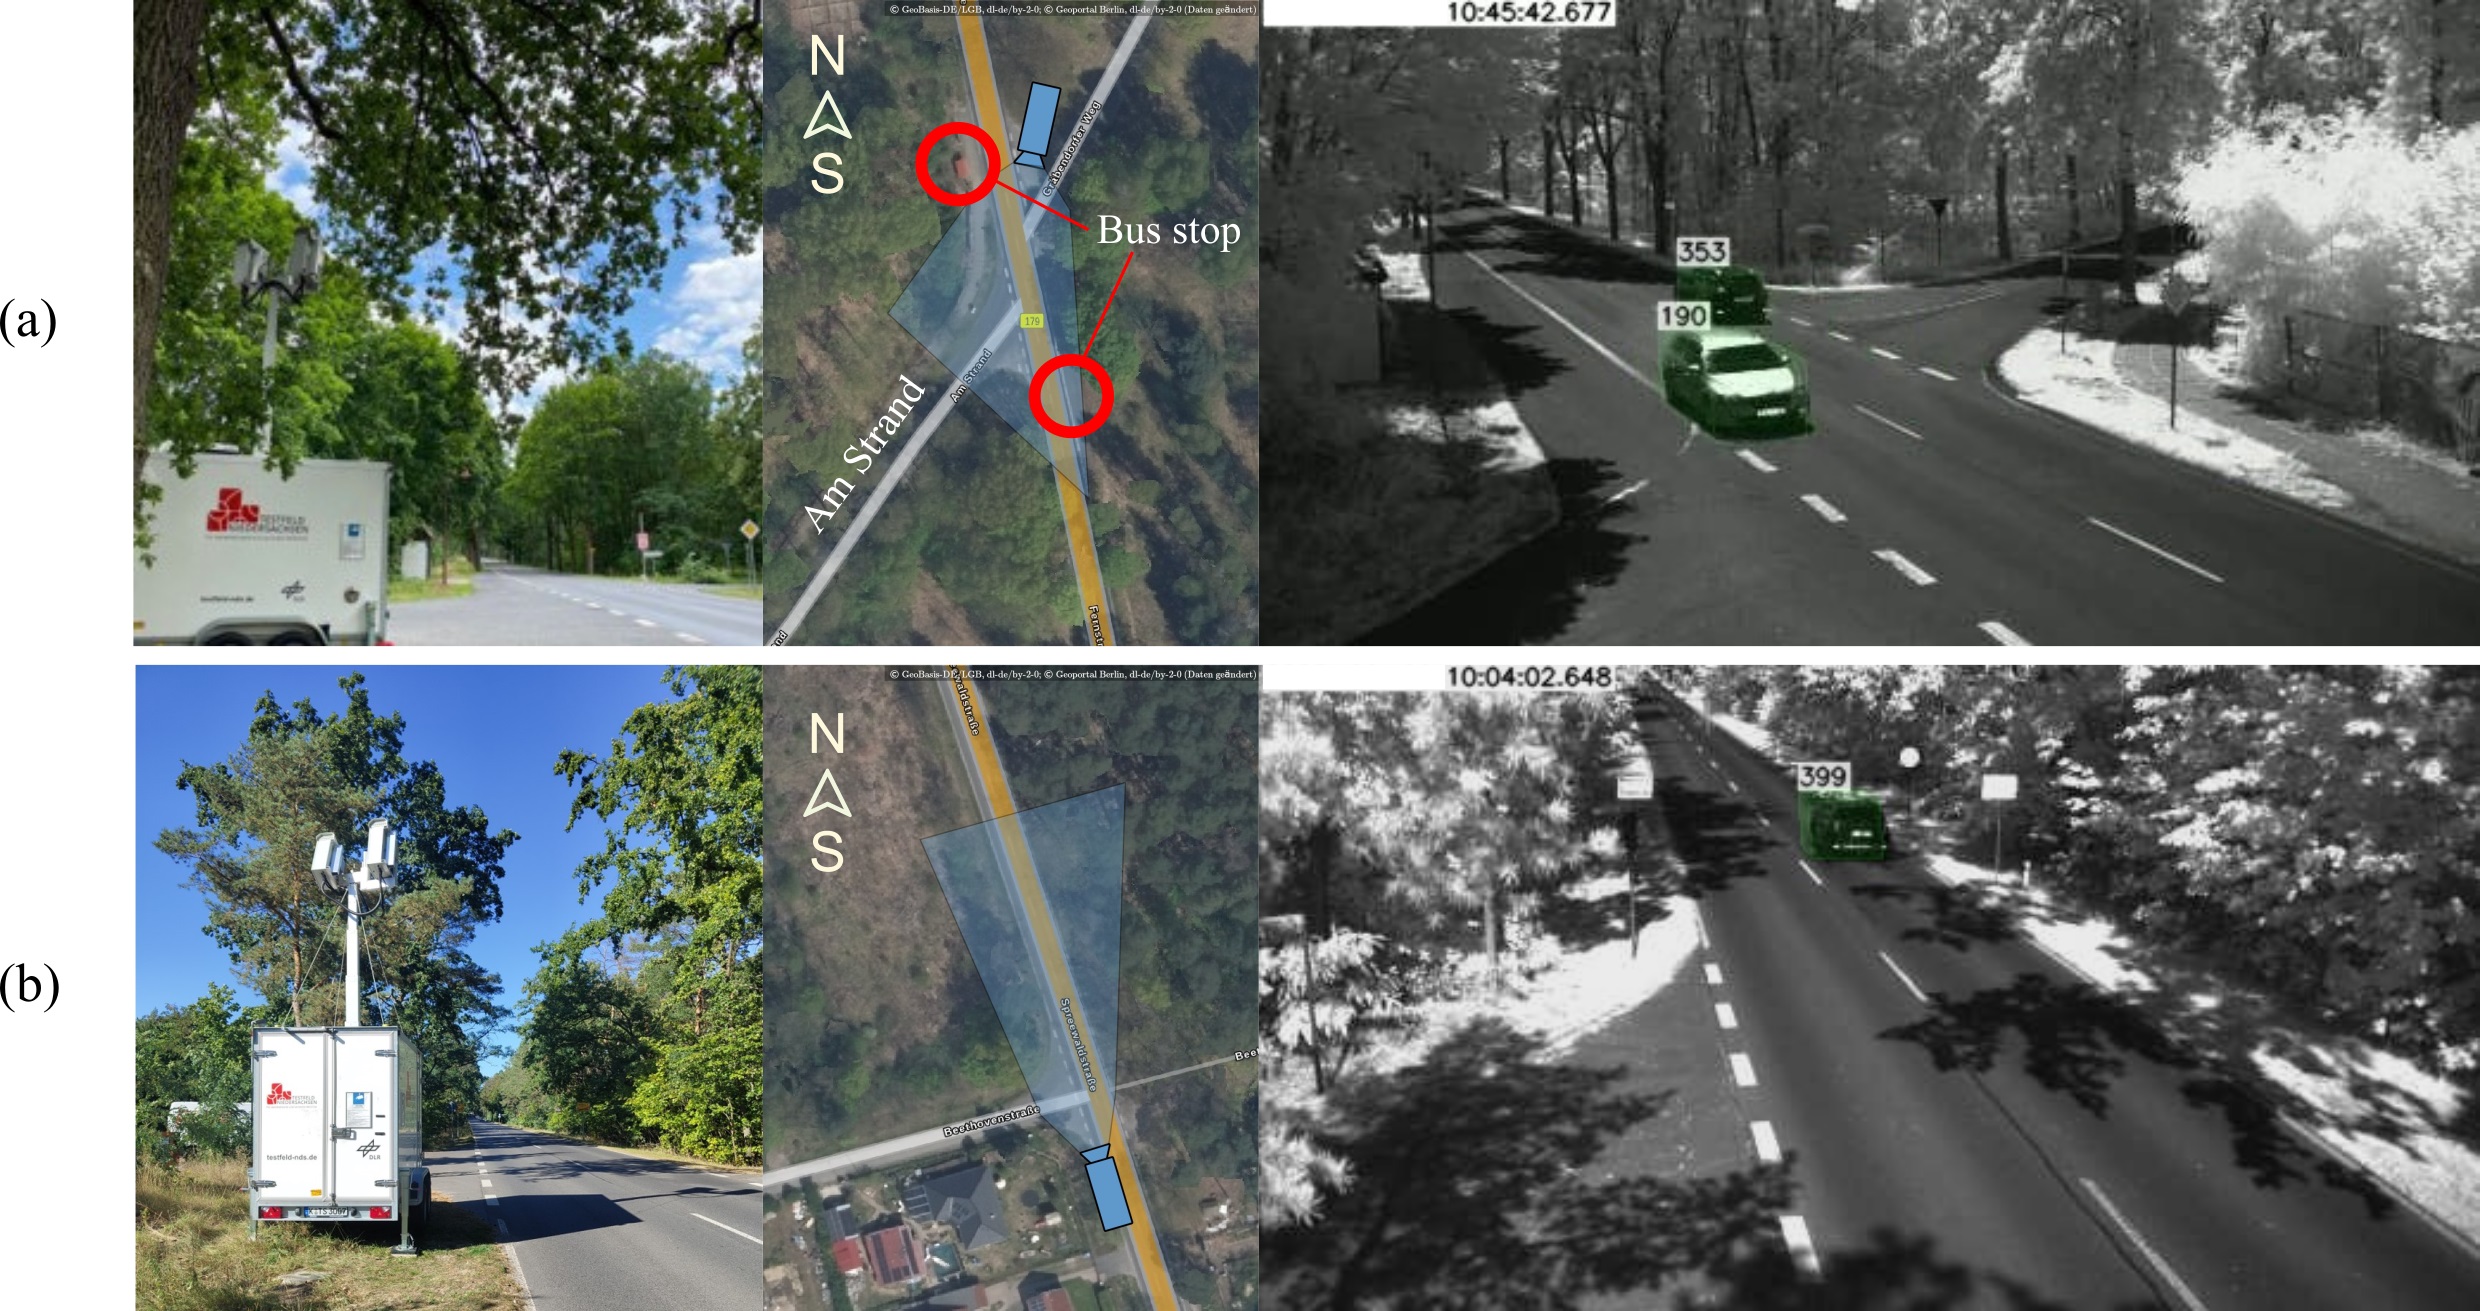
A mobile measurement system from DLR was used for data collection (see left columns of Figure 1). It allows to continuously record traffic data during day and night-time under various weather conditions. Two sensor systems are mounted on a telescopic mast, which can be extended to a length of up to 8 meters. Each sensor system consists of a stereo camera for vision-based traffic data collection and an infrared flash. The latter enables to operate in adverse lighting conditions, including dusk and night. The server infrastructure inside the trailer processes the images captured by the sensor system and detects, tracks and classifies motorized road users (MRUs) and VRUs, producing anonymized trajectory data and video material. Motorized road users are classified as either car, van, truck or other narrow vehicles including motorbikes. VRUs are classified as either cyclists or pedestrians. However, due to technical challenges during the measurement campaign, pedestrians could not be detected robustly. Consequently, the following analysis about VRU and MRU interactions includes cyclists only, with narrow vehicles excluded to minimize ambiguity. The trajectory data contains information on the position in Universal Transverse Mercator (UTM) coordinates, velocity in km/h, orientation in degrees, and dimensions (length, width, height) of road users in meters. The video material is monochrome and has low resolution, which enables traffic situation reconstruction, while license plates and faces remain unrecognizable.
2.2 Study Sites
The two selected measurement locations are situated on the Federal Road 179 in Brandenburg, Germany, south of Berlin (see Figure 1). We will describe both measurement sites in more detail in the following.
2.2.1 Pätz
The first location is situated in an urban area with a speed limit of 50 km/h. Within the measurement area, there is an intersection without traffic lights where traffic on the main road has priority. As one travels north towards Bestensee, the development increases, while heading south leads to the end of the village. Development on the sides decreases sharply and is almost non-existent. To the southwest lies the village of Pätz and a lake. In the eastern area of the intersection (see right panel of Figure 1 (a)), there is a bus stop that is not accessible by footpaths. Another bus stop is located north of the intersection, as indicated by the red building in the middle panel of Figure 1 (a). A footpath begins at that bus stop and proceeds west following the road Am Strand. Besides that, no additional infrastructure exists for VRUs. The focus of this location is to analyze the behavior of traffic participants at a rural intersection. The measurement campaign took place over a two-week period at 03–16 July 2023.
2.2.2 Bestensee
The second measuring site is located at the town sign of Bestensee with a speed limit of 50 km/h (see Figure 1 (b)). Similar to the first location, there is an intersection without traffic lights, and traffic on the main road has priority. There is no additional infrastructure for vulnerable road users along the federal road. Whereas the focus of the first location was on the intersection, the second location measurement area covers the village entrance. Specifically, the analysis at this location concentrates on driving behavior when entering and leaving Bestensee. The maximum speed allowed for the extra-urban area is 70 km/h. The measurement campaign took place over a two-week period from 25 September until 08 October 2023.
2.3 Traffic Analysis
To analyze the behavior of traffic participants at both measurement locations, the traffic data provided by the measurement station is semi-automatically processed according to specific scenarios. In the following section, we will explain the methods used for scenario identification, extraction and analysis, also referred to as scenario mining by (Gelder et al., 2020). The methods used are chosen based on the specific needs of each measurement site, which we present separately.
2.3.1 Data preprocessing
The measurement station provides trajectories of the detected traffic participants and video materials with annotated traffic participants. After the measurement campaigns, the trajectory and video data are persistently stored in a database. For both measurement sites, the Rauch-Tung-Striebel Kalman smoother (Rauch et al., 1965) is applied for trajectory smoothing. In addition, traffic participants are categorized according to their route to cross the intersection, which will be discussed for each measurement site in the following.
2.3.2 Pätz
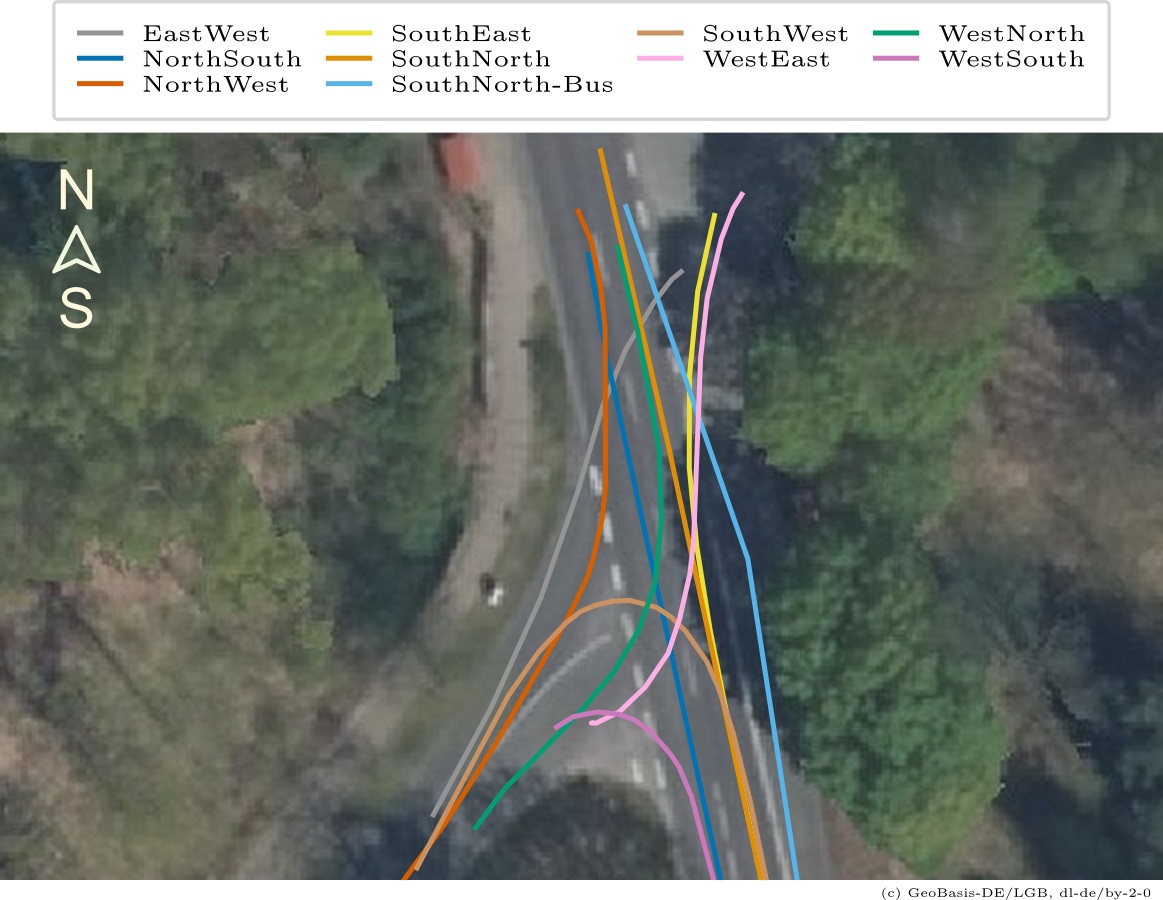
To associate traffic participants with routes for the measurement site Pätz, we derived typical routes using trajectory data. We assume that each route is represented by traffic participant on a daily basis. Therefore, we use the traffic data from the first day of measurement to find the standard routes. Figure 2 shows the measurement site, with each route represented by a trajectory that serves as the reference lane for that route. Every route is named by the direction of entry and exit at the intersection. These reference lanes are used to automatically associate traffic participants with the routes using a map-matching-based approach from (Klitzke, Schicktanz, et al., 2022). This approach is also applied to the other days of the measurement campaign, while the results are visually verified using both trajectory data and video material.
To analyze traffic data with respect to traffic safety, we extracted scenarios, in which the trajectories of traffic participants cross each other. These scenarios were extracted from the reference lanes and the routes that are illustrated in Figure 2. Traffic participants are considered to be involved in a crossing scenario, if their routes differ in the direction of entry and exit, and their reference lanes intersect geometrically.
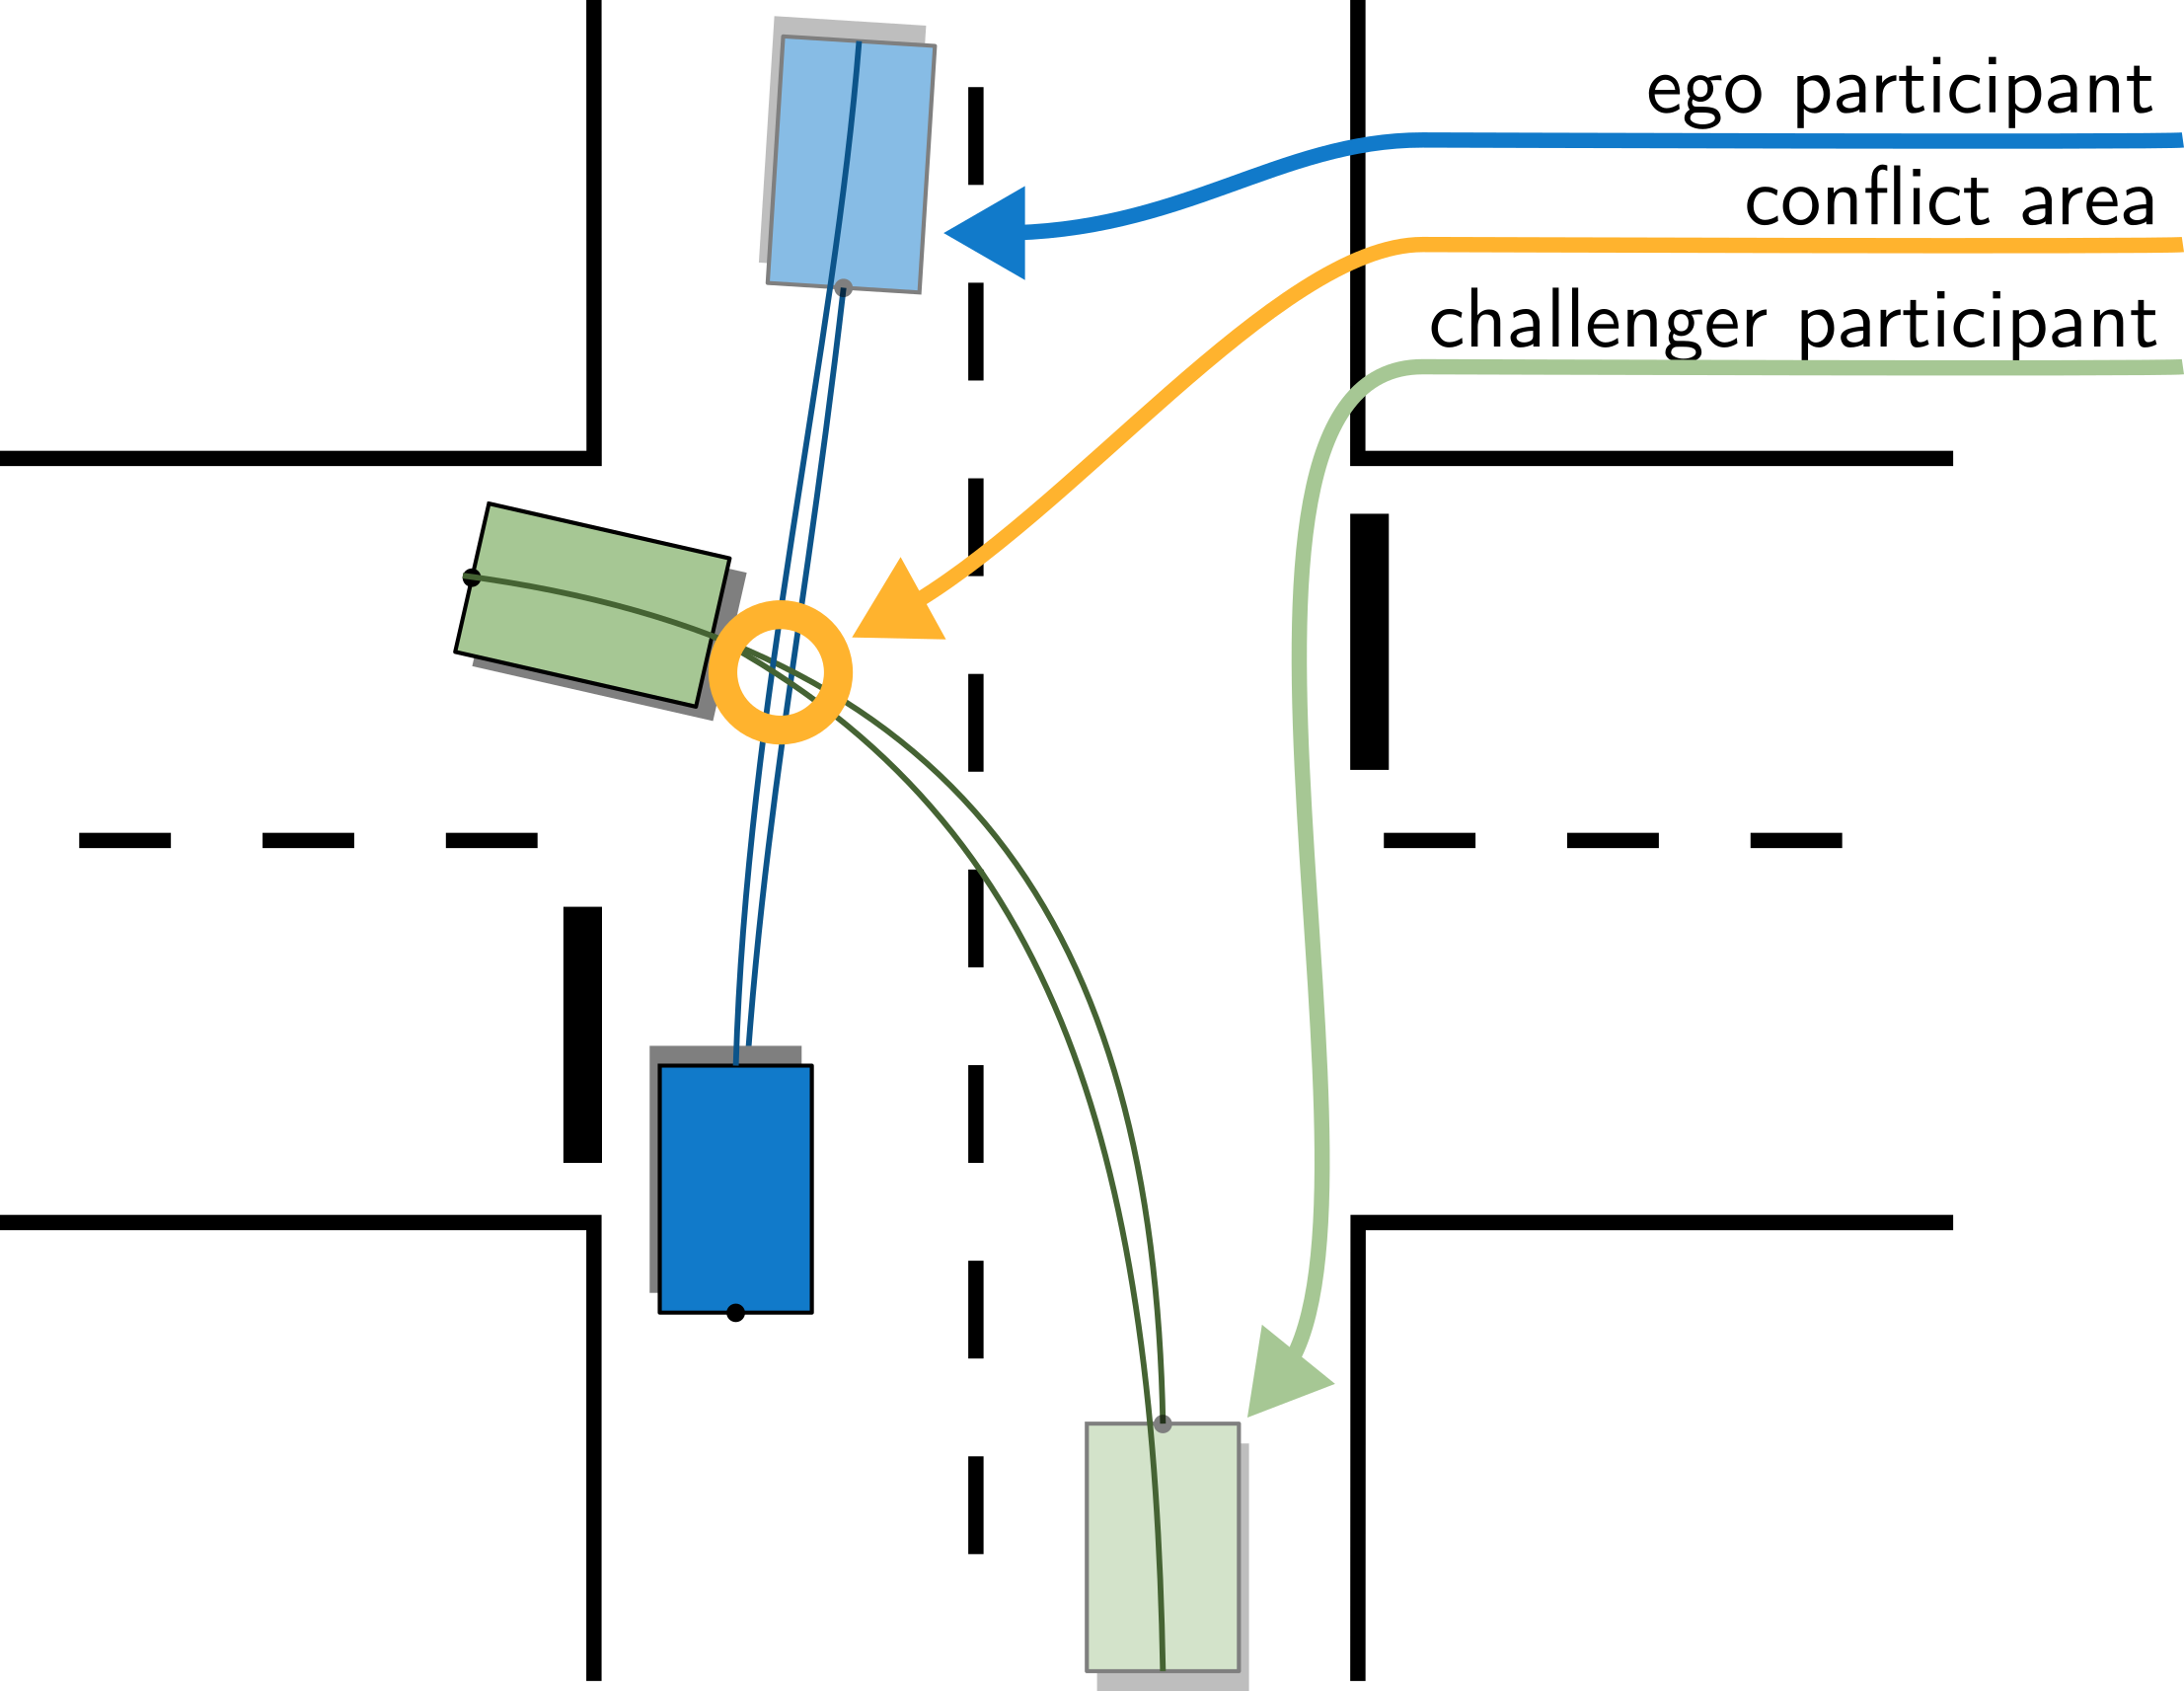
For every crossing scenario, the Surrogate Measure of Safety (SMoS) Post Encroachment Time (PET) is calculated as a measure to evaluate the situation in terms of traffic safety. The PET defines the time difference between the first object entering and the second object leaving the conflict area (Gettman & Head, 2003). We follow the approach for PET estimation from (Klitzke, Gimm, et al., 2022). That is, let the first object be the ego participant and the second object the challenger participant. The PET between the ego and a challenger participant is derived from four intersection points (see Figure 3). These are obtained by considering pairs of the rear and front trajectories of the vehicles on the center axis. Figure 3 illustrates a crossing scenario with the ego participant crossing the intersection straight and the challenger participant turning left. The trajectory for each traffic participant and position (front, rear) are illustrated. The four intersection points between both traffic participants are located in the conflict area defined by the yellow circle. The four-point measurement of the PET is used to accurately represent the time gap between both traffic participants, regardless of whether the ego participant or the challenger leaves the conflict area first.
Formally defined, let P = [p1,p2,p3,p4] be the four intersection points between a challenger 𝒞 and the ego participant. Furthermore, let ΔT𝒞 = [Δt1,Δt2,Δt3,Δt4] be the time difference of the ego participant leaving and the challenger entering each intersection point, such that Δti ∈ ΔT𝒞 is the time difference of the ith conflict point pi and defined as
\begin{eqnarray*} \Delta t_i = t_{{ego}_i} -t_{\mathcal{C}_i}\tag{1} \end{eqnarray*}with tegoi the time of the ego participant leaving the conflict point pi. Note that Δ ti is negative if the ego participant leaves the crossing point before the challenger and positive vice versa. Given the time differences T𝒞 and the definition from (1), the PET(𝒞) between the ego participant and the challenger participant 𝒞 is defined as
\begin{eqnarray*} PET(\mathcal{C}) = \underset{\Delta t\in\Delta T_{\mathcal{C}}}{\arg\min|\Delta t|}\tag{2} \end{eqnarray*}with |Δ t| the absolute time difference. The PET value is utilized for scenario filtering, such that scenarios are considered in the analysis if the absolute PET between traffic participants is lower than ten seconds. Note that this threshold was set relatively high on purpose, to cover all potential relevant scenarios.
2.3.3 Bestensee
The focus of the second measurement site Bestensee is on the analysis of driving behavior entering and leaving the village. The cameras were positioned to put the town entry into focus, neglecting the intersection area. Due to this, there are fewer routes that traffic participants can follow at the measurement site. Figure 6 illustrates the measurement site, with example trajectories of traffic participants associated to the four routes in the left panel. Note that the system does not detect traffic participants that are coming from south and turning left towards west and that turn right coming from west, because of camera system’s field of view.

The approach used for map-matching at the measurement site Pätz was not able to consistently link traffic participants to their routes. This was due to the system's field of view. Traffic participants approaching from the west may only be detected once they have already entered the main road. Instead, a decision-tree based approach is employed for route association. That is, traffic participants are classified according to their orientation while entering and leaving the intersection. To achieve this, the trajectories are projected onto the reference line NorthSouth illustrated in the right panel of Figure 4. This facilitates the differentiation of road users who are associated with the two straight ahead routes since they travel in opposite directions. The same applies to traffic participants associated with the NorthWest and WestNorth route, as they also travel in opposite directions and have significantly different headings from traffic participants driving straight ahead. We trained the decision tree using manually annotated traffic participants of the first day of measurement. This approach is applied to the other days of the campaign and visually inspected using the trajectory data and video material.
At the second measurement site we analyze the overtaking behavior of traffic participants since vulnerable and motorized road user share the available infrastructure. The overtaking scenarios are detected by representing traffic data using the primitive-based representation as shown in (Klitzke et al., 2020) for the extraction of lane-change maneuvers. A primitive is a trivial driving action or an attribute to describe the relationship between traffic participants or a traffic participant and other entities such as roads, traffic signs, etc. In (Klitzke et al., 2020) the lane-change maneuver is decomposed in multiple states, with each state being a primitive. To identify overtaking scenarios, we employ the projection of traffic participants on the two manually annotated reference lines shown in the right panel of Figure 4. Note that the center position is used as reference point. The longitudinal component of the trajectory represents the offset on the reference lane relative to the town sign shown in Figure 4. It is utilized to categorize parts of trajectories as being either inner-city or outer-city and to represent the relationship between two traffic participants as either in front, behind or next to. The lateral component represents the displacement to the lane. It is assumed that a traffic participant overtakes another one if it is behind before and in front after the maneuver. Furthermore, the lateral component is used to state whether both traffic participants are either level with or one of the traffic participants is left of another one. In addition to the two conditions mentioned before, it is assumed that a traffic participant overtakes another one if it is left of that traffic participants during the maneuver. We assumed that a traffic participant is left of another traffic participant if the lateral displacement is greater than 3.5 meters. The parameter was chosen using trajectory data and video material of the first day of measurement by visually inspecting overtaking scenarios.
3. Results
In the following, the analysis results for both measurement sites are shown. This includes a general traffic- and speed distribution of both sites, as well as the intersection behavior at the measurement site Pätz and the overtaking behavior at the measurement site Bestensee. Finally, we present rare phenomena that are related to traffic safety identified in the data.
3.1 Traffic distribution
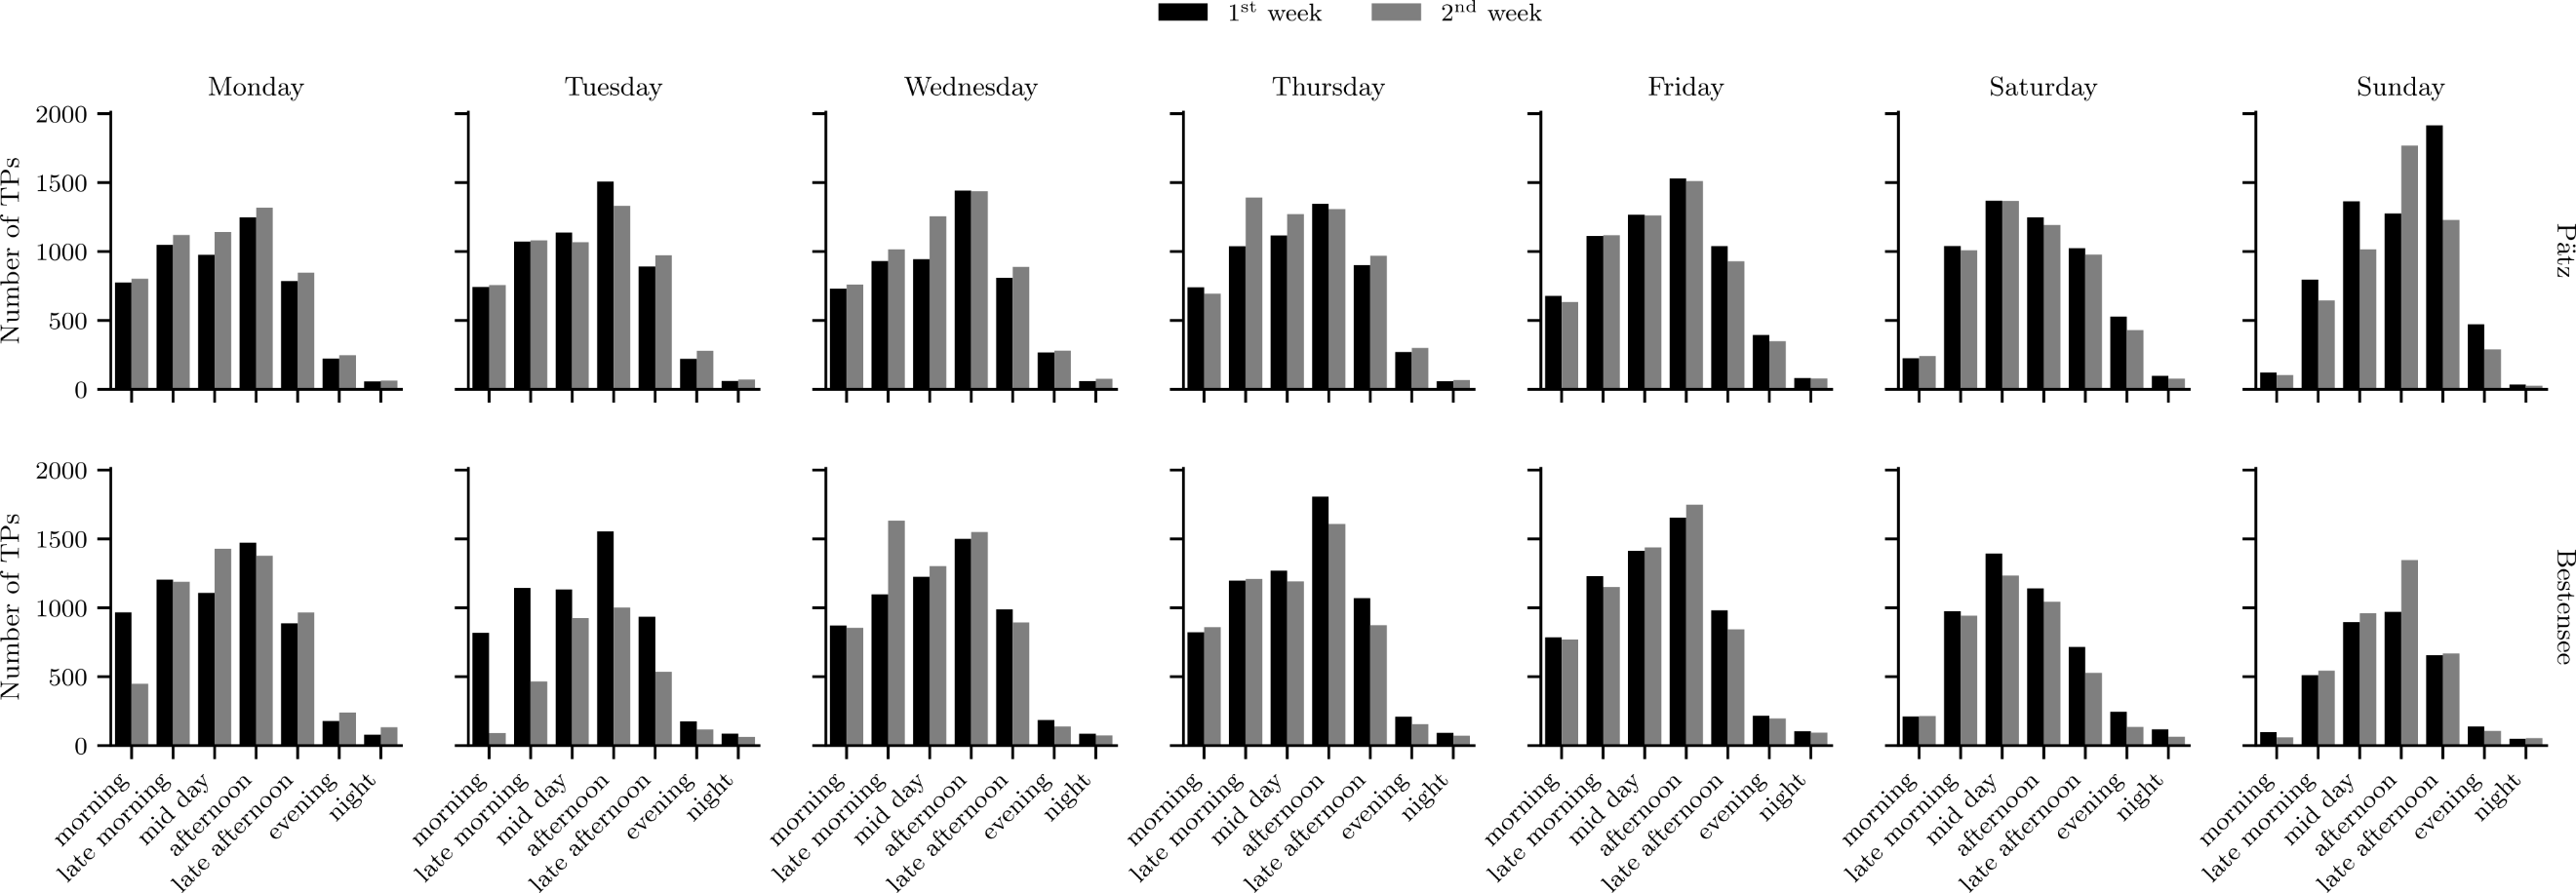
During the campaign at the measurement site Bestensee, a total number of 74,231 motorized road users (MRUs) and 516 vulnerable road users (VRUs) were recorded. Similar numbers were recorded for the measurement site Pätz with 78,087 MRUs and 281 VRUs. An overview of the overall daily traffic distribution for both campaigns is shown in Figure 5. The number of MRUs for the first measurement campaign Pätz is shown in the first row and for the second measurement site Bestensee in the second row. The traffic distribution is aggregated by the time of the day, while night spans six hours and all other times of the day three hours with morning starting at 6 a.m.
The daily overall traffic volume at the measurement site Pätz remains at a similar level, but with an increased volume in the (late) afternoon on Sundays. The first also applies to the measurement site Bestensee, but with an overall decreased volume on Sundays. The higher traffic volume on Sundays at the measurement site Pätz may be attributed to tourist traffic to the lakes, such as the Pätzer Vordersee. Video material shows vehicles parking on the road in the west of the intersection that leads to the lake (see Figure 6).
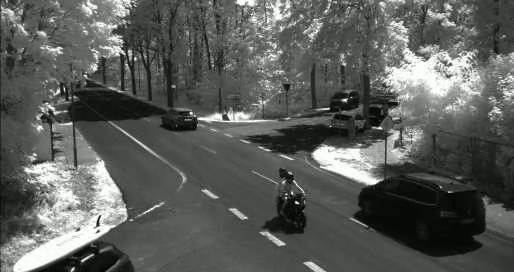
Figure 5 also shows that both measurement sites have a similar traffic volume distribution per day, except for Sundays. This is despite the fact that the first campaign took place at the beginning of July and the second at the end of September. This similar traffic volume may be attributed to commuter traffic, as both measurement sites are only about two kilometers away from each other. Worth noting is the difference in traffic volume on Tuesday of the second measurement site Bestensee, which is not the case for Pätz. This may be attributed to a public holiday on 03 October 2023, and thus a lower commuter traffic.
An overview of the mean traffic volume per hour is given in Table 1 for the different classes of traffic participants on weekdays. The majority of traffic participants are cars for both measurement sites, followed by vans for the site Pätz and trucks for the site Bestensee. It is worth noting that the highest traffic volume per hour for cyclists is observed at Sunday for both measurement sites. For the site Bestensee, the difference between Sunday and Monday, and Tuesday is only margin. This may be attributes to the holiday in the second week.
| Monday | Tuesday | Wednesday | Thursday | Friday | Saturday | Sunday | ||
|---|---|---|---|---|---|---|---|---|
| Bestensee | Bicycle | 7.55 ± 6.14 | 7.75 ± 4.81 | 4.33 ± 3.42 | 4.73 ± 3.41 | 2.33 ± 1.83 | 3.64 ± 2.46 | 8.2 ± 6.53 |
| Car | 448.75 ± 352.28 | 347.33 ± 294.8 | 465.25 ± 375.18 | 470.38 ± 381.76 | 480.29 ± 388.35 | 354.12 ± 321.59 | 282.17 ± 289.98 | |
| Truck | 29.54 ± 23.24 | 23.65 ± 17.68 | 41.17 ± 34.0 | 37.83 ± 35.24 | 36.43 ± 28.21 | 14.91 ± 11.03 | 9.81 ± 8.44 | |
| Van | 9.62 ± 7.3 | 8.5 ± 6.57 | 14.5 ± 10.85 | 12.86 ± 10.33 | 13.15 ± 8.38 | 6.15 ± 4.07 | 4.2 ± 3.14 | |
| Pätz | Bicycle | 2.4 ± 1.65 | 2.38 ± 2.06 | 1.55 ± 0.69 | 2.18 ± 0.75 | 2.1 ± 0.99 | 3.86 ± 3.32 | 4.2 ± 3.19 |
| Car | 418.95 ± 273.53 | 439.27 ± 288.92 | 427.59 ± 278.79 | 450.41 ± 291.01 | 475.0 ± 304.93 | 450.0 ± 311.0 | 465.14 ± 405.8 | |
| Truck | 27.45 ± 19.74 | 28.14 ± 22.57 | 26.82 ± 21.44 | 29.77 ± 24.87 | 30.1 ± 22.82 | 12.62 ± 10.86 | 17.06 ± 13.44 | |
| Van | 42.14 ± 27.61 | 41.23 ± 29.92 | 41.0 ± 28.91 | 41.36 ± 27.85 | 41.05 ± 27.03 | 30.14 ± 22.32 | 26.85 ± 19.53 |
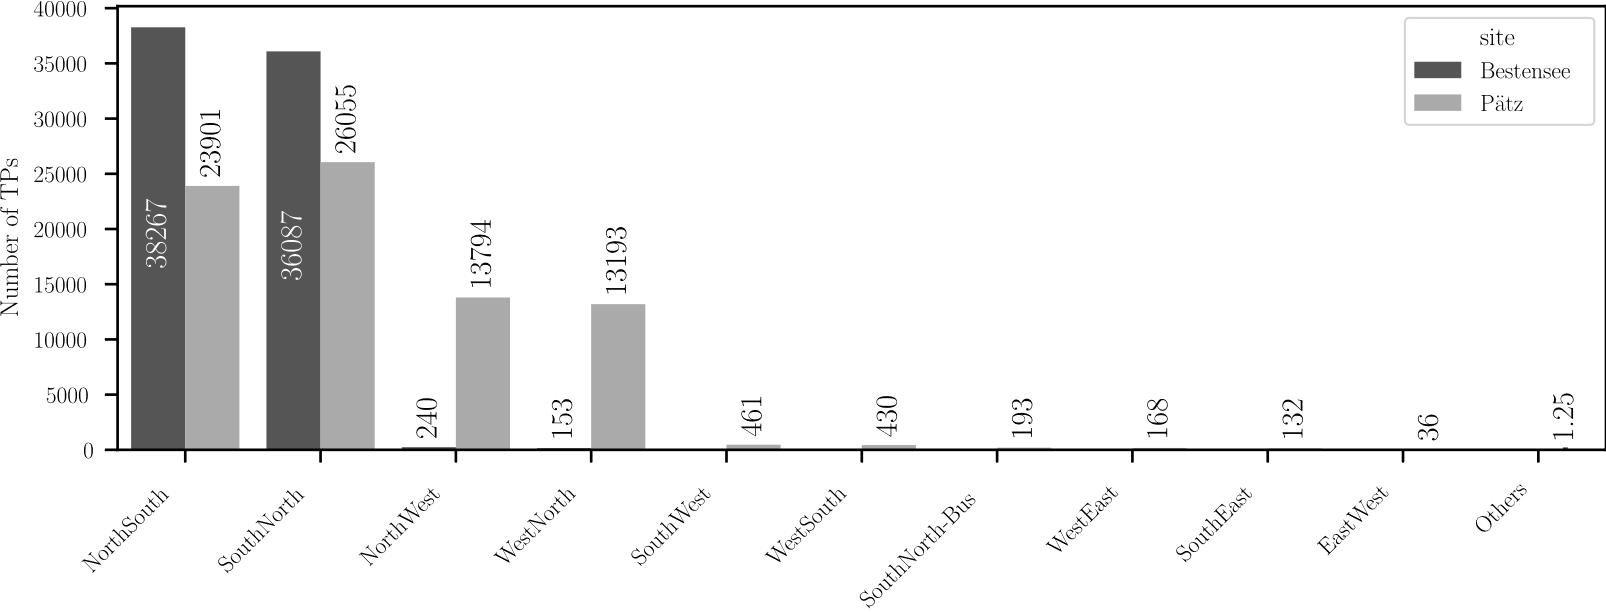
For both measurement sites, we also estimated the associations of traffic participants to routes. The traffic volume per route is shown in Figure 7. The two routes with the highest traffic volumes are SouthNorth and NorthSouth on both measurement sites. At the measurement site Bestensee, there is only a low traffic volume on the two other secondary routes. This is different at the measurement site Pätz with nearly a third of the overall traffic volume on the two routes NorthWest, WestNorth.
A more detailed overview of the daily traffic distribution on the two primary routes over the course of the day for both weeks is illustrated in Figure 8. The profiles represent the mean number of traffic participants per hour and day, with the shaded areas illustrating the 95% confidence interval. The first row shows the number of traffic participants for the measurement site Pätz and the second for Bestensee. The NorthSouth route has its peak on weekdays in the afternoon for both measurement sites and at mid-day on the weekend. The SouthNorth route's peak on weekdays is in the late morning, whereas the peak is higher for the measurement site Bestensee than for Pätz.
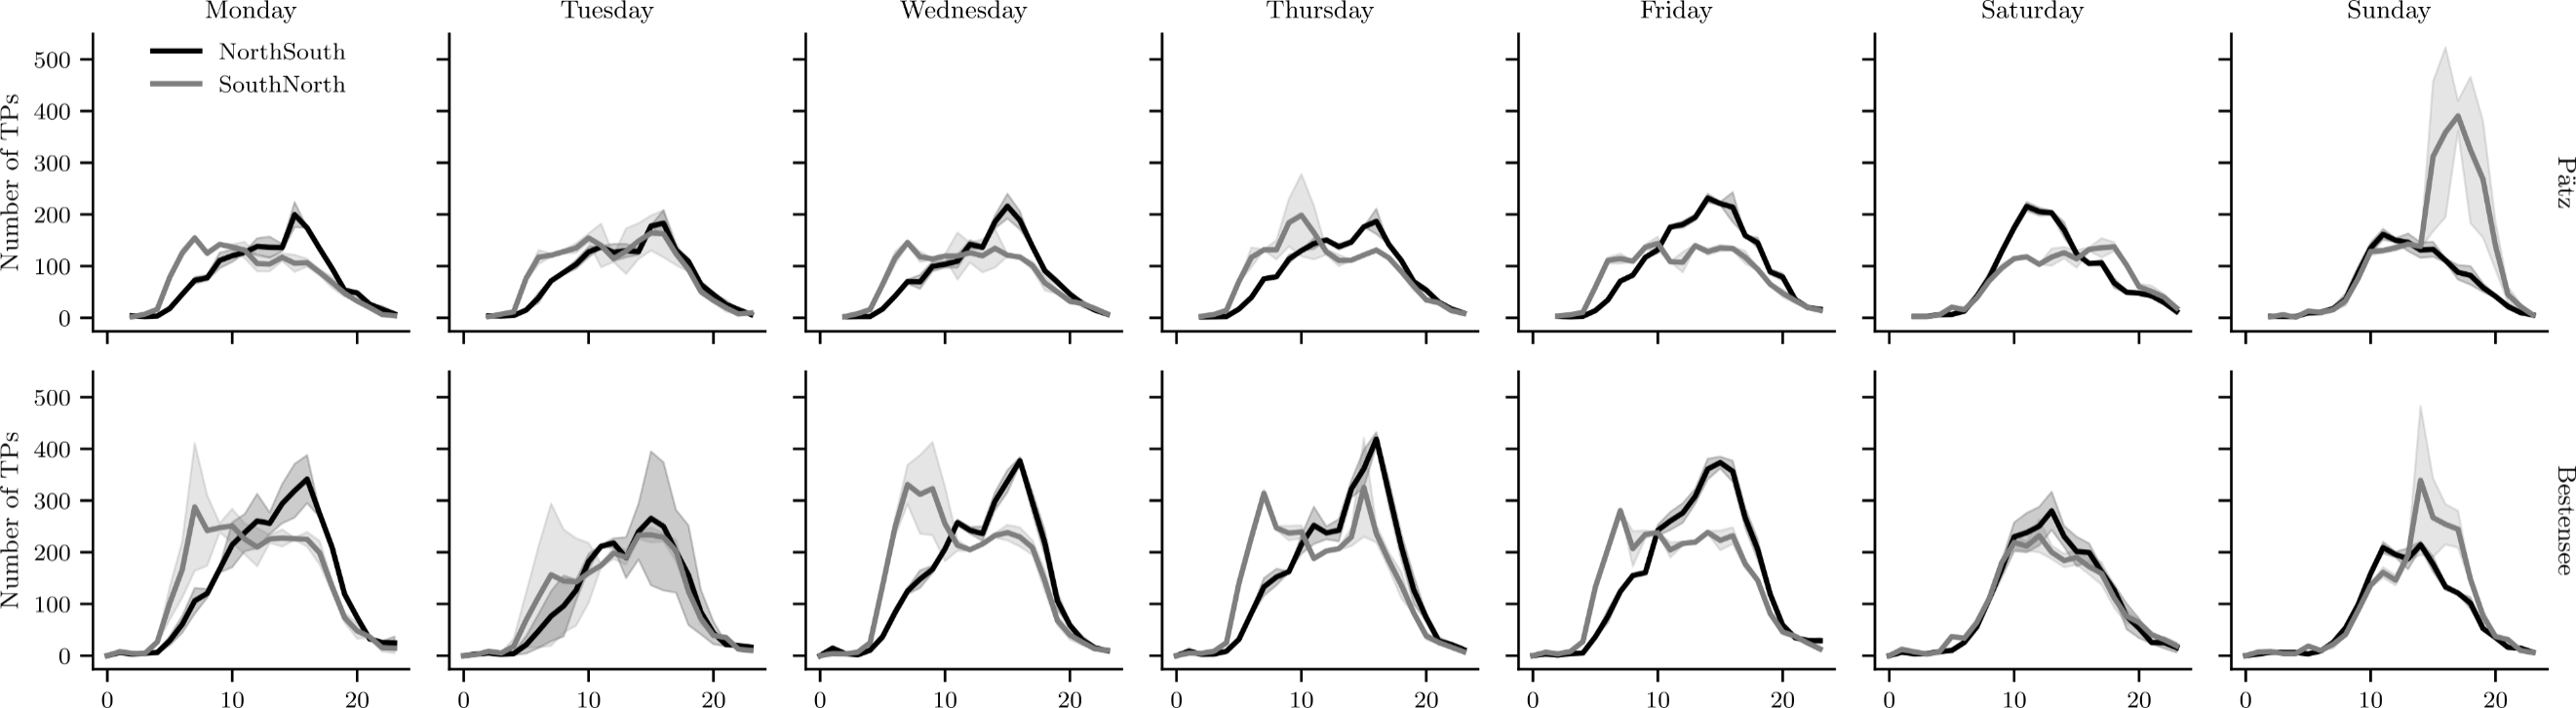
The difference in the course of the number of traffic participants between weekdays and weekends may be attributed to commuter traffic. Traffic participant may use the SouthNorth route to commute to work before noon and the route NorthSouth to commute home after noon. To assess whether the route, daytime and site have an effect on the traffic volume, a negative binomial generalized linear model was fitted. We chose the model because traffic volume data often exhibits overdispersion. The Negative Binomial distribution has been demonstrated to be a robust method for analyzing such data, providing a more accurate fit than a standard Poisson model. The model was estimated based on 1,536 observations for weekdays, with each observation being the average traffic volume per hour. It should be noted that observations from Tuesday were excluded from analysis due to the public holiday that occurred during the measurement period at Bestensee. Given the focus on commuter traffic, the observations are grouped by daytime. The morning period is from 05:00 to 10:00, and the afternoon period from 14:00 until 20:00. The model demonstrates a strong fit, with a Pseudo R2 = 0.712, indicating that approximately 71.2% of the variance in traffic volume is explained by the predictors.
Table 1 presents the results of four distinct hypothesis t-tests based on the fitted model. Each test examines the difference in traffic volume between morning and afternoon for specific site and route combinations. The coefficients represent the estimated difference on a logarithmic scale between morning and afternoon traffic, with negative values indicating higher afternoon traffic volume. The findings indicate that for the NorthSouth direction, traffic volume is significantly higher in the afternoon than in the morning at both Bestensee (β = −0.8677, p < 0.001) and Pätz (β = −0.8373, p < 0.001). However, this correlation is not observed in the SouthNorth direction. There is no significant difference in traffic volume between morning and afternoon. Thus, it can be concluded that the hypothesis of commuter traffic is only partially confirmed. There is a significant increase in traffic volume on the NorthSouth route during the afternoon compared to the morning. But, there is no evidence to suggest that SouthNorth route experiences commuter traffic during the morning.
| Condition | β (log-ratio) | p-value | 95 % CI | Conclusion |
|---|---|---|---|---|
| Morning vs. Afternoon at Bestensee on route NorthSouth | −0.8677 | < 0.001 | (−0.942, −0.793) | Significant (Afternoon > Morning) |
| Morning vs. Afternoon at Pätz on route NorthSouth | −0.8373 | < 0.001 | (−0.916, −0.758) | Significant (Afternoon > Morning) |
| Morning vs. Afternoon at Bestensee on route SouthNorth | 0.0380 | 0.310 | (−0.035, 0.111) | not significant |
| Morning vs. Afternoon at Pätz on route SouthNorth | 0.0068 | 0.863 | (−0.071, 0.084) | not significant |
3.2 Traffic velocity
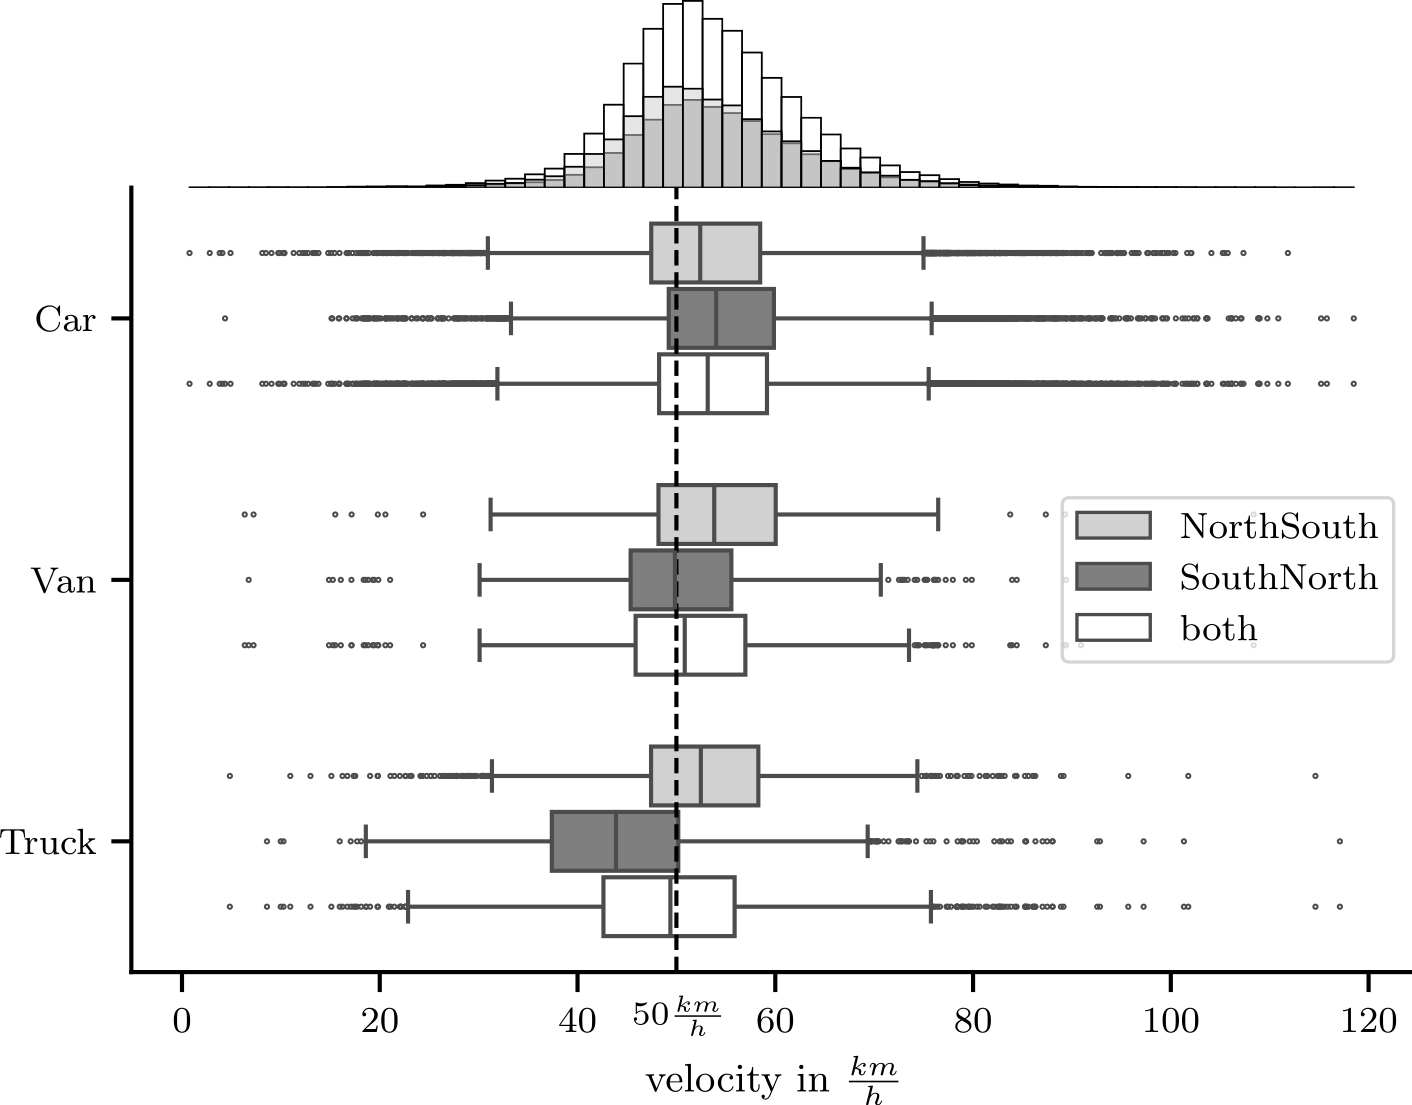
Due to the rural characteristics of the measurement site Bestensee, we analyzed the velocity of traffic participants travelling out of town and into town. The velocity distribution of the MRUs on the main routes at the measurement site Bestensee is illustrated in Figure 9 indicating that the velocity depends on the traffic participant type and the travelling direction. Overall, traffic leaving the town is slightly faster than traffic entering the town with a mean velocity of 54.32 ± 9.47 km/h and 53.25 ± 9.32 km/h. The majority of traffic participants (64.85%) to not adhere to the speed limit of 50 km/h, with 21.74 % driving faster than 60 km/h and 4.91 % faster than 70 km/h.
To assess whether there is a significant effect of the traffic participant class and direction on velocity, a two-way analysis of variance (ANOVA) was conducted using ordinary least squares (OLS) models. To evaluate the significance of each effect, Type II sum of squares were applied to account for interactions between direction and class. The fitted OLS model explained 2.2% of the variance in velocity (R2 = 0.0366, adjusted R2 = 0.036). Type II ANOVA revealed significant main effects of direction (F(1, 65068) = 218.32, p < 0.0001) and class (F(2,65068) = 532.70, p < 0.0001), as well as a significant interaction between direction and class (F(2, 65068) = 572.60, p < 0.0001). The findings indicate systematic differences in mean velocity across groups, with the interaction suggesting that the effect of direction varies by traffic participant class. Despite these highly significant effects, the relatively low R2 indicates that most variance remains unexplained. This may be due additional unmeasured factors.
Separate hypothesis tests were conducted to examine whether the change in velocity between the SouthNorth and NorthSouth directions was statistically significant within each vehicle class (see Table 2). The coefficients represent the estimated velocity difference between SouthNorth vs. NorthSouth, with negative values indicating lower velocity at the SouthNorth route.
The findings indicate that cars travel significantly but only marginally faster (Cohen’s d = 0.19) on the NorthSouth direction than on the SouthNorth route (β = 1.78, SE = 0.076, p < 0.001). The opposite holds for trucks (β = −8.03, SE = 0.288, p < 0.001) and vans (β = −3.25, SE = 0.556, p < 0.001) travelling significantly slower on the SouthNorth direction than on the NorthSouth direction, while the effect is stronger for trucks (Cohen’s d = 0.86) than for vans (Cohen’s d = 0.35). It can thus be concluded that the effect of travel direction on velocity is moderated by vehicle class, with cars driving marginally faster on NorthSouth direction, whereas vans and trucks drive significantly slower.
| Condition | β | p-value | 95 % CI | Conclusion |
|---|---|---|---|---|
| SouthNorth vs. NorthSouth for car | 1.78 ± 0.076 | < 0.001 | (1.632, 1.928) | Significant (SouthNorth > NorthSouth) |
| SouthNorth vs. NorthSouth for van | < 3.25 ± 0.288 | < 0.001 | (−4.345, −2.163) | Significant (SouthNorth < NorthSouth) |
| SouthNorth vs. NorthSouth for truck | −8.03 ± 0.556 | < 0.001 | (−8.595, −7.465) | Significant (SouthNorth < NorthSouth) |
3.3 Crossing behavior
The results thus far showed that the traffic at the measurement site Bestensee was mainly observed on the federal road and only a minority on the turning roads. In this work, traffic participants are assumed to be in a crossing scenario, if their trajectories geometrically intersect and their absolute PET is lower than ten seconds. At the measurement site Bestensee, we found only a few scenarios meeting this criterion. However, t the measurement site Pätz we found a vast number of crossing scenarios. Due to this, we will focus on the crossing scenarios observed at the measurement site Pätz.
Traffic participants following the WestNorth route may interfere with those that are on the NorthSouth route because they need to cross their path to turn. The left panel of Figure 10 shows the trajectories of traffic participants that turn left to merge onto the federal road from west. The figure shows a significant variation in the turning behavior of traffic participants. Those with a lower curve radius tend to steer towards the lane marking of the federal road, while those with a higher curve radius follow a more direct path to merge onto the federal road.
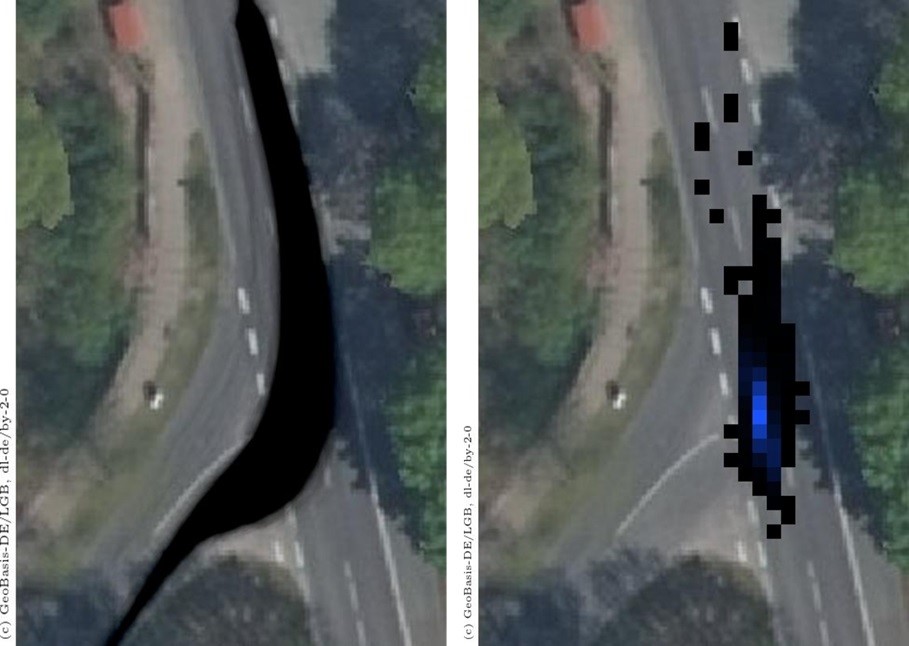
The right panel of Figure 10 also represents this variation in turning behavior by showing the crossing points of traffic participants involved in a crossing scenario. Crossing incidents are represented by blue color for higher numbers and black for lower numbers. The crossing points are widely distributed along the federal road, which may be due to turning behavior. However, the figure also shows that the most of crossing points are concentrated in a smaller area located in the middle of the intersection, rather than directly in front of the road coming from the west.
To analyze the crossing scenario in terms of traffic safety, we estimate the PET according to (2) between the traffic participants that are involved in such a scenario. The top panel of Figure 11 shows the distribution of the signed PET value of all crossing scenarios (N = 3,886). The sign of the PET value indicates the order in which traffic participants leave the conflict area. A negative PET indicates that the traffic participant following the WestNorth route leaves first, while a positive PET indicates that it leaves second. The figure shows that more crossing scenarios were observed, where the traffic participant following the WestNorth route turns before the traffic participant on the federal road (NorthSouth route).
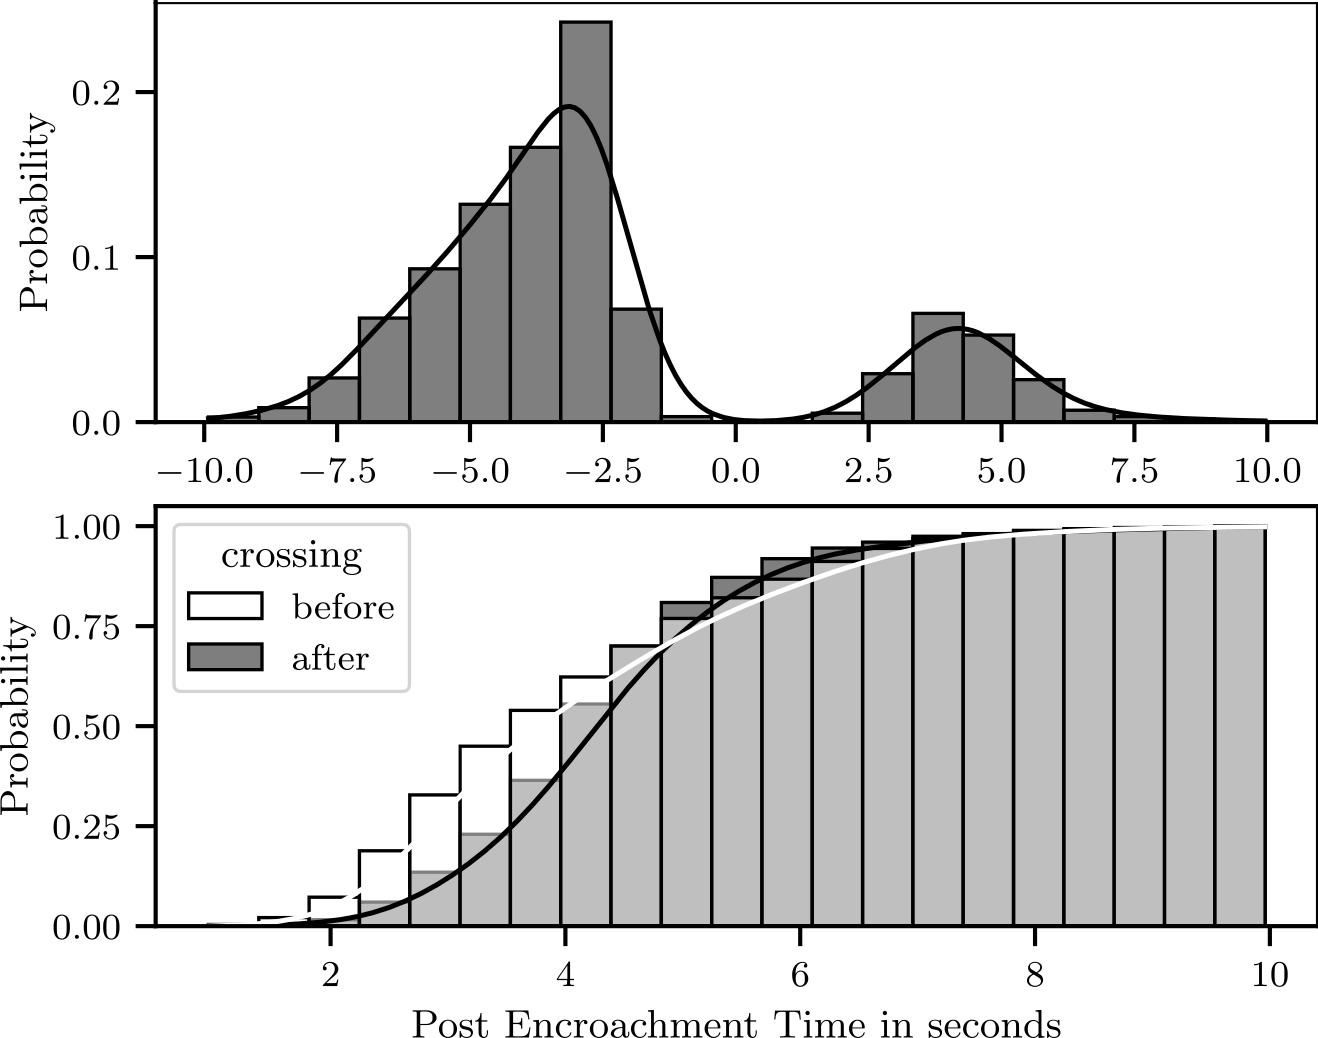
The result of classifying a crossing scenario according to the PET is shown in the bottom panel of Figure 11. The figure illustrates the cumulative distribution function of the PET for the two variants of crossing scenarios (before and after) separately. The PET of traffic participants turning first (before) is lower than turning second (after). Specifically, 3.76% of before and 0.93% of after have a PET lower than two seconds and 30.57% of before and 12.28% of after lower than three seconds.
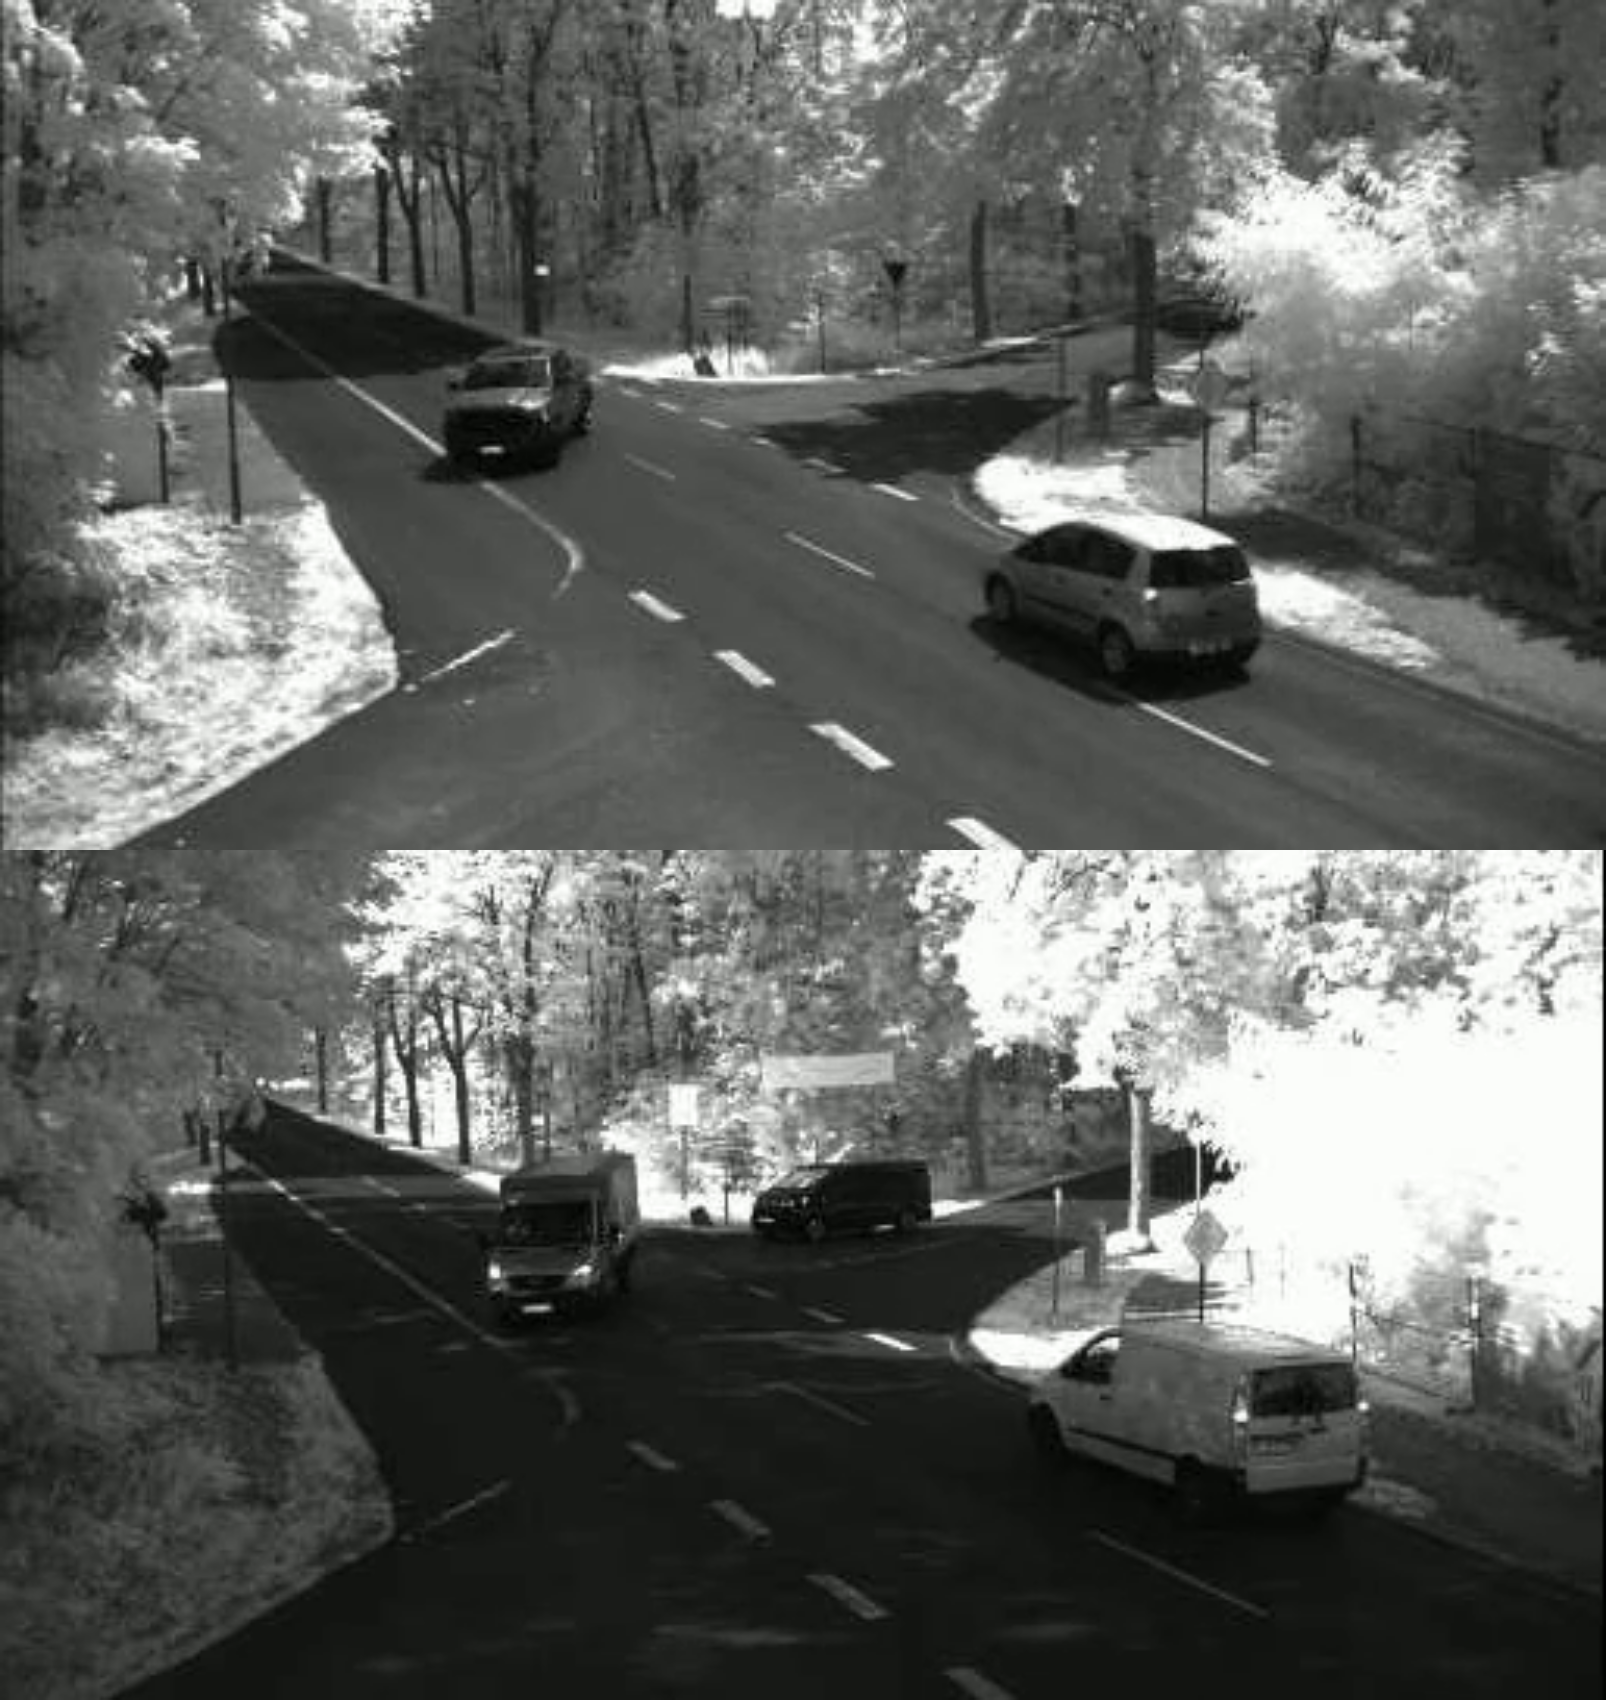
We manually analyzed a portion of the crossing scenarios with a PET lower than three seconds using video material. Our analysis revealed that in several situations, an accident was avoided because the road users on the federal road waived their right of way and actively prevented a critical situation by braking. Figure 12 shows two examples of such crossing scenarios. The active rear braking lights indicate the braking in both situations.
3.4 Overtaking behavior
At the Bestensee measurement site, we analyzed the behavior of traffic participants in overtaking scenarios. Our study focused on the distances between motorized road users (MRUs) overtaking each other and MRUs overtaking cyclists, as all traffic participants share the available infrastructure. During the measurement periods, we observed 399 overtaking scenarios. Out of these, 200 involved a MRUs overtaking cyclists heading into the village (on the NorthSouth route), while 129 involved a MRUs overtaking cyclists heading out of the village (on the SouthNorth route). Additionally, there were 15 scenarios of MRUs overtaking other MRUs on the NorthSouth route and 55 on the SouthNorth route. The mean lateral distance between the traffic participants during the overtaking scenario is illustrated in Figure 13. Kernel density estimation with a gaussian kernel was used to estimate the cumulative distribution functions (CDFs).
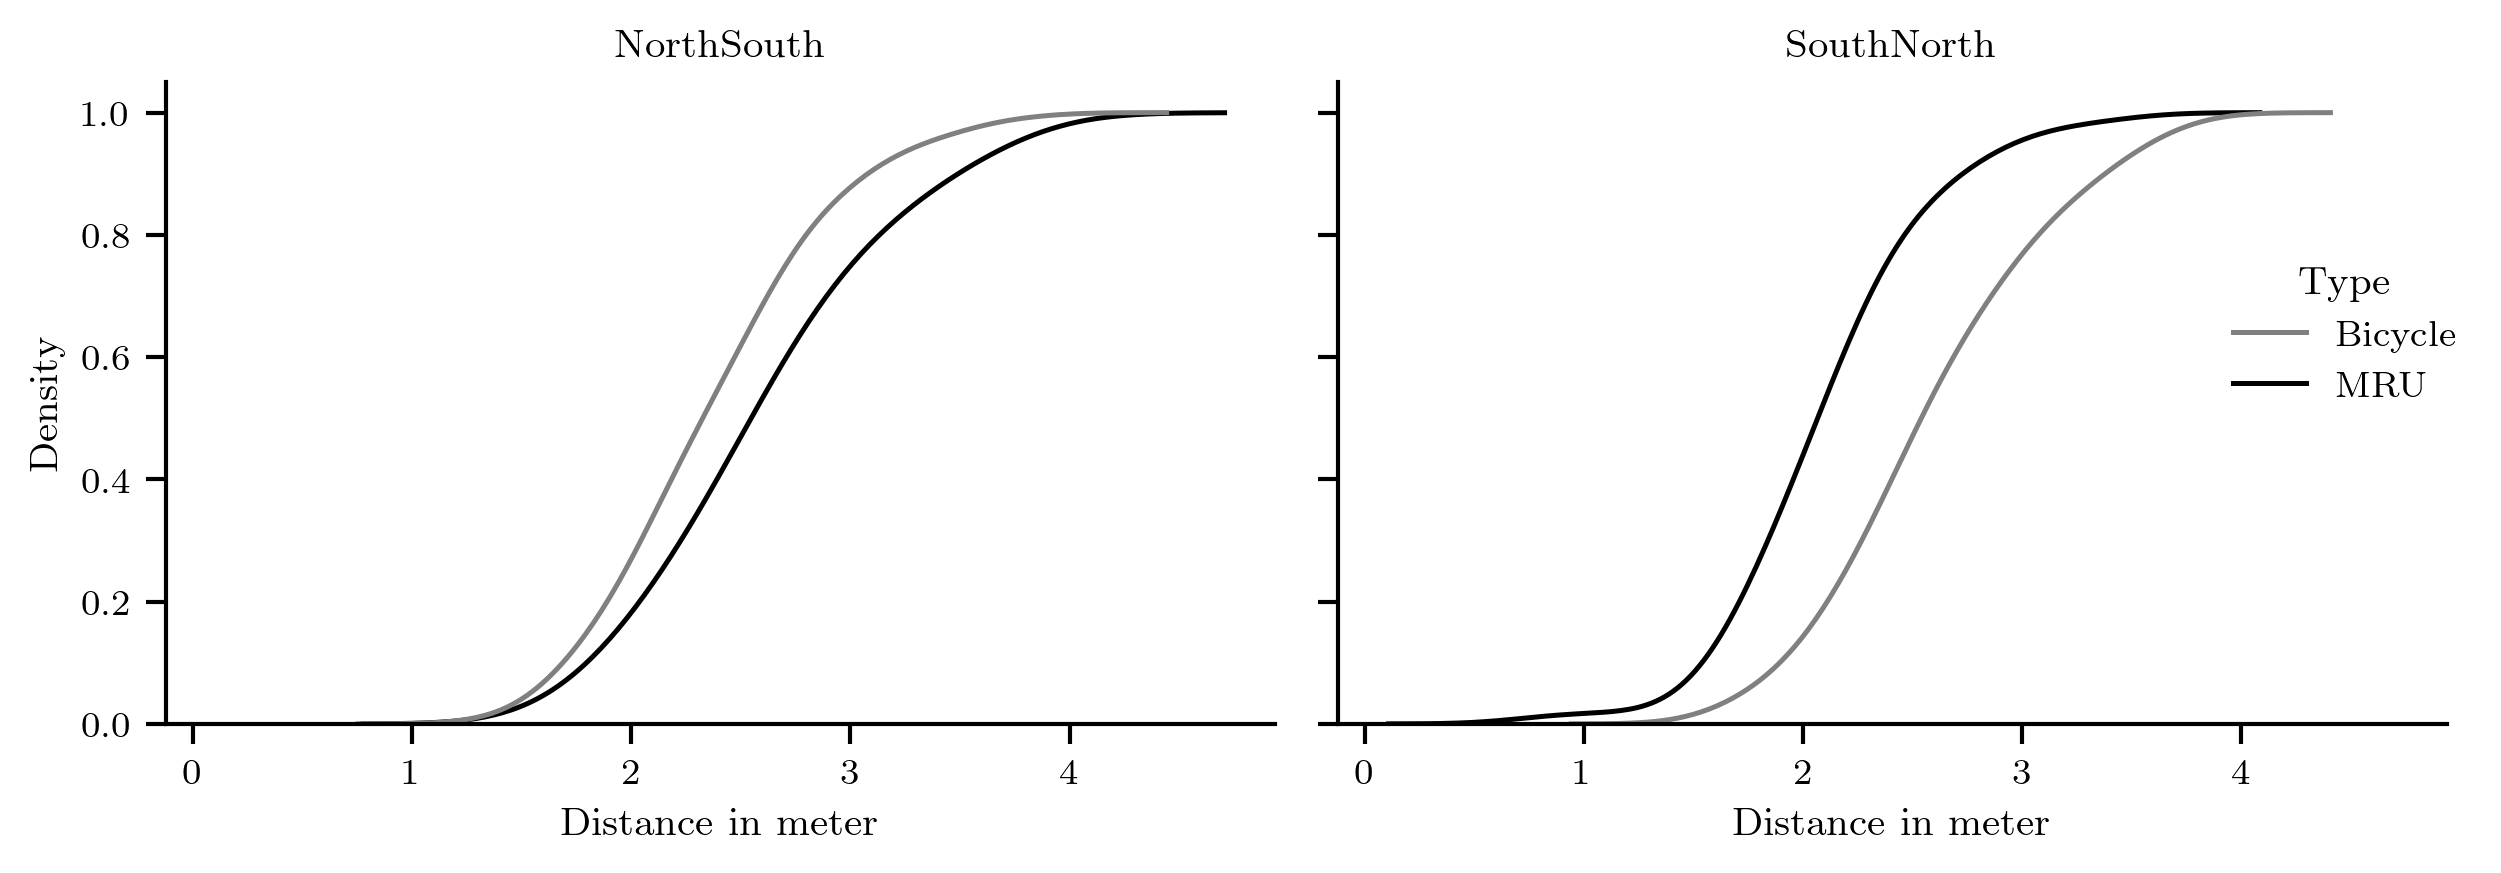
To assess the effect of direction and traffic participant class on the overtaking distance, a generalized linear model (GLM) with a Gamma distribution and log link function was fitted. The Gamma distribution was selected because of the shape of the CDFs illustrated in Figure 13. To assess whether the overtaking distances illustrated in Figure 13 are significantly different across direction and class, hypothesis tests were conducted (see Table 3). The analysis reveals that MRUs travelling out of town (SouthNorth route) maintained a significantly shorter overtaking distance when overtaking MRUs (β = −0.2131, SE = 0.062, p < 0.001) compared to travelling into town (NorthSouth route). Conversely, VRUs were overtaken with a significant but marginal increase in overtaking distance when travelling out of town compared to travelling into town (β = 0.0913, SE = 0.024, p < 0.001). Furthermore, the analysis indicates that MRUs were overtaken significantly closer than cyclists when travelling out of town (β = 0.2107, SE = 0.034, p < 0.001). In the opposite direction, the overtaking distance to cyclists compared to MRUs is marginally lower, though this effect is not statistically significant (β = −0.0937, SE = 0.057, p = 0.1).
| Condition | β | p-value | 95 % CI | Conclusion |
|---|---|---|---|---|
| SouthNorth vs. NorthSouth for MRU | −0.2131 ± 0.062 | < 0.001 | (−0.335, −0.092) | Significant (SouthNorth < NorthSouth) |
| SouthNorth vs. NorthSouth for VRU | 0.0913 ± 0.024 | < 0.001 | (0.044, 0.138) | Significant (SouthNorth > NorthSouth) |
| Bicycle vs. MRU for SouthNorth | 0.2107 ± 0.034 | < 0.001 | (0.144, 0.278) | Significant (Bicycle > MRU) |
| Bicycle vs. MRU For NorthSouth | −0.0937 ± 0.057 | 0.1 | (−0.205, 0.018) | not significant (Bicycle < MRU) |
Another perspective on the lateral distance in overtaking scenarios is given by Table 1. It shows mean lateral distance and standard deviation of the different overtaking scenario variants. The mean overtaking distance of cyclists on NorthSouth is µ = 2.36 m with a standard deviation of 0.51 m and on SouthNorth is µ = 2.59 m with a standard deviation of 0.52 m. The Table 1 also illustrates the probability P(D < x) of a lateral distance D being lower than a specific threshold x in meters for both routes, as well as for overtaking another motorized vehicle or a cyclist. It is worth noting that, of all scenarios where a cyclist was overtaken, 27% had a lateral distance of less than two meters on the NorthSouth route and 14.74% on the SouthNorth route, which is the minimum overtaking distance in extra-urban areas in Germany.
| NorthSouth | SouthNorth | |||
|---|---|---|---|---|
| Bicycle | MRU | Bicycle | MRU | |
| µ ± SD | 2.36 ± 0.51 | 2.59 ± 0.57 | 2.59 ± 0.52 | 2.09 ± 0.45 |
| P(D < 1 m) | 0.07% | 0.11% | 0.01% | 1.73% |
| P(D < 1.5 m) | 4.19% | 3.04% | 1.67% | 7.48% |
| P(D < 2 m) | 27.24% | 18.53% | 14.74% | 43.81% |
| P(D < 2.5 m) | 61.71% | 47.05% | 47.16% | 82.45% |
| P(D < 3 m) | 87.68% | 74.72% | 76.70% | 95.75% |
Figure 15 illustrates four examples of overtaking scenarios that were observed during the measurement period. The bottom right image shows an ambulance overtaking a car which makes way by driving on the grass shoulder. The other three examples show cars or a bus overtaking cyclist. It is worth noting that in the top right image, the car significantly undercuts the minimum safety distance early in the morning, despite no traffic coming from the opposite direction.

3.5 Additional phenomena related to traffic safety
In the following, we will highlight various phenomena that we found during both measurement campaigns which potentially affect traffic safety.
3.5.1 Turning behavior of trucks and buses
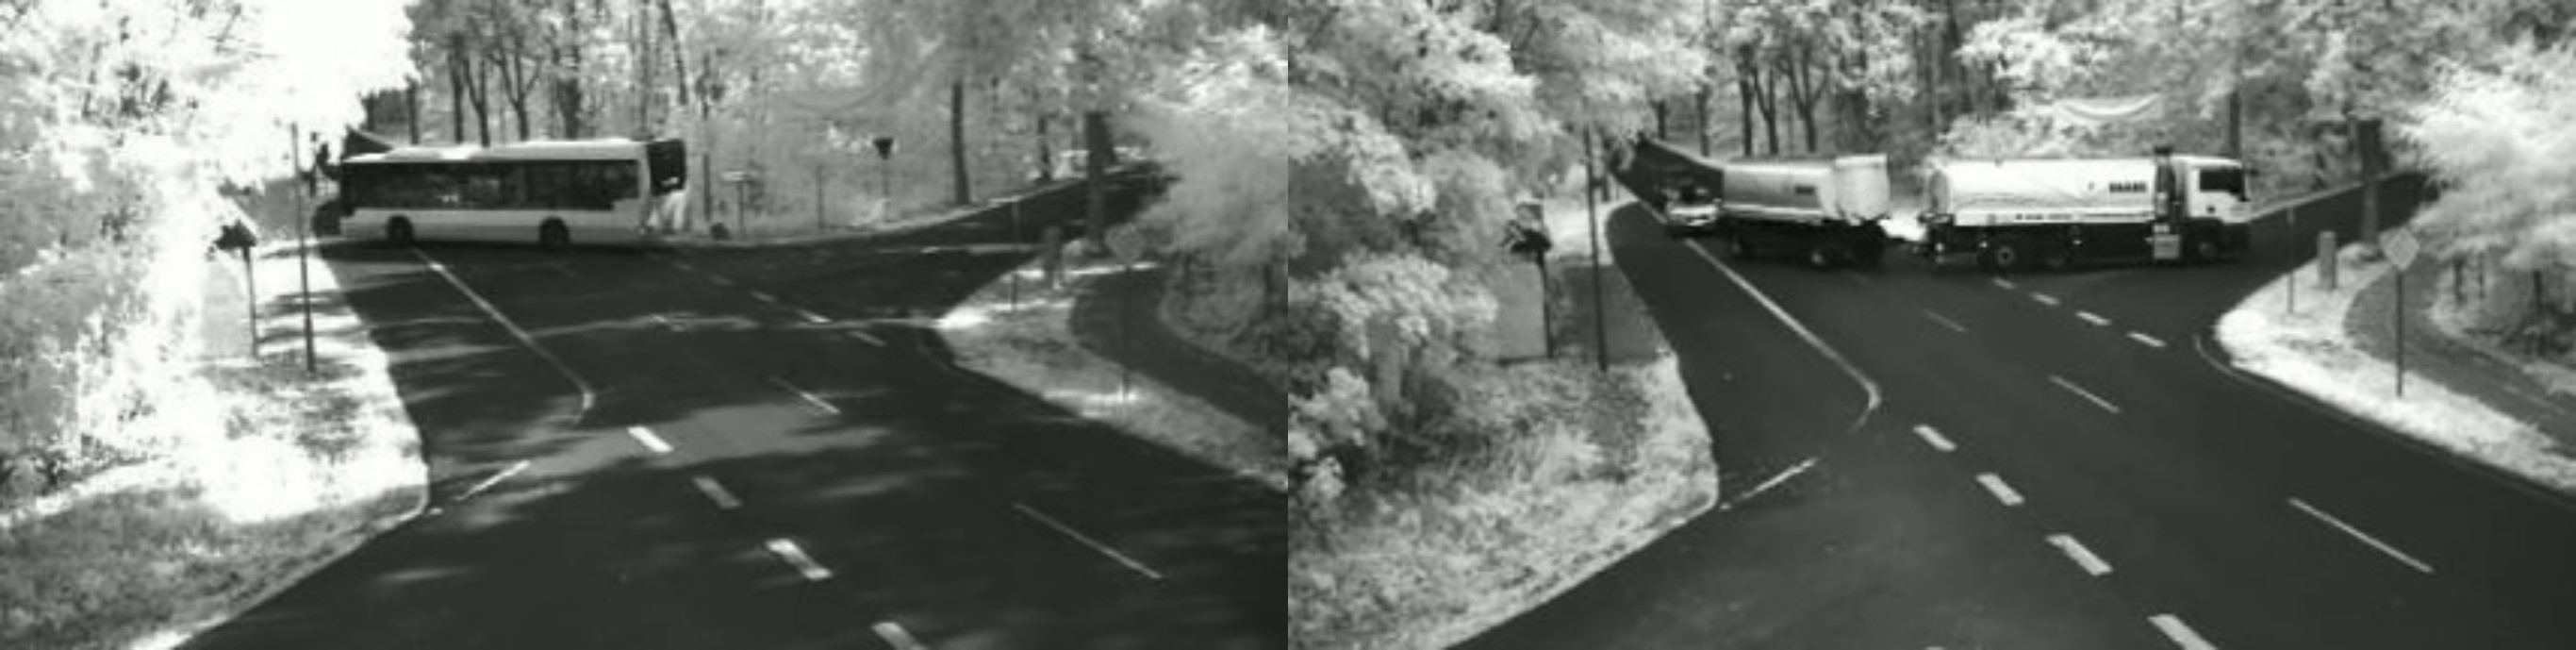
At the measurement site Pätz, it was observed that buses, trucks, motorhomes, and vehicles with trailers frequently cross into the opposite lane when turning onto both the federal road and the side road. Two examples are illustrated in Figure 16.
3.5.2 Reversing on the main road
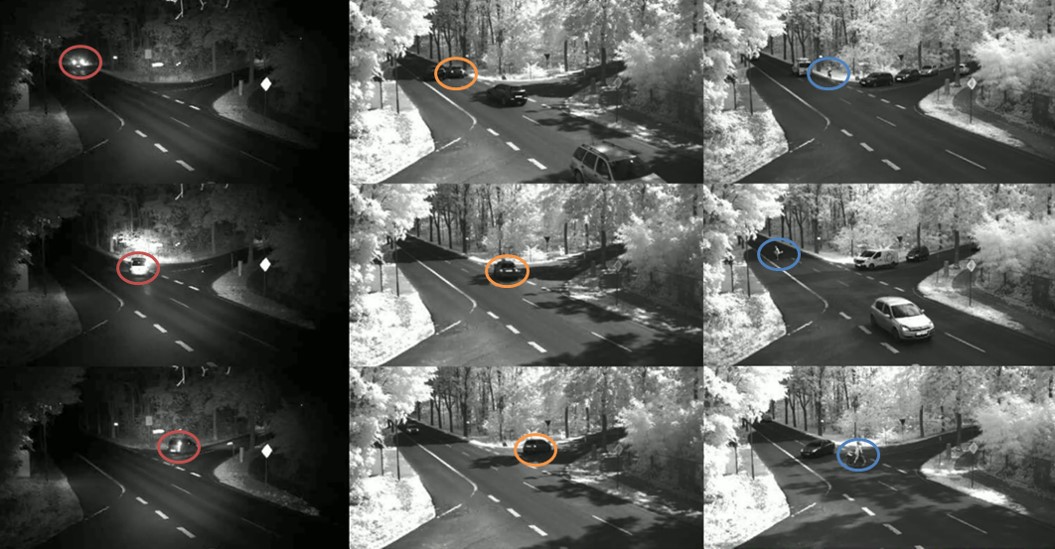
At measurement site Pätz, three road users were identified that cross the intersection and stopped shortly afterwards at the main road (two vehicles and one bicycle). The traffic participant in the left column of Figure 17 passes the intersection, reverses, and turns right into the side road. The vehicle in the middle column also passes the intersection and stops until there is no traffic on the main road. It then reversed to also turn into the side road. The bicycle stayed on the side of the main road for a few minutes and then crossed the opposite bus lane to turn into the side street.
3.5.3 Pedestrian traffic
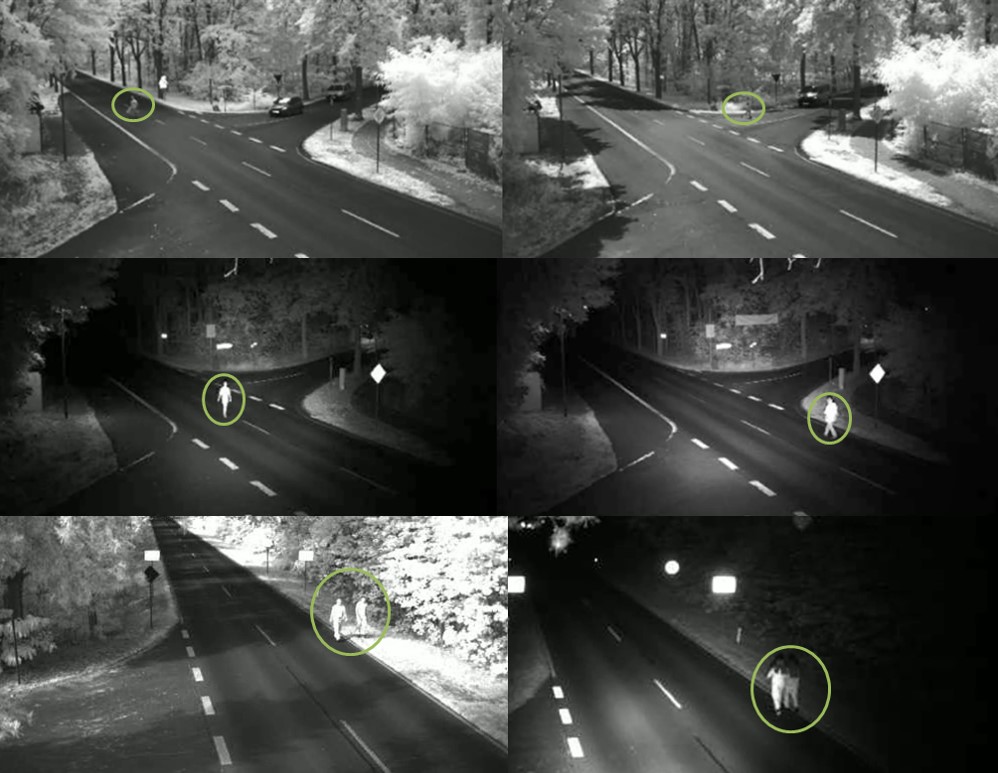
Pedestrian traffic was observed at both sites. At measurement site Pätz, they crossed the intersection from the bus stop, which is located in the western area of the intersection, into the oncoming traffic on the side street, as this is the shortest route. In one case (see first row of Figure 18) the vehicle from the side road had to slow down to let the pedestrian pass. It was also observed that pedestrians walked in the middle of the road at night (see second row of Figure 18).
At the measurement site Bestensee, pedestrians primarily crossed the road and secondarily walked on the Federal Road. Specifically, due to the lack of infrastructure, 15 pedestrians were recorded walking on the main road. Two examples are shown in the bottom row of Figure 18. Of these, eight people (two of them on grassed shoulder) walked in the direction of traffic and seven people walked against the direction of traffic (two of them on grassed shoulder). Hence, 50% of the pedestrians did not follow the rules and instead walked in the same direction as the motorized traffic.
3.5.4 Wild animals
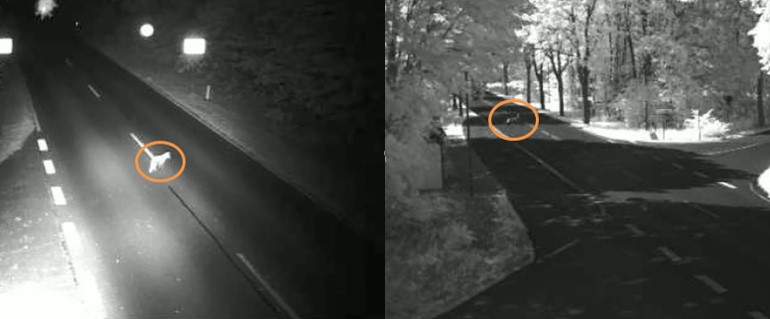
Wild animals were observed at both sites (see Figure 19). At the measurement site Pätz, a deer and small wild animals such as marten and mice were observed. At the site Bestensee, foxes and other small wild animals were observed. The majority of the animals were observed during night between 11 p.m. and 3 a.m.,
4. Discussion
This work studies the observed traffic behaviour at two measurement sites in rural areas. At both sites, trajectories and video data were recorded for two weeks using a mobile camera-based measurement system. At the site Pätz, the analysis was focused on an intersection, while at the site Bestensee, the focus was on a town entrance.
The analysis of crossing scenarios at the measurement site Pätz revealed that the variation in turning behavior among trucks and buses has a significant impact on traffic safety. The observed tendency for these vehicles to cross into the opposite lane when turning onto both the federal road and the side road is a concern, as it increases the risk of collisions with other road users.
Another interesting finding was that commuter traffic during weekdays, a common phenomenon observed at intersections in the urban area, was not consistent across measurement sites and travelling directions. The pattern was only significant on the NorthSouth route for both measurement sites.
The results also underscore the need for improved pedestrian infrastructure in rural areas. The observation that pedestrians frequently walked on the main road or against traffic flow, due to the lack of both, dedicated pedestrian crossings and footpaths, highlights the importance of providing safe and accessible pedestrian infrastructure. The installation of a traffic island could improve traffic safety for pedestrians and cyclists. This particularly holds for the measurement site Pätz, since there are two bus stops. Furthermore, the observation of wild animals crossing the road at night highlights the need for drivers, and automated vehicles in the future, to drive carefully and be prepared to break in rural environments.
The analysis of overtaking scenarios revealed that there are significant differences in lateral distances between cyclists and motorized vehicles. The distance at which cyclists are overtaken when traveling out of town is significantly greater than when overtaking MRUs. The opposite is observed for travelling out of town, though this is only marginally and not significant. However, there is a significant difference in overtaking distances to cyclists among both directions. That is, when cyclists travel out of town, the overtaking distance is significantly higher than in the opposite direction. In fact, the results show that in certain instances, the minimum overtaking distance of two meters was not adhered to in both directions. The reasons for this contrasting behavior remain unclear. It is possible that this is attributed to measurement inaccuracies, which may have arisen due to the view of the cyclists being partially obscured by the vehicle during the overtaking maneuver when traveling out of time. It can be hypothesised that this behavior is dependent on the MRU’s velocity, given that cars tend to drive faster when travelling out of town and thus may adhere to a greater overtaking distance. This topic may be further explored in subsequent studies.
Nonetheless, whilst the distance is only one factor that influences the subjectively experienced traffic safety, the findings highlight the need to ensure that cyclists have sufficient space to avoid collisions with motorized vehicles in the rural areas. Furthermore, the addition of a solid center line could serve to indicate to drivers that overtaking is prohibited in this area, particularly at the measurement site Bestensee.
The study also found that the mean velocity of traffic participants is different across directions and traffic participant class. Cars tend to drive faster when travelling out of town, though only marginally. The opposite is the case for trucks and vans. Overall, traffic participants tend to drive faster than the allowed maximum velocity. This finding is consistent with previous research, while the installation of traffic calming chicane may help to reduce excessive speed. This slows down traffic at the entrance to the town and prevents it from accelerating too quickly on the way out at measurement site Bestensee.
5. Conclusion
This study provides an in-depth empirical analysis of rural traffic behavior at two representative sites in Brandenburg, Germany, using a mobile camera-based measurement system. The results demonstrate that rural traffic safety is shaped by various factors, including infrastructure constraints, vehicle type, direction of travel and the interactions among traffic participants. At the intersection site in Pätz, turning behavior emerged as a notable safety risk, particularly by large vehicles crossing into opposing lanes, compounded by frequent small Post-Encroachment-Times in crossing scenarios. At the town entrance site in Bestensee, overtaking behavior revealed significant differences in lateral distances, with cyclists in certain situations overtaken below the legal minimum distance. Velocity analysis confirmed small but systematic effects of travel direction and vehicle class, alongside a general tendency to exceed speed limits with (64.85%, 21.74%, 4.91%) of all traffic participants driving faster than (50 km/h, 60 km/h, 70 km/h).
The findings further highlight the systematic deficits in rural pedestrian and cyclist infrastructure, where the absence of dedicated crossings, continuous pathways, and separation from motorized road users increases the exposure to risk. Observations of pedestrian road use, as well as recurrent wild animal crossings, underscore additional safety challenges that automated and conventional vehicles alike must address.
Methodologically, the study illustrates the applicability of trajectory-based safety analysis in rural areas, including scenario mining for identifying overtaking and crossing scenarios. Nonetheless, the work is limited by the geographic scope and certain detection constraints (e.g., pedestrian classification) which may influence generalizability.
Future research should extend the approach to a broader set of rural environments, including areas with higher speed limits (up to 100 km/h) and varied infrastructure configurations, to better model behavior patterns and safety-critical events.
CRediT contribution statement
Lars Klitzke: Conceptualization, Data curation, Formal analysis, Investigation, Methodology, Software, Validation, Visualization, Writing—original draft, Writing—review & editing. Claudia Leschik: Conceptualization, Formal analysis, Investigation, Supervision, Validation, Writing—original draft, Writing—review & editing. Richard Lüdtke: Resources, Writing—original draft. Kay Gimm: Conceptualization, Supervision, Writing—review & editing.
Acknowledgement
An earlier version of this paper was presented at the 36th ICTCT conference, held in the Hague, the Netherlands, on 17–18 October 2024.
A special thanks goes to the colleagues Melvin Dreher, Raphael Möhle, Gavin Grolms, Tim Jauernig, Stephanie Gaßner and Karsten Falk for the preparation and setup of the measurement equipment.
Declaration of competing interests
The authors report no competing interests.
Declaration of competing interests
This study can be exempted from requiring ethical approval as traffic data is collected anonymously in accordance with to the General Data Protection Regulation (GDPR).
Declaration of generative AI use in writing
During the preparation of this work the authors used DeepL in order to improve the quality of writing. The output has been reviewed and revised by the authors who take full responsibility for the content of the publication.
Funding
This work was partly funded by the German Road Safety Council (DVR e. V.).
Editorial information
Handling editor: Haneen Farah, Delft University of Technology, Netherlands.
Reviewers: Giuseppina Pappalardo, University of Catania, Italy; Shayan Sharifi, Wayne State University, United States of America.
Submitted: 29 April 2025; Accepted: 25 November 2025; Published: 12 December 2025.