Quantifying the Upper Levels of Hydén's Traffic Safety Pyramid Using Global Data
Abstract
Hydén's pyramid qualitatively displays the number of conflicts and road user crashes in different severities. Fatal crashes are on the top of the pyramid, undisturbed passages mark the base of it. To quantify the pyramid, open data from the German Accident Atlas and closed data from the Berlin Police have been analysed with respect to time of the week, crash severity, and conflict-type. The data display distinctive weekly patterns that may reflect the traffic state at the hour of the week. Analysing the ratio among these levels for different crash severity levels seems to demonstrate that serious crashes and fatal crashes sometimes follow a different pattern than property-damage-only crashes, or crashes with lightly injured people. A similar result holds true for the conflict-types. This may indicate that their genesis is a mixed bag: sometimes, the mechanisms are different, and sometimes, they are not.
1. Introduction
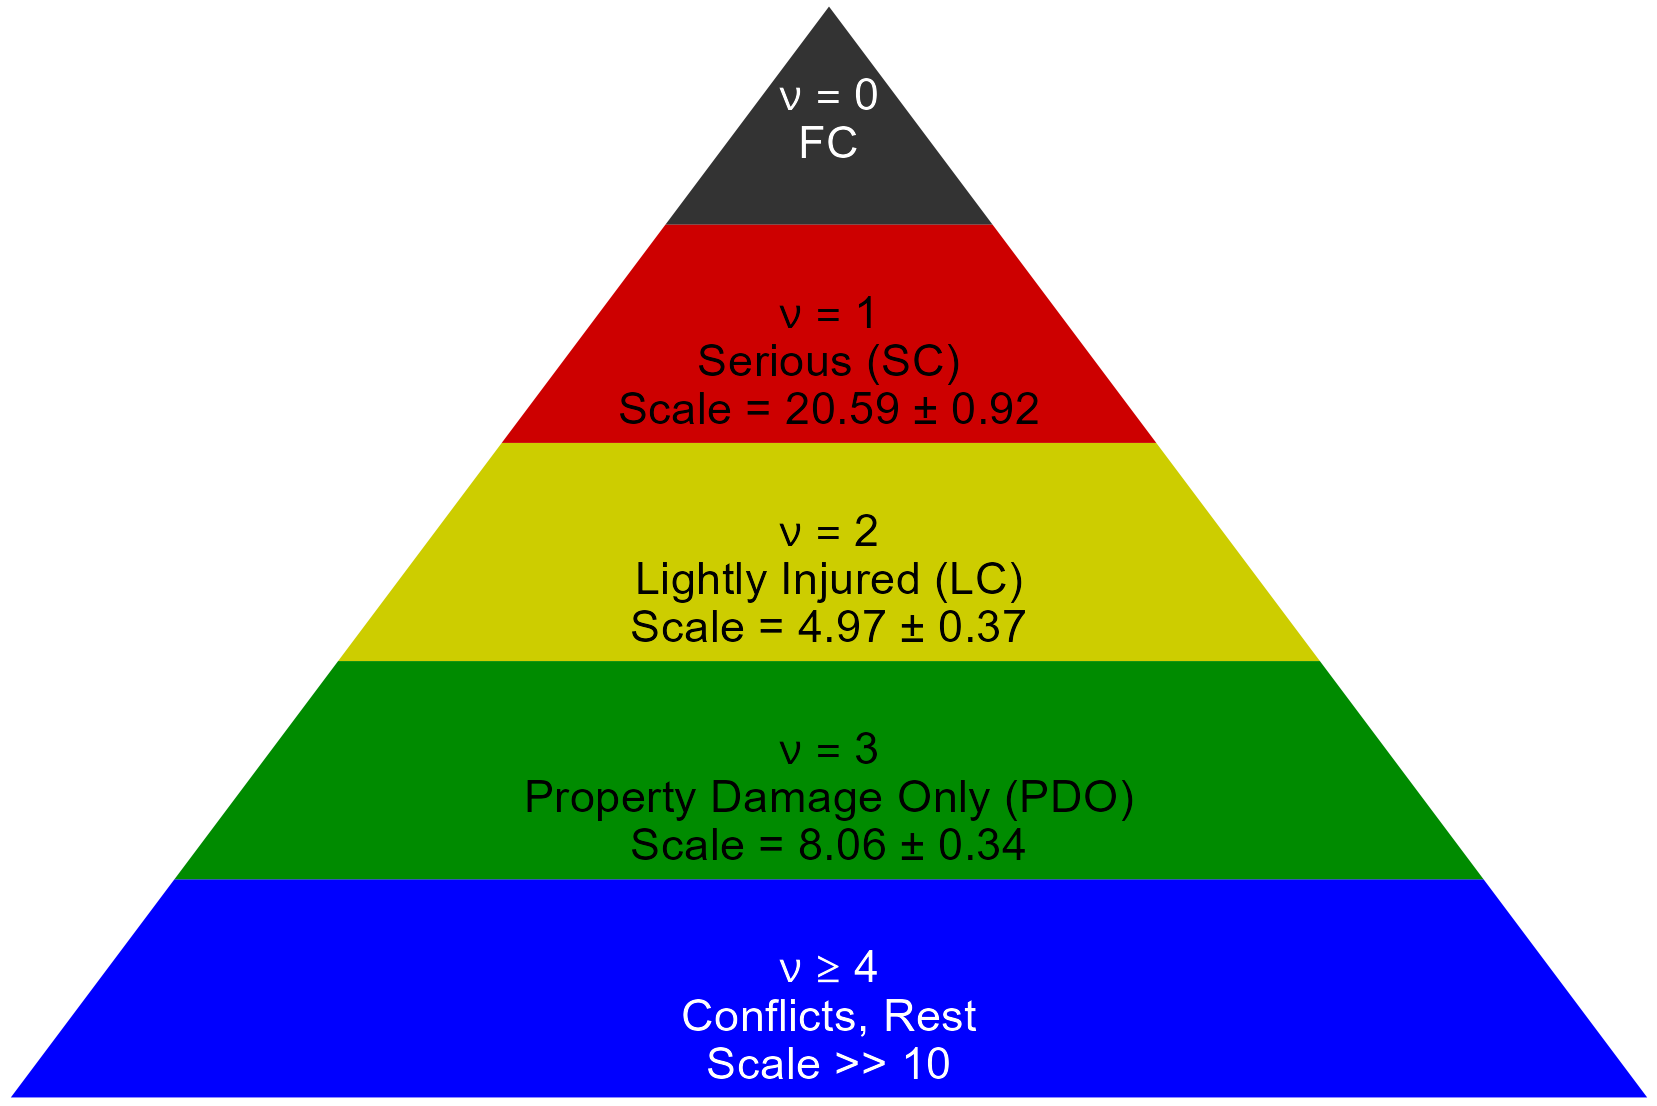
Hydén's safety pyramid (Hydén, 1987) is a well-known and simple visualization of the space of interactions between traffic objects, ranging from undisturbed passages to crashes with fatalities, see Figure 1 for a simplified visualization where the conflicts are in one level only, since we do not consider them here. Hydén's work might be viewed as a transfer of much older work by Heinrich (Heinrich’s triangle) related to safety at work (Anderson & Denkl, 2010; Heinrich, 1931) to traffic safety. The research question of Heinrich was very similar to the still open question of the relationship between conflicts and crashes in traffic safety: if by some means, the number of lightly injured workers is reduced, does this also reduce the number of seriously and fatally injured workers? If true, this would indicate a causal relationship between light and serious crashes, with the same or at least similar underlying causes. Heinrich was a strong supporter of this hypothesis, and he was able to put numbers at the ratio between lightly and seriously injured, as well as seriously and fatally injured workers, which appeared to be not an easy achievement in the 1930s. Later research then challenged his assumption (Anderson & Denkl, 2010; Johnson, 2011), and the current state of art is that it seems to depend on the place or the type of work. Sometimes, a causal relationship cannot be disproved, and in some cases, the mechanisms behind accidents with lightly injured and seriously injured persons is completely different.
In traffic safety, it is not clear whether there are causal connections between the different levels of Hydén's pyramid. Of special interest is the relationship between conflicts and crashes, see, e.g. Zheng et al. (2014), for a review. Establishing such a relationship would open the door to a truly data-driven traffic safety work, since one would get rid of the rare nature of real crashes. Therefore, considerable efforts have been made (Hauer, 1982; Tarko, 2012, 2019, 2021) to answer this question and quantify this relationship. Clearly, correlations can be stated and even put into an equation that relates the number of crashes to the number of conflicts, but these findings were not as stable as desired (Tarko, 2021). So, it is safe to state that the question is still undecided. There is a certain tendency to the affirmative, but there is also a lot of scepticism around, see for instance the critical comments in Knipling (2015).
This work follows a different approach: it does not tackle the conflict versus crash theme, but looks at the four crash levels of Hydén's pyramid. It circumvents the rare-event problem by utilizing databases with a huge number of crashes in it, and tries to establish relationships within these four classes. It does so by analysing the weekly courses of the number of crashes Here, is the hour of the week for four severity classes (crashes with fatalities (FC) crashes with severe injuries (SC) crashes with lightly injured people (LC) and PDO (property-damage only) crashes The two databases contain 4.05M crashes in total, 2.23M from Berlin between 2001 and 2022, and 1.82M from the German Accident Atlas between 2016 and 2023. These large numbers are required to have the statistical power, since the data are distributed over the 168 hours of the week. Note, that this approach could be viewed as an attempt to work around the missing traffic state (which is characterized by traffic flow and speed, whose relationship is described by the fundamental diagram) problem: it is very likely that traffic states at the same hour of the week are similar, we have analysed a large traffic flow database to confirm this. However, it is far from easy to assign a definite traffic state to each hour of the week, especially in large networks which tend to be inhomogeneous.
2. Data and methods
As stated in the introduction, two different (but related) crash databases have been analysed:
The open access German Accident Atlas (Statistisches Bundesamt Deutschland, 2024) abbreviated with GAA throughout the paper contains data from crashes in Germany with injured persons and fatalities from 2016 to 2023. However, not all German states are represented in the data between 2016 and 2019 due to the slow build-up of the database. Due to privacy restrictions, the data have other limitations: they do contain the precise location of each crash, but they do not contain the number of injured or killed persons, and the number of objects actually involved in each crash. There is a binary indicator for six different traffic objects (bicycle, car, pedestrian, motorbike, truck, unknown/miscellaneous), but this means that a crash of two passenger cars still has the indicator isCar=1, not 2. Furthermore, the time of the crash is contained only incompletely: the weekday, the hour of the day, and the month of the year is there, but not the full date, essentially reducing the days of each month to seven days. 24 variables describe a crash, some of them are redundant (coordinates in two versions, four variables for the administrative level like Federal state, administrative region, down to township). Finally, there is the crash type and the conflict type that led to each crash (in German “Unfallart” and “Unfalltyp”, see Appendix for a precise definition), and the severity on a scale of 0…2. Here, 0 indicates a crash with fatalities, 1 and 2 are crashes with severely or lightly injured persons, respectively. Note, that this database covers whole Germany, especially rural and urban areas are both mixed.
The second, but closed database is from the Berlin Police, abbreviated with BP throughout the paper. It contains a more complete record for each crash, including age and the sex of all active participants, and the exact date, time, and location of the crash. It also contains PDO crashes, and although it is known that these have considerable under-reporting issues, they are a valuable additional source and will be used here as well. It covers the years 2001 through 2022. The severity indicator has been assigned by us, based on the actual number of fatally, seriously or lightly injured people. This assignment, as well as all other analyses shown here, are done by scripts in R (R Core Team, 2025).
Both datasets have been aggregated to give the total number of crashes per crash severity, and per hour of the week. The representation per hour of the week is rarely used in traffic safety analyses; however, we think it gives a new and interesting view on those data that has become available only with large and detailed crash databases. And, as mentioned earlier, it serves as a proxy of the (unknown) traffic state.
Public holidays have not been eliminated from these data, we think that their effect is small and may increase the noise in the data a bit, which is tolerable. The same holds true for the Covid-19 pandemic: the data have been kept, although the effects of this pandemic are clearly visible. The data could also be analysed in a similar manner with respect to crash type, conflict type, or traffic mode, the text will have a short peek into that later on.
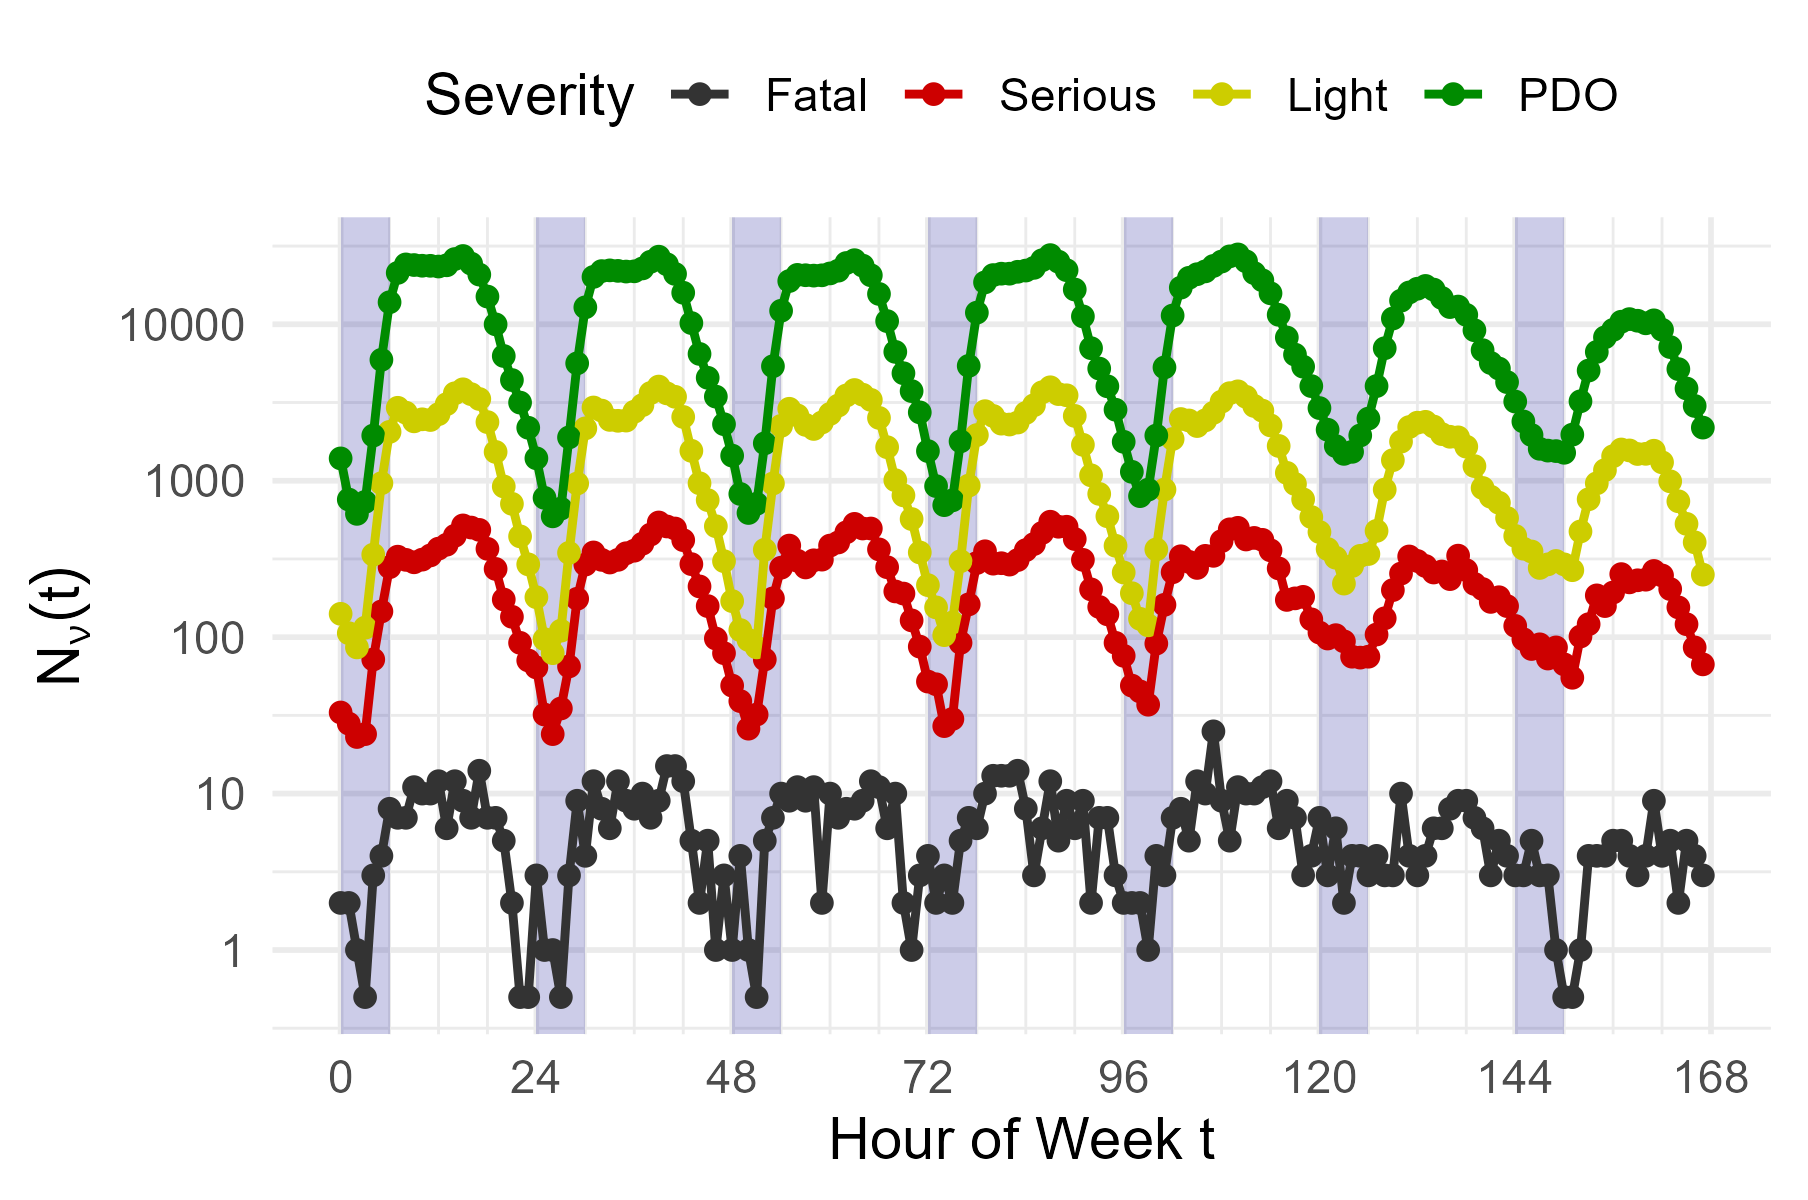
In Figure 2, the weekly numbers of the four crash severities are shown for the BP data set. These numbers display well visible weekly patterns. Shown here is the sum of all the crashes. There is a strong correlation between the four curves, with a Pearson correlation between 0.71 and 0.98 among them. Therefore, to spot differences, different approaches have been tested, all with their pros and cons.
3. Results
We finally came up with a direct comparison. From the approach so far, pick one of the curves as reference and compute the ratio between this reference curve and all the others, i.e. Two candidates for the reference curve stand out, and this is either the curve of all crashes, or the curve of the crashes with slightly injured persons: they both have a considerably large number of data-points in them, which is advantageous since it reduces the relative error in the computation of the ratios. The curve of all crashes is superior in this regard; however, it may suffer from under-reporting issues. In this presentation, the under-reporting might not be an issue if it is distributed evenly over the hours of the week. Nevertheless, since this curve is available only for Berlin, it is picked as the reference curve.
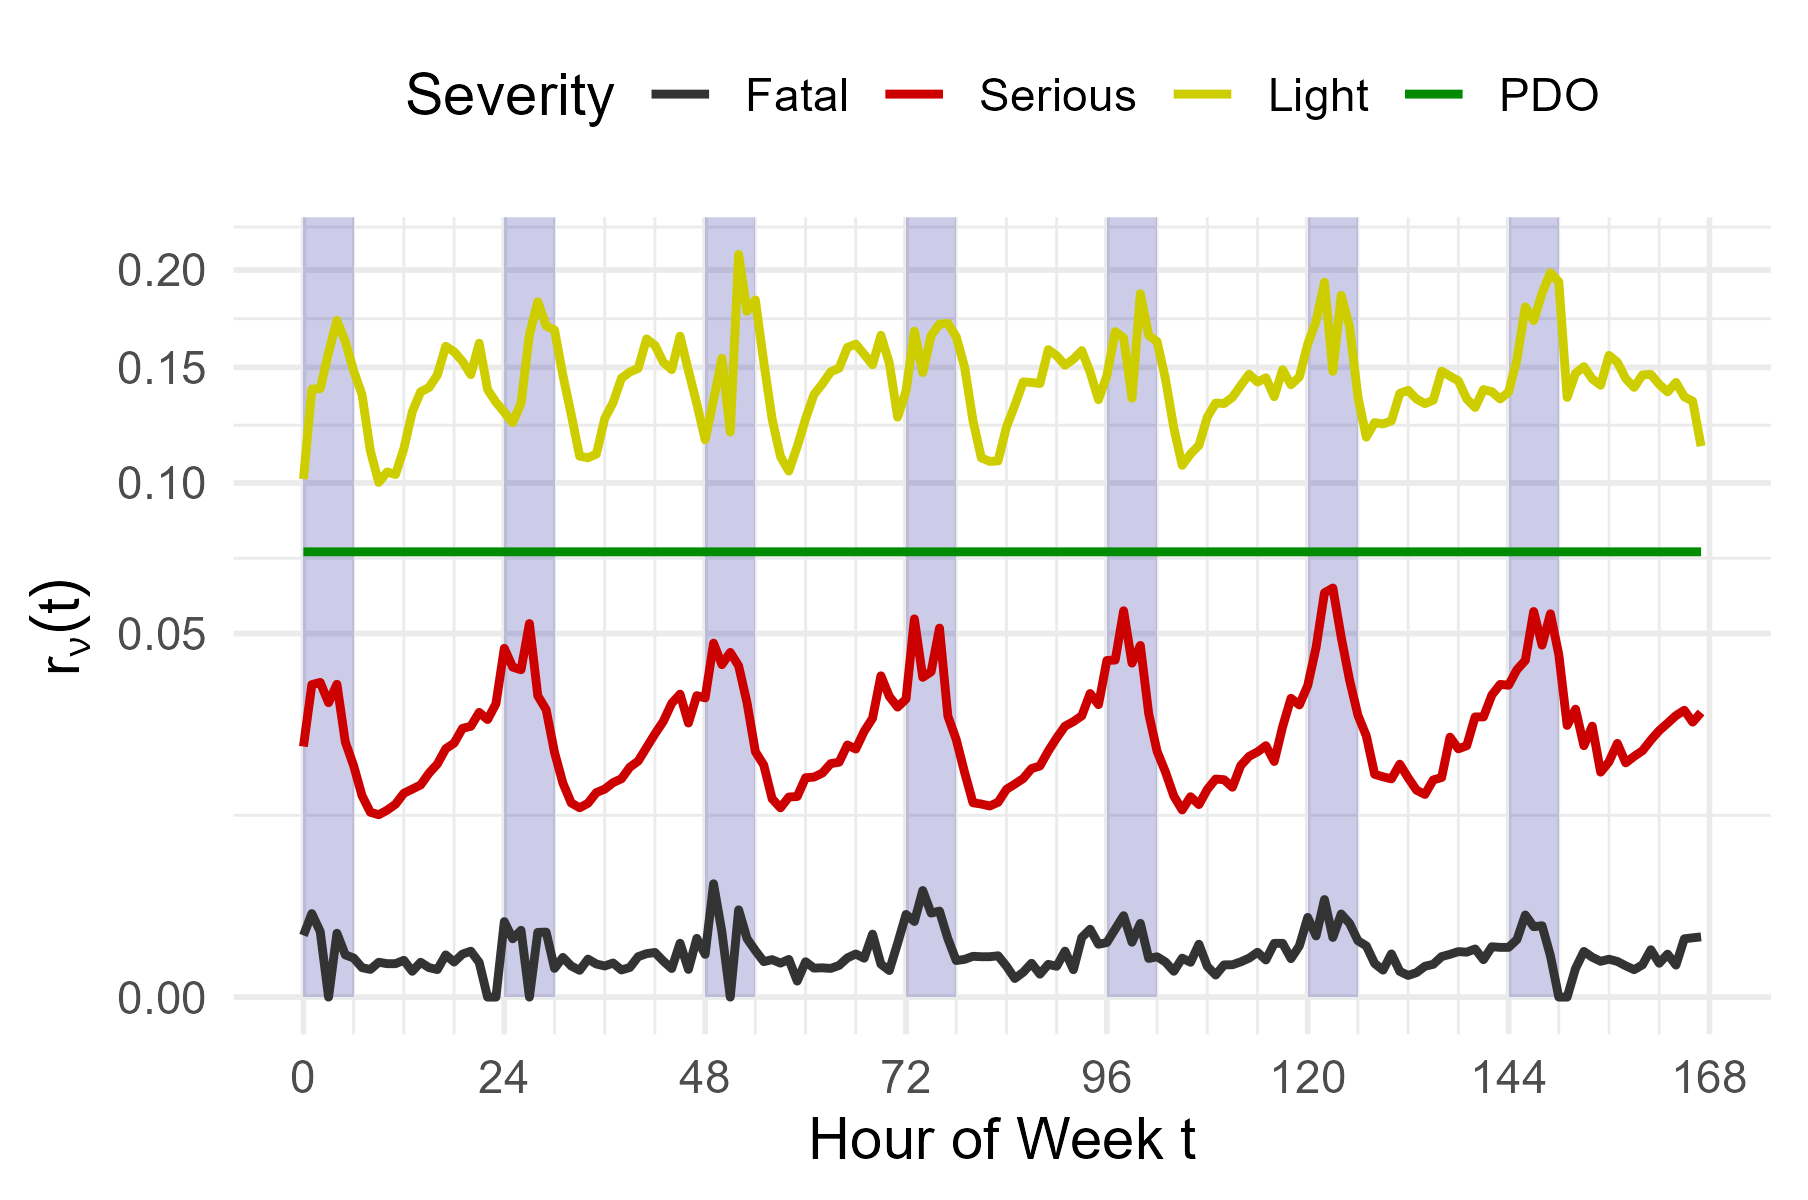
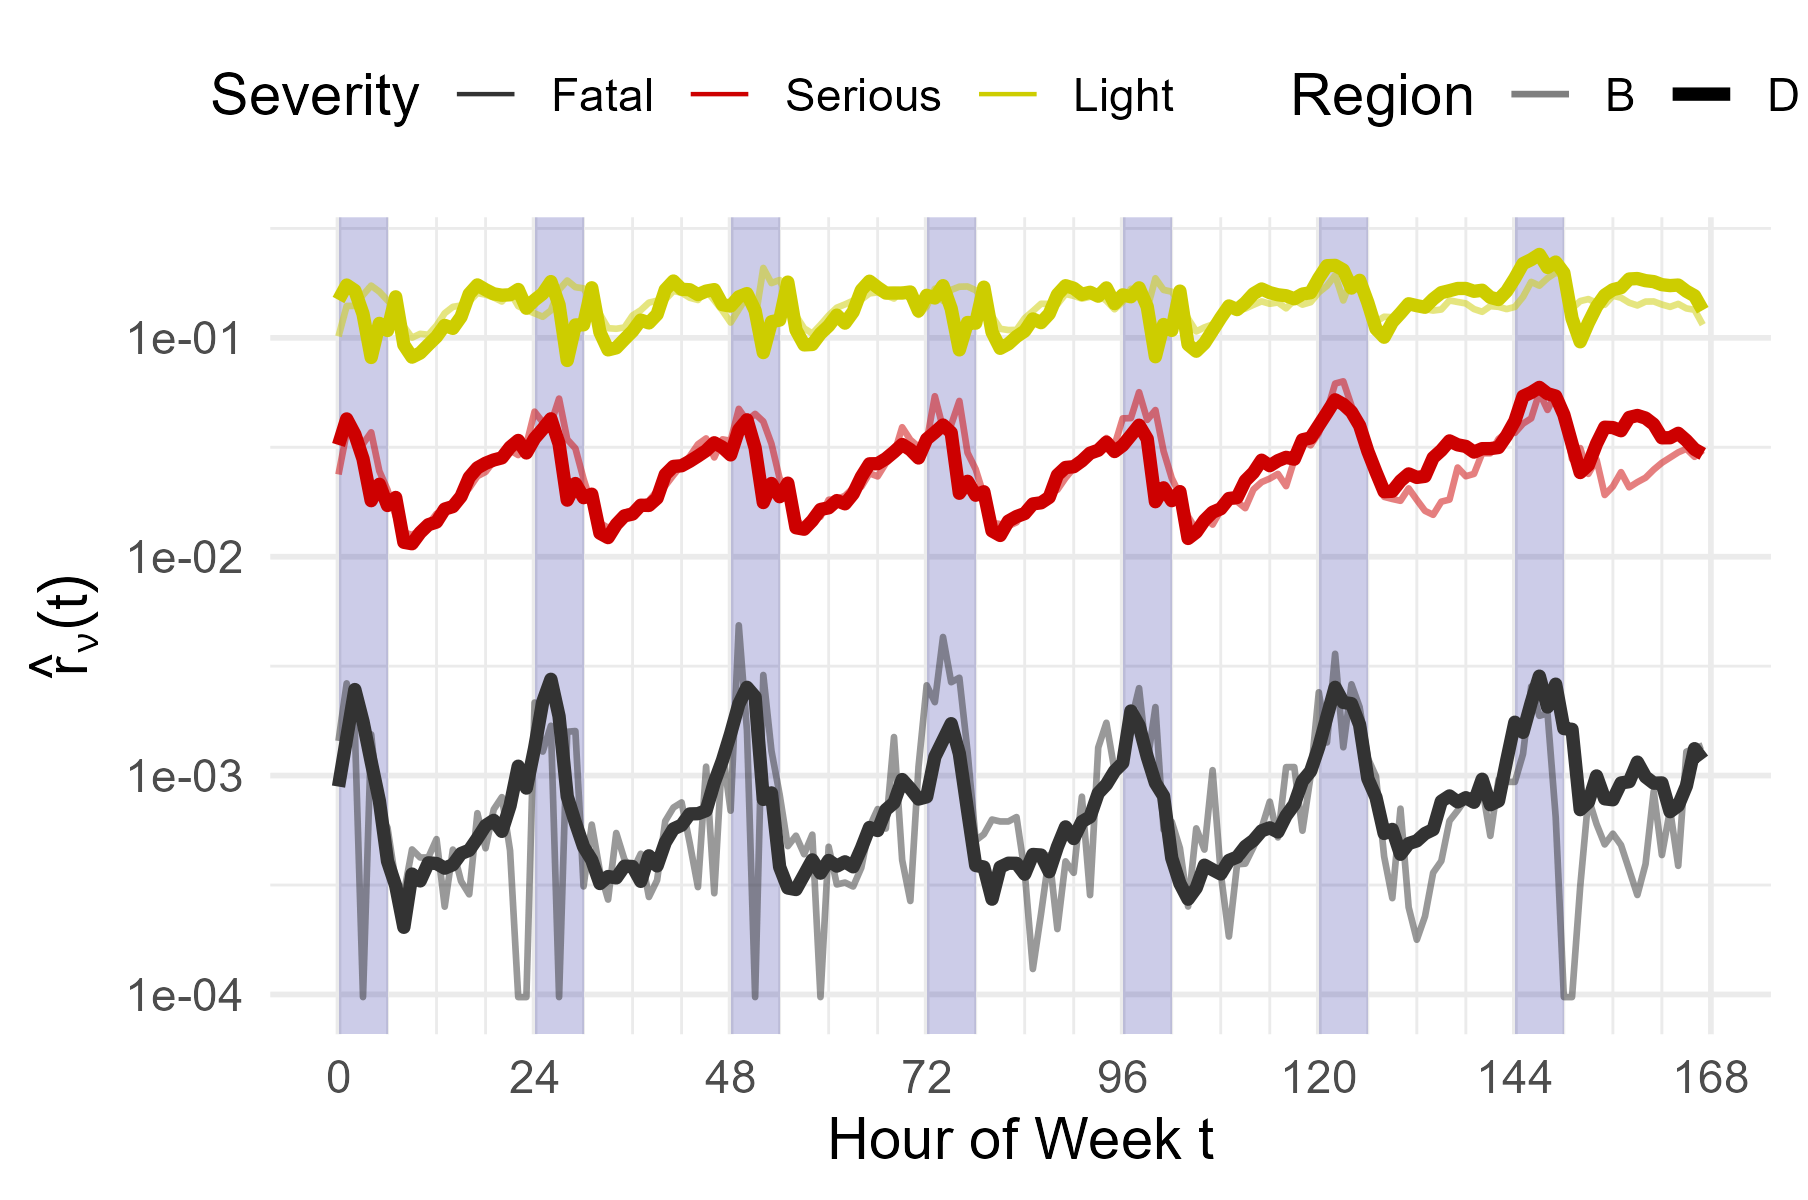
The results are shown in Figure 3. As a control, the curve of the scaled PDO data is plotted as well, yielding a flat line. The data for the fatal crashes does not contain enough statistical weight to draw conclusions. This will be different in the GAA data set. The curves for crashes with seriously and with lightly injured, however, show distinct patterns, and this is in our view the most interesting result. Going back to the idea that there is a causal relationship between the different severity levels, the (maybe naïve) expectation would be to have flat curves at some fixed ratio between the severity classes. This is clearly not the case.
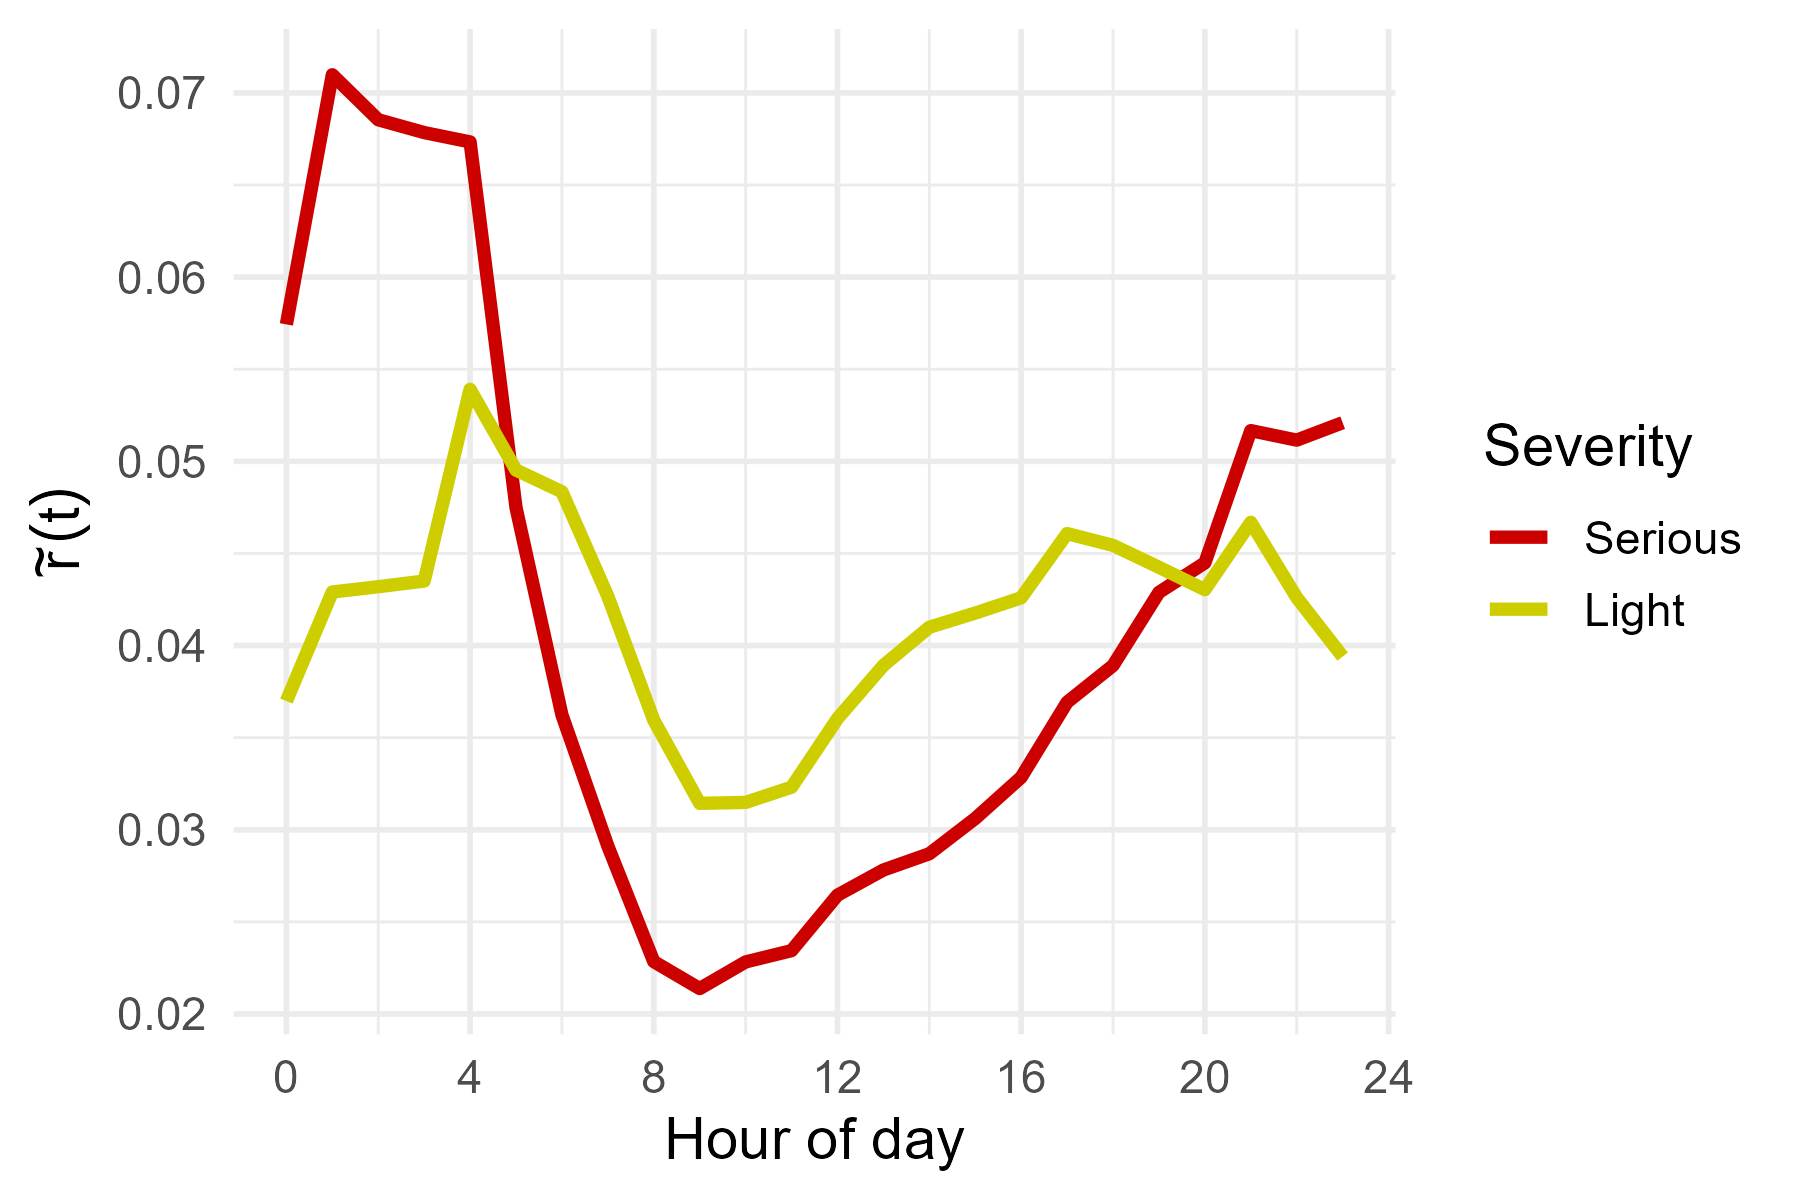
Zooming in and computing a weekday daily pattern (see Figure 4), it could be stated that the chances to get injured is smallest during the morning rush hour, where the ratio of LC, SC, and, arguably, the one of the FC is minimal. The maximum is displayed during the night hours: here, the danger to get injured is roughly a factor of two larger than during the morning rush hour. It seems that the maxima of the serious and lightly injured, respectively, are not at the same spot. While the crash ratio of the serious crashes peaks slightly after midnight (between 1 and 2 am), the lightly injured crash ratio peaks later, early in the morning, around 4 and 5 am. Furthermore, this ratio seems to have another maximum around the afternoon rush-hour. In effect, these two patterns look similar, but also display considerable differences.
All the data that is in the BP and GAA curves of the crashes with severity were compared to the Berlin PDO curve shown in Figure 5.
Especially the curves for the SC and the FC crashes are similar, but show specific differences. There, not the real are shown, but rescaled versions instead. While for one database the ratios are a perfect representation of the ratios of Hydén's pyramid, when comparing different databases with different number of crashes, they depend on the actual number of crashes in the databases themselves. For this reason, the ratio computed for the German data have been rescaled so that their mean values are equal to the ones of the Berlin database, and for this reason, the ratios in the plots are named
The cross correlation between the three curves in Figure 5 is 0.85 between LC and SC, 0.81 between SC and FC, and 0.55 between LC and FC, respectively. Since this is an average over all of Germany, these results are fairly robust. In the following, the concentration is on the German dataset alone. Digging a bit deeper, many different combinations could be investigated in order to better understand the relationship between the upper three levels of Hydén's pyramid: the dataset has plenty of opportunities, e.g. looking into the different modes, looking into the conflict and crash types which are part of both datasets, and so on: it quickly goes out of hand.
Starting with the cross correlation between the severity levels (FC) and (SC) and and (LC, for the six traffic modes in the data, the results are displayed in Table 1. The cross correlation is computed again for the weekly courses of the data, but now classified by mode and severity.
| Correlation/mode | Bicycle | Car | Pedestrian | Motorbike | Truck | Miscellaneous/unknown |
|---|---|---|---|---|---|---|
| 0.916 | 0.940 | 0.808 | 0.963 | 0.946 | 0.945 | |
| 0.959 | 0.984 | 0.983 | 0.936 | 0.989 | 0.989 |
Similar to the weekly curves, there is a strong correlation between the levels of Hydén's pyramid.
We obtain a more nuanced picture when considering the additional information of crash and the conflict types. The conflict type, which was recorded in both datasets for each crash, is described in more detail in the Appendix. Here, it is used as a classification of the conflict that leads to the recorded crash. Counting each pair of the seven conflict types with the three severity classes, this matrix can be analysed by a mosaic plot shown in Figure 6.
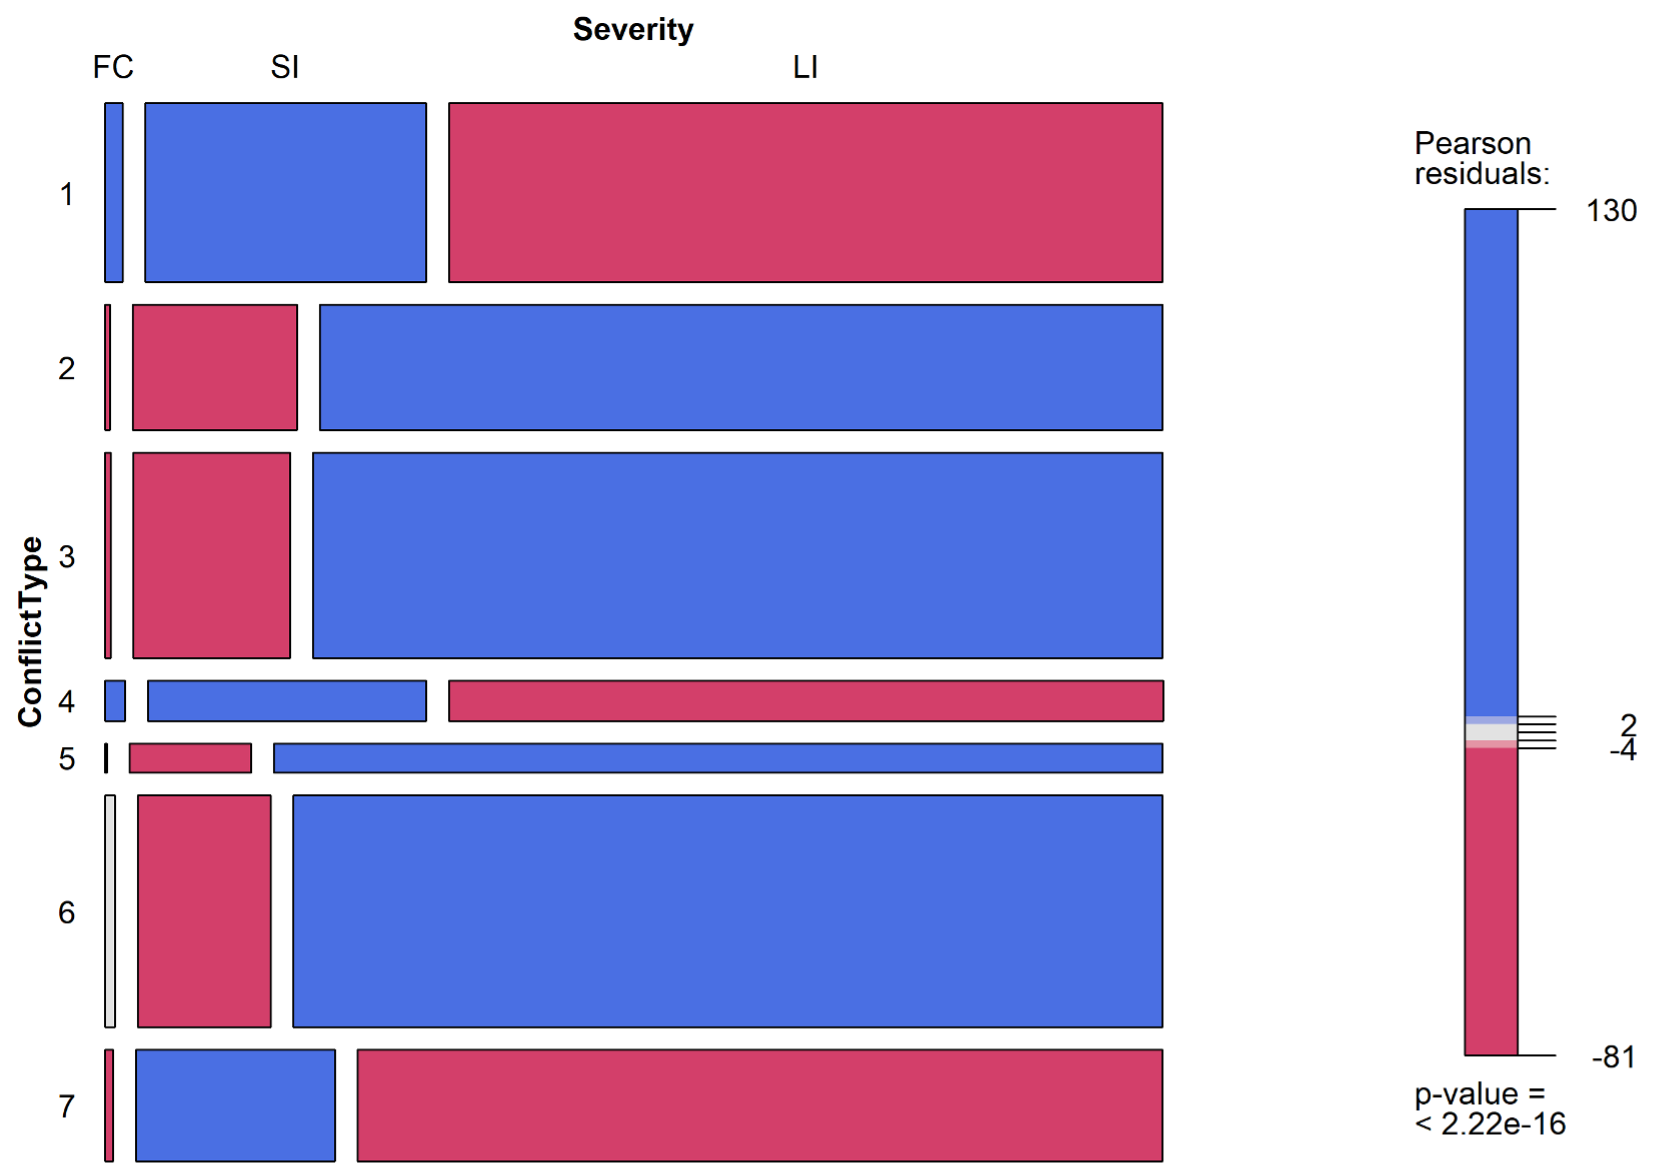
A mosaic plot displays the different sizes of the various classes by scaling the tiles proportional to the number of data in it; in addition, in the version used here, it assigns a colour to each of the tiles, which is due to a very simple model: the assumption behind this model is that the number in each tile is simply the product of the two marginal distributions, which would mean that the distribution of conflict types and the distribution of severity is independent of each other. For the dataset at hand, this is clearly not the case. The deviation between the assumption of independence and the actual count is measured by the Pearson residual Here, is the count of data in tile and is the modelled value according to the independence assumption. In essence, this is a -test, and the -value displayed tells that the assumption of independence is very unlikely. In fact, the only combination with a Pearson residual below 2 (which correspond to a significance level of 5%) is the tile with severity class (FC) and conflict type 6. For the other combinations, we have in fact strong deviations from the independence assumption: e.g. for conflict type 6, which contains rear-end conflicts, crashes with severely injured persons are much less likely, and crashes with lightly injured persons are much more likely than the naïve assumption. For conflict type 1, which is single vehicle crashes, it is just the other way around: getting seriously injured or even killed is much more likely than getting lightly injured. This is in line with the expectation.
4. Summary and conclusions
In this study we aimed to find and quantify correlations among the different severity levels of Hydén's pyramid. For this, we provided an in-depth analysis of two German databases of road user crashes. The weekly patterns of both databases showed strong correlations, but also differences. In principle, this allows to quantify the relationship between the upper levels of Hydén's pyramid. It turns out that the ratio between the four severity grades is not uniform over the hour of the week (see Figures 3 and 5). A naïve expectation would be that their respective ratios should be constant; the deviations could be a starting point for future research and indicate that there is no simple relationship between Hydén's levels: it is clearly time and/or—very likely—traffic-state-dependent. However, the correlation among the pyramid’s levels is strong, and although correlation is not causation, it is another strong hint that there might be causal relationships between the levels. We expect similar things also when it comes to the relation between conflicts and crashes.
This result stays if we analyse the data mode-wise: it becomes a little weaker when we look at the conflict type/severity matrix in Figure 6. Here, one sees that different conflict types display different patterns when it comes to their distribution on the three severity classes.
This work has limitations. Clearly, it cannot make a definite statement about the real connections between the upper levels of Hydén's pyramid. It only demonstrates that the relationship between these four levels is not simple, since the ratio between the severity grades is not constant. Furthermore, it is limited since it does not tell apart the different situations which contribute to the severity levels. The work of Hydén (1987) and others does this clearly, so that different conflict and infrastructure types in fact do have different crash conflict relationships, and arguably different kind of relationships between the upper levels of the pyramid. The work here is a kind of average over the different types and infrastructures. However, it is nevertheless interesting that the patterns described here are visible, despite the strong average over so many different scenarios.
This points to the usual result in traffic safety research: it is more complicated than expected. There is some relationship between the levels of Hydén's pyramid, and the correlation between the curves might be some indicator of its strength, but it cannot be shown that there is a strong causal connection between the levels, nor can it be falsified.
Acknowledgement
Discussions with Reinier Jansen during and after the ICTCT conference 2024 are gratefully acknowledged. He especially pointed to the work of Knipling (Knipling, 2015), who cited Heinrich (Heinrich, 1931). An earlier version of this paper was presented at the 36th ICTCT conference, held in the Hague, the Netherlands, on 17–18 October 2024, as an e-poster. Furthermore, we are deeply indebted to the colleagues from the Berlin Police, who provided the crash data.
Data availability
The GAA data are open and can be downloaded from the Website of the Statistisches Bundesamt (https://unfallatlas.statistikportal.de/). The data of the Berlin Police (BP) are not open. The scripts used in this analysis can be obtained on request to the lead author.
Declaration of competing interests
The authors report no competing interests.
Declaration of generative AI use in writing
The authors declare that no generative AI was used in this work, with the exception of the translation referred to in the appendix; the tool deepL may use generative AI internally.
Ethics statement
This study did not require formal ethical approval, as it either utilized existing open-source data or data which did not include any personally identifiable information or sensitive content. All research activities adhered to ethical standards for the use of secondary data. DLR in general is committed to the “Guidelines for Safeguarding Good Research Practice” of the DFG, the Deutsche Forschungsgemeinschaft (German Research Foundation).
Funding
No external funding was used in this research, it was performed with DLR’s basic research funds.
CRediT contribution
Marek Junghans: Conceptualization, Methodology, Writing—review & editing. Andreas Leich: Conceptualization, Methodology, Writing—review & editing. Ronald Nippold: Conceptualization, Methodology, Writing—review & editing. Peter Wagner: Data curation, Formal analysis, Methodology, Supervision, Validation, Writing—review & editing.
Editorial information
Handling editor: Stijn Daniels, Transport & Mobility Leuven | KU Leuven, Belgium
Reviewer: Jiří Ambros, Transport Research Centre (CDV), Czech Republic
Appendix: Definition of the conflict and crash types
The following text is based on a machine translation by deepL of a text from the German Federal Statistical Department (Statistical Administration of the German Federal Government and the Federal States, 2022) explaining the basics of traffic safety in relation to the GAA. The translation needed to be edited, since the German text uses the words “Unfallart” and “Unfalltyp”, which are almost untranslatable and could be only understood with the additional explanations in the text.
The conflict type (deepL translated “Unfalltyp” as accident type, and “Unfallart” as type of accident) describes the conflict situation that led to the accident (i.e. the phase of the traffic situation in which misconduct or another cause made the further course of events no longer controllable. In contrast to the crash type, the conflict type is not about describing the actual collision, but about the type of conflict triggering this possible collision.
The following seven conflict types are distinguished (the German original still speaks of accidents, while conflicts are meant, judging from the context; we have used the combination accident/conflicts here to clarify):
-
Driving accident/conflict: The accident was caused by loss of control of the vehicle (due to inappropriate speed or incorrect assessment of the course of the road, road conditions, etc.) without other road users having contributed to it. As a result of uncontrolled vehicle movements, however, a collision with other road users may have occurred. However, driving accidents do not include accidents in which the driver loses control of the vehicle as a result of a conflict with another road user, an animal or an obstacle on the road or as a result of sudden physical incapacity or sudden damage to the vehicle. In the course of the driving accident, there may be a collision with other road users, so that one cannot speak of a single-vehicle accident.
-
Turning accident/conflict: The accident was caused by a conflict between a turning driver and a road user (including pedestrians) coming from the same or opposite direction at intersections, junctions, property or parking lot entrances. Anyone following a road with a turning right of way is not a turning driver.
-
Turning/crossing accident/conflict: The accident was caused by a conflict between a waiting vehicle turning in or crossing and a vehicle with right of way at intersections, junctions or exits from properties and parking lots.
-
Crossing accident/conflict: The accident was caused by a conflict between a vehicle and a pedestrian on the pedestrian on the carriageway, provided the pedestrian was not walking in the longitudinal direction and the vehicle did not turn. This also applies if the pedestrian was not hit. A collision with a pedestrian walking lengthways on the road belongs to accident/conflict type 6.
-
Accident/conflict caused by stationary traffic: The accident was caused by a conflict between a vehicle in moving traffic and a vehicle that was parking/stopping or performing manoeuvres in connection with parking/stopping. Accidents involving vehicles that are only waiting due to traffic conditions are not included.
-
Accident/conflict in longitudinal traffic: The accident was caused by a conflict between road users moving in the same or opposite direction, unless this conflict corresponds to another type of accident.
-
Other accident/conflict: Examples: Turning, reversing, parking between vehicles, obstacle or animal on the road, sudden vehicle damage (brake failure, tire damage, etc.), or obstacle or animal on the road. This includes all accidents that cannot be attributed to any other type.