Severity Indices as measurement tools for road safety in mountainous highway sections: case study of the Centinela–La Rumorosa highway
Abstract
The evaluation of road safety in highway infrastructure requires tools that enable the objective identification and prioritization of risk conditions. This study proposes the development of Severity Indices (SI), a quantitative tool designed to assess the severity level of road segments based on geometric and safety-related variables. Unlike traditional approaches based on qualitative audits, the SI allows for the establishment of severity levels through the integration of measurable and reproducible data. The guiding research question is: How can an index be constructed to quantify the level of road risk based on the physical characteristics of the road and their relationship to crash incidence? To validate the methodology, it was applied to the Centinela–La Rumorosa Highway in Baja California, Mexico—a roadway with high geometric complexity. Variables such as curvature, slope, superelevation, signage, and containment devices were analyzed and correlated with crash records using statistical and spatial analysis in Minitab version 21.1.0. A total of 35 critical points were identified in the descending direction and 28 in the ascending direction, to which SI values were assigned. The results show that this tool allows road safety assessments to be transformed into quantifiable, comparable, and technically informed decision-making processes. The development of the Severity Indices represents a significant methodological contribution to improving road safety evaluation, particularly in contexts where it is necessary to prioritize interventions based on evidence and consistent technical criteria.
1. Introduction
Crashes constitute a socio-economic issue of global significance, resulting in numerous fatalities, injuries, and substantial economic costs (World Health Organization [WHO], 2023). According to Pan American Health Organization [PAHO] & World Health Organization [WHO] (2025), deficiencies in road safety accounted for approximately 3% of the global Gross Domestic Product. Furthermore, traffic collisions represent the leading cause of death among individuals aged 5 to 29 and rank among the top ten principal causes of mortality across all age groups (United Nations, 2021). Although the implementation of safety measures on highway sections is cost-effective, it remains limited, as priority must be given to high-risk segments while considering socio-economic costs and various constraints arising from the shortage of specialized professionals.
Road safety represents a significant concern for the United Nations, which incorporates multiple entities that contribute directly or indirectly to this issue, designating it as a policy priority (United Nations, 2021). In Mexico, efforts have been made to enhance road safety by improving existing infrastructure through maintenance and conservation work, as well as by identifying and addressing High Crash Concentration Points (HCCP) on operational roadways as part of a reactive approach. However, adopting a proactive perspective through the implementation of Road Safety Audits (RSA) is also imperative. Consequently, the development and execution of procedures that promote road safety in the country are essential. Road infrastructure is a fundamental component of a nation’s development, as its quality and safety must be ensured (Santos et al., 2021). In this regard, in 2018, the Secretariat of Communications and Transportation (SCT), in collaboration with the Mexican Institute of Transportation (IMT) through the Coordination of Transport Safety and Operations, developed the Manual of Road Safety Audits for Highways. This document represents the first initiative in managing RSAs within projects involving the modernization of existing roadways, (Secretaría de Comunicaciones y Transportes [SCT], 2018a). Additionally, it aims to address crash-related issues, as has been the case in countries such as Australia, New Zealand, and several European nations, where RSAs have been implemented for decades as a proactive measure (Soria et al., 2018).
It is essential to highlight that Mexico faces a shortage of regulations and a lack of road safety specialists, with one of the fundamental issues being the absence of a regulatory framework mandating the implementation of RSA (Mendoza-Díaz et al., 2009). For this reason, this study proposes SI as an outcome of a comprehensive review of internationally recognized RSA items, incorporating various road safety and highway design elements. These indices serve as a valuable tool for auditors during the evaluation process, enabling them to assess roadway conditions and implement corrective measures aimed at reducing both crash rates and the severity of crashes. The primary objective of this research is to propose a methodology for establishing SI through the identification of the most impactful international items within RSA, ultimately defining a tool that provides recommendations throughout the safety evaluation process for the benefit of road users.
2. Background
2.1. Road safety
Mountainous highways pose significant road safety challenges due to steep gradients, sharp curves, adverse weather conditions, and visibility constraints, all of which increase the likelihood of crashes. To mitigate these risks, various methodologies have been developed to identify critical points and assess road safety conditions effectively.
Various studies have identified three primary categories of risk factors in road safety. Human factors constitute one of the leading causes of crashes, as errors such as distractions, fatigue, speeding, and failure to comply with traffic regulations significantly increase the likelihood of crashes (Federal Highway Administration [FHWA], 2006). Additionally, vehicle conditions particularly tire and brake conditions- directly influence crash severity. Environmental conditions also play a crucial role in road safety, as the presence of rain, snow, fog, and poor lighting reduces visibility and decreases tire grip, thereby increasing crash risk. Research has demonstrated that slippery surfaces can increase collision probability up to six times compared to normal conditions (Sadeghi & Goli, 2024). Moreover, geometric design and road management have a direct impact on the safety of mountainous highways, where factors such as curve radius, steep slopes, and the absence of proper signage contribute to higher crash rates. Globally, multiple studies have examined road safety (ITF-International Transport Forum, 2022; Waard et al., 1995; Yang et al., 2023). Research has explored how technical aspects, including optimal roadway geometric design, lane width, pavement quality, and adequate signage, affect crash rates (Williams, 2003). Furthermore, predictive crash models have confirmed that proper planning and continuous infrastructure maintenance significantly reduce traffic incidents (Calderón Ramírez et al., 2023).
To enhance road safety, various approaches have been developed to assess risk conditions and the effectiveness of interventions. One such approach is the Severity Index Model for Road Safety Audits, which classifies risk severity into three levels: high, medium, and low. Its application on the Chiquinquirá-Tunja highway in Colombia identified issues related to slope inclinations, inadequate signage, and the absence of proper safety guardrails (Dallos, 2015). Additionally, various studies have employed methodologies for analyzing injury severity data, with logistic regression emerging as one of the most widely used techniques for predicting crash severity (Senserrick et al., 2014; Torrão et al., 2014; Vilaça et al., 2018; Wang et al., 2017; Yuan & Chen, 2017).
Another approach for assessing safety conditions and risk involves RSA-based inspections that have been implemented as specialized inspections on existing roads, aiming to identify and rectify deficiencies in infrastructure and signage, thereby contributing to crash risk reduction (Federal Highway Administration [FHWA], 2006).
Road safety analyses can be implemented using various methodologies, depending on the available data, study objectives, and analysis scale, with their results applicable to other contexts (Paliotto et al., 2024). The primary purpose of a road network safety analysis is to provide decision-makers with a structured overview of the network’s safety performance and to help prioritize interventions where they are most needed (Paliotto et al., 2025).
Enhancing road safety on mountainous highways requires a comprehensive approach that considers human, environmental, and infrastructural factors. Environmental conditions, such as the presence of areas prone to extreme weather events, exacerbate crash rates, particularly in regions where infrastructure is deficient or safety measures are inadequate (Panjee et al., 2025). The integration of traditional methodologies such as RSA and geospatial analysis with advanced tools like machine learning and real-time monitoring has improved the identification of critical points and overall risk management. Studies suggest that the application of these approaches contributes to reducing crash rates and optimizing road infrastructure planning (Federal Highway Administration [FHWA], 2006).
2.2. Territorial delimitation of the Centinela–La Rumorosa highway
Mountainous highways are particularly prone to high crash rates due to steep slopes, complex curve systems, and spatial limitations. For this reason, the Centinela–La Rumorosa highway has been selected as the case study (see Figure 1). Located between the municipalities of Mexicali and Tecate in Baja California, Mexico, this roadway is part of Mexican Federal Highway No. 2. It is managed by the Public Trust for the Administration of Funds and Investment of the Centinela–La Rumorosa Highway Section (FIARUM) and spans a total length of 64 kilometers. Notably, this highway consists of two separate carriageways, one designated for the ascending segment and the other for the descending segment, each with distinct alignments and topographic conditions.

The highway segment from kilometer 0+000 to 18+000 is classified as an urban area of Mexicali, characterized by flat terrain and straight road sections. Similarly, the segment from 18+000 to 42+000 follows a comparable pattern. However, beyond kilometer 42+000, the highway transitions into a mountainous zone with a complex system of curves, extending to kilometer 64+000 (Montoya-Alcaraz et al., 2020). Segment is the focus of the case study (see Figure 2).

The Secretaría de Infraestructura, Comunicaciones y Transportes (SICT), formerly known as the Secretaría de Comunicaciones y Transportes (SCT), has conducted traffic volume studies based on the Annual Average Daily Traffic (AADT) for the case study (see Figure 3), revealing an approximate 40% reduction from 2020 to 2021. Notably, during 2020, the year of the COVID-19 pandemic, the number of crashes decreased by 30.5% in the ascending segment, whereas the descending segment experienced a 7.8% increase. Although mobility restrictions during the pandemic led to a decline in traffic volume and, consequently, a reduction in road crashes, this reduction is not statistically significant. Therefore, while lower traffic volumes may be observed, they do not necessarily correlate with a substantial decrease in crashes on a highway (Ungureanu et al., 2024), underscoring the need to explore additional variables that contribute to crashes.

It is essential to highlight that various studies have been conducted on the Centinela–La Rumorosa Highway by FIARUM and the Autonomous University of Baja California (UABC) to support its planning and maintenance, to enhance user safety and comfort. As a result of these investigations, Crash Concentration Points (CCPs) were identified within the mountainous section of the highway, leading to the recommendation of installing emergency escape ramps to improve road safety. Additionally, conservation and maintenance plans were established based on structural and surface analyses of the roadway, ensuring that appropriate annual interventions were implemented for each subsegment. Furthermore, a highway management system was developed to optimize maintenance strategies, along with the evaluation of 12 bridges along the route.
In 2014, an Intervention Plan was developed to assess the highway´s surface and structural conditions. Based on this diagnosis, annual conservation actions were planned to address the specific needs of each subsegment. In 2017, the need for emergency escape ramps along the descending mountainous segment was identified, and crash hotspots between 2000 and 2016 were mapped using a Geographic Information System (GIS) as part of an analysis of the safety condition of the Centinela–La Rumorosa Highway. In 2018, a safety and brake ramp analysis was conducted, which included a detailed topographic survey to review curve radius, slopes, and geometric design. Furthermore, road signage was evaluated and compared to current regulations to verify compliance. Improvements were proposed, including the installation of braking ramps. By 2020, the highway evaluation continued with the design of a management system to plan necessary interventions for its efficient maintenance. Most recently, in 2022, an analysis of bridge conditions was conducted, applying the methodology outlined in the SCT Bridge and Structure Maintenance Manual, which assessed 12 bridges along the highway. Their current state was determined, and interventions for their long-term conservation and safety were proposed.
3. Materials and methods
It is essential to note that this research considers the criteria from the proactive approach, specifically the main items applicable at the international level in RSA (Calderón Ramírez et al., 2023), which serve as the basis for establishing SI. These indices enable the measurement of severity and road design by categorizing risk factors within the road network into high, medium, and low severity levels. On the other hand, the research also incorporates criteria from the reactive approach by analyzing crash concentration in road locations. The significance of this combined methodology lies in its comprehensive evaluation of road safety, considering not only RSA items but also crash records, road design parameters, and the identification of HCCP. The integration of these variables guides the definition of actions to improve road safety, as it allows for the targeted allocation of available resources for infrastructure investment, conservation, and maintenance.
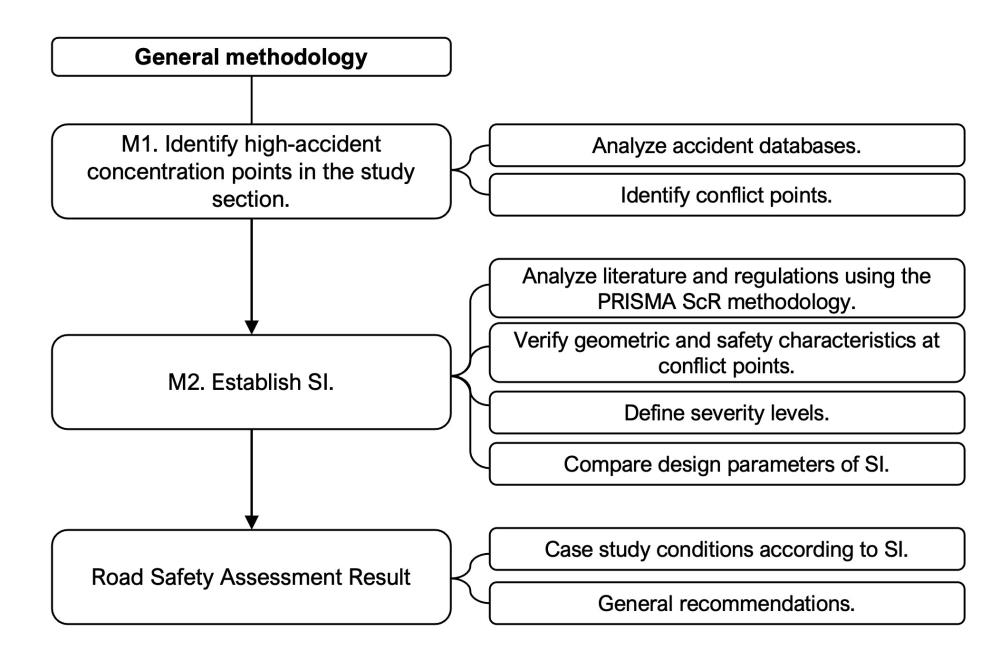
This section outlines the methodology applied in the analysis, detailing the main items to consider in generating SI as tools for measuring road safety in the study segment. It is necessary to identify Points with a High Concentration of Crashes (HCCP), as well as analyze design parameters and crash conditions (M1) to define and validate the SI (M2). At this stage, a review of regulations focused on road safety from various parts of the world, including Mexico, is required to establish the primary items that should compose an RSA. Finally, the results of its application in the study segment will be obtained, as illustrated in Figure 4.
Road safety analysis is a process that enables the investigation of a specific road or road network’s safety level, which can be conducted through various methods. Consequently, road safety analysis may differ and may be called by different names (Paliotto et al., 2024). From this perspective, the present research proposes a distinct methodology that combines a discrete statistical criterion. In this way, a quantitative and replicable procedure is integrated that complements traditional methods of RSA, RSI, or road safety assessments.
3.1. Identification of high crash concentration points (M1)
The development of this section required the use of official crash data recorded for the study area over a defined period, with particular emphasis on the topographic and geometric characteristics of the roadway. Pivot tables in Microsoft Excel were used to preprocess and organize the raw crash data, correcting inconsistencies and ensuring a standardized structure for subsequent analysis. A mathematical model was used to complement this, ensuring the consistency and reliability of the results.
To support this analysis, statistical measures such as mean, variance, and standard deviation were calculated, allowing for a more precise characterization of the distribution of crashes within the study segment (Rodríguez-Alveal et al., 2021). By integrating these statistical tools, the methodology establishes a robust quantitative basis for identifying critical points and guiding safety decisions, while remaining consistent with the broader perspective that “road network safety analysis can be applied on different levels: from single road sections up to the entire road network. Depending on the scope, the methods vary in complexity, data requirements, and expected outcomes” (Paliotto et al., 2024).
The classification of HCCP was then performed in two complementary stages. First, a statistical criterion was applied by analyzing the frequency distribution of crashes by station (kilometer), and using statistical tools such as the Central Limit Theorem (CLT) and the 68-95-99.7 Rule (Salvatore & Reagle, 2002) were employed to interpret the spatial distribution of crashes. This approach allows for the identification of HCCP when the number of crashes at a specific roadway location exceeds 1, 2, or 3 standard deviations (σ) above the mean, which states that in a normal distribution, approximately 68% of the data falls within one standard deviation of the mean, 95% within two standard deviations, and 99.7% within three standard deviations. Second, geometric and road safety criteria were applied, associating each HCCP with the specific value of a geometric item (degree of curvature, slope, maximum superelevation) or with existing safety features (lines and road studs, speed bumps, warning signs, guardrails). A histogram analysis was also conducted to examine data shape and dispersion, considering a minimum sample size of 20 records (Minitab, 2024). By relying on well-established statistical principles, this method facilitates the identification of critical points, making the methodology objective and replicable for studies on mountainous roads or highly irregular topography.
In this way, the HCCPs represent not only statistical accumulations of crashes but also the physical conditions of the roadway that generate them, ensuring a more robust and replicable classification for future studies.
3.2. Establishment of SI (M2)
A methodology was established to define the SI, starting with an analysis of the items used to assess road safety, and identifying those with the highest impact. Subsequently, the geometric and safety characteristics of the road segment were verified, which aided in determining the ranges to be set during the severity level establishment phase. Finally, the SI underwent a validation phase by comparing the design parameters used to define these indices with those outlined in the Manual de Proyecto Geométrico de Carreteras 2018 (Secretaría de Comunicaciones y Transportes [SCT], 2018).
3.2.1. Analysis and definition of the main RSA items
The main RSA items are defined based on a literature review. To achieve this, it is necessary to consider literature analysis methodologies, as established in the Preferred Reporting Items for Systematic Reviews and Meta-Analyses Extension for Scoping Reviews (PRISMA-ScR) (Tricco et al., 2018), which enhances transparency and quality in the preparation of reviews by following a structured framework for the identification, selection, and synthesis of scientific literature. The reference management tool Rayyan, version 2016 (Ouzzani et al., 2016), is used to review titles and abstracts. During this process, publications that do not meet the eligibility criteria or are duplicates are excluded. The literature review requires consulting databases such as Google Scholar and Scopus, chosen for their relevance in the fields of science and engineering based on their content coverage. The methodology and results of this section have been presented in the published article Main Guidelines in Road Safety Audits: A Literature Review (Calderón Ramírez et al., 2023). The search was structured into two categories: 1) document classification: audits, guidelines, methodology, reports. 2) fields of interest: roads, highways, safety, streets, pavements. For English-language searches, the terms audit and guidelines were used, along with road.
The publication selection strategy is divided into four stages. The first stage involves the “identification” of indexed journals, indexed book chapters, peer-reviewed articles, individual case reports, experimental studies, reports, manuals, or guidelines that present the application of the published RSA guidelines, completed in both English and Spanish, with an initial search limited to the databases Google Scholar and Scopus, identifying the keywords established in the titles and abstracts. The second stage, referred to as “review,” involves eliminating publications that appear in more than one database to exclude duplicates. Then, publications are selected through title and abstract reading to meet eligibility criteria, utilizing the Rayyan software tool for scope review. In the third stage, known as “selection,” full-text publications are reviewed to exclude those that do not meet the specified requirements. Finally, in the “inclusion” stage, data from publications that meet the eligibility criteria are analyzed and extracted. A full-text reading is conducted, and relevant information is extracted using a custom Google form, from which the following is obtained: 1) publication characteristics such as document type, title, authors, publication year, validity of the RSA guideline, and study location; 2) study details, including methodology, geographic context, population analyzed, and tools used; 3) study information, including the evaluated variables, such as human, road, and vehicular factors.
Table 1 outlines the eligibility and exclusion criteria for selecting publications related to the population, concept, and context recommended by the methodological framework of the Joanna Briggs Institute (JBI) (Peters et al., 2020), which aids in evaluating the reliability, relevance, and outcomes of scoping reviews.
| Category | Include | Exclude |
|---|---|---|
| Population | Drivers, pedestrians, and cyclists | n/a |
| Concept | Publications addressing RSA and road safety | Publications addressing Road Safety Inspections (RSI) and accidents |
| Context | Developed countries, developing countries, and countries in transition | n/a |
3.2.2. Verification of geometric and safety characteristics at HCCP
An analysis of the specific values of the RSA items is conducted. These data allow for an accurate characterization of their impact on road safety. The information is collected through field inspections, which verify the state of the pavement, signage, and the presence of obstacles that may affect road safety. For this, a detailed topographic survey is consulted, which includes the dimensions of the section, slopes, curvature radius, superelevation, operating speeds, signage, and road safety devices, such as guardrails and lane widths of the HCCPs.
3.2.3. Definition of severity levels
For the definition of the severity levels at HCCP, Pearson’s correlation is used as a statistical measure to assess the strength and relationship between two variables (Sedgwick, 2012). This measure was applied to evaluate the association between each item (degree of curvature, slope, maximum superelevation, lines and studs, speed bumps, warning signs, guardrail) and the number of crashes recorded at HCCP. This method is frequently employed in studies published in scientific journals that specialize in statistical methods and data analysis. Mathematically, Pearson’s correlation (r) (Pearson, 1895) is expressed by the following equation:
Where:
y are the individual values of variables X and Y
y are the means of variables X and Y
The value of r ranges between -1 and 1:
r = 1
r = -1
r = 0
The correlation is interpreted as a measure of the relationship between two variables (Walpole et al., 1999). A positive value indicates a direct relationship, where an increase in one variable is associated with an increase in the other. In contrast, a negative value reflects an inverse relationship, where an increase in one variable corresponds with a decrease in the other. When the correlation coefficient is close to 0, it signifies that there is no significant linear relationship between the variables analyzed. For this analysis, Minitab Statistical Software 21.1.0 was used, allowing for trend analysis and relationship analysis in the data through advanced statistical functions.
Following the mathematical analysis, the severity ranges at the HCCP are established, classifying them into three levels according to their impact on road safety (Dallos, 2015). A low level indicates that deficiencies in the analyzed parameters have a low probability of causing a crash. Medium level indicates that such deficiencies may contribute to the occurrence of a collision or increase its severity. High level implies that the deficiencies pose a significant risk, with a high probability of causing serious or even fatal crashes.
4. Results and discussion
4.1. Identification of Crash Concentration Point (CCP) in the study section
Based on the analysis of the mountainous section in both directions, ascending and descending, a total of 3,453 crashes were recorded, with an approximate average of 144 crashes per year. Heavy vehicles exhibited the highest crash incidence, surpassing light cars by 5% in either direction. According to the FIARUM database, which covers the period from 2000 to 2023 for the case study, these findings classify the highway as a conflict-prone area due to the high number of crashes reported, as well as its geometric and topographic conditions.
The density and cluster analysis of crash locations enables the visualization of specific points where crashes have occurred. Statistically, from the dataset (n = 671) of recorded crash locations over 24 years, an average of approximately three crashes per location was observed in the ascending direction, with a standard deviation of 2.97 (see Table A1 in the Appendix). Conversely, in the descending direction, the analysis yielded an average of 6 crashes per location, with a standard deviation of 11.88 (see Table A2 in the Appendix). These results indicate a higher expected crash occurrence per location in the descending section of the study area compared to the ascending section.
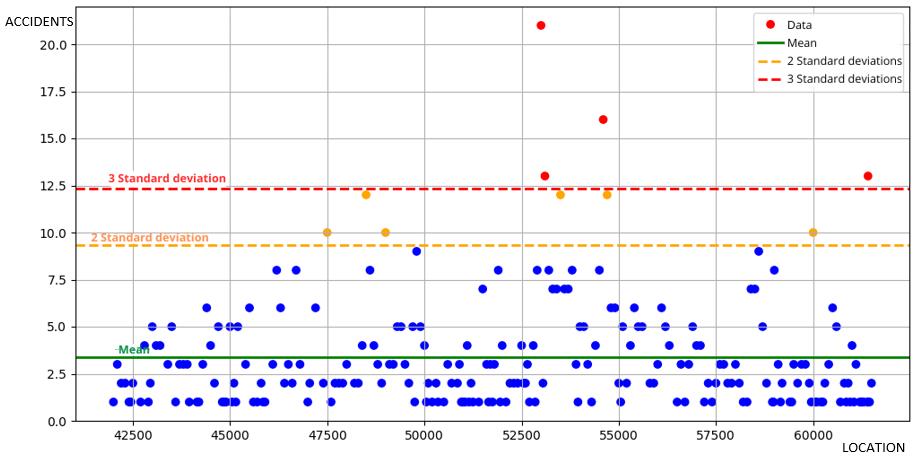
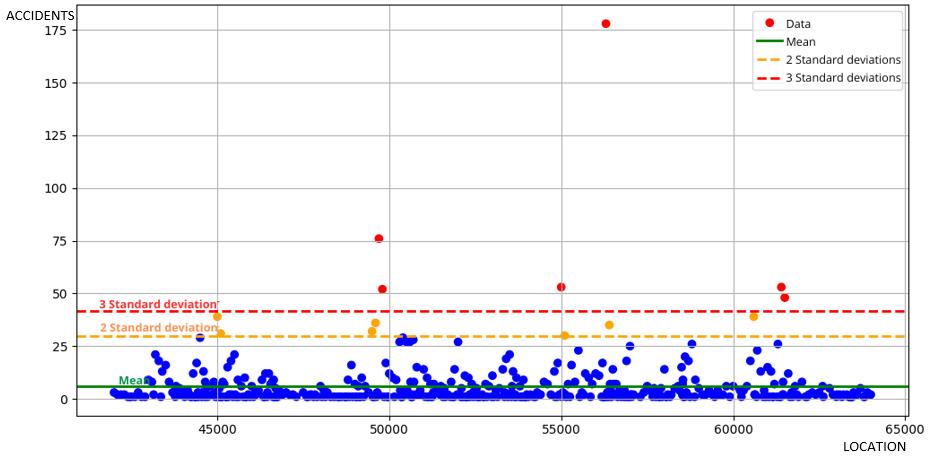
Based on the previously calculated statistical values, Rule 68-95-99.7 was applied to identify conflict zones within the study section (see Figure 5). These locations are classified as CCP because they exceed 1, 2, or 3 standard deviations above the mean crash rate. The mean serves as a quantitative benchmark to determine the expected number of crashes at a given location, based on the collision distribution.

| Mean | 1σ | 2σ | 3σ | |
|---|---|---|---|---|
| Ascent | 3 | 6 | 9 | 12 |
| Descent | 6 | 17 | 29 | 41 |
The values presented in Table 1 represent the mean, indicating the expected occurrence of crashes in both the ascending and descending sections. However, some outliers exceed the mean by more than 1, 2, or 3 standard deviations (σ).
In the ascending section, a total of 28 locations were identified. Specifically, 4 locations recorded at least 12 crashes, 10 locations registered at least 9 crashes, and all 28 locations experienced at least 6 crashes each. These sites are classified as prominent CCPs, as the number of crashes in these areas exceeds the mean by 3, 2, and 1 standard deviation, respectively (see Figure 6).
Similarly, in the descending section, 6 locations were identified with at least 41 crashes, exceeding 3 standard deviations above the mean crash rate. 13 locations recorded at least 29 crashes, surpassing 2 standard deviations above the mean, and 35 locations experienced at least 17 crashes, exceeding 1 standard deviation above the mean. These locations are considered CCP in the study section (see Figure 7).
The analysis was based on a total of 3,453 crashes that occurred between 2000 and 2023 in the mountainous section of the Centinela-La Rumorosa Highway. To assess whether this sample size was sufficient, a statistical power analysis was conducted using Minitab, which determined that a minimum sample size of 357 crashes was required to detect a significant correlation between the variables analyzed with a 95% confidence level. Since the number of records exceeds this threshold, the results are considered representative of crash occurrence on this highway section. However, it is recommended to expand the analysis to other sections with similar characteristics to verify the generalizability of the findings.
4.2. Establishment of SI
To ensure transparency in the methodological process, the definition of thresholds for each parameter was not established arbitrarily but rather by combining three complementary criteria. First, the classification was supported by technical literature and international road safety guidelines (Calderón Ramírez et al., 2023; FHWA, 2018), which document the influence of geometric and safety variables on crash occurrence across different roadway environments. Second, these normative and bibliographic references were statistically validated using the FIARUM crash database. This validation involved comparing the observed crash values at HCCP with the normative ranges and published recommendations using descriptive statistics (mean, variance, and standard deviation) and correlation analyses. Finally, the normative framework provided by the Manual de Proyecto Geométrico de Carreteras (SCT, 2018) was used as a reference, particularly for parameters such as slope, maximum superelevation, and degree of curvature, which define acceptable safety margins under design conditions.
The results obtained from the documentary and normative analysis are presented in detail to define the main RSA items in the publication Main Guidelines in Road Safety Audits: A Literature Review (Calderón Ramírez et al., 2023), from which the SI outlined later are determined. Furthermore, the importance of items and methodologies in the field of road safety, as well as RSA standards, is acknowledged.
Figure 8 presents the results of the search through a flow diagram following the PRISMA-ScR extension. The collected data includes detailed information on key factors and findings identified in each publication, providing essential elements for the development of SI. The extraction of relevant information was conducted through the analysis of the full text of the selected articles, using a customized Google form, from which the following data were gathered: 1) the characteristics of the publication, such as the document type, title, authors, year of publication, validity of the RSA guide, and location of the study; 2) study details, including methodology, geographic context, analyzed population, and tools used; and 3) study information, such as which variables were evaluated, including human factors, road factors, and vehicle factors.
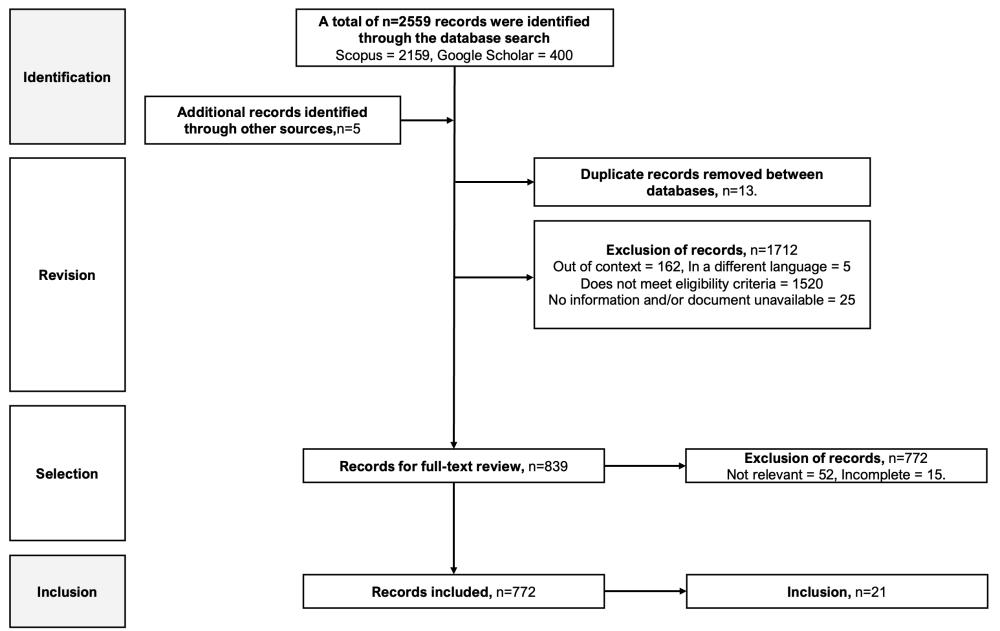
The selection process began with searches in the Google Scholar and Scopus databases, identifying a total of 2,559 publications, to which 5 additional sources were added. After removing 13 duplicate documents, 2,551 titles and abstracts were analyzed. At this stage, 1,712 publications were excluded for various reasons: being out of the scope of the research (n = 162), being written in a language different from the one defined in the eligibility criteria (n = 5), not meeting the established requirements (n = 1,520), or presenting access issues or lack of information (n = 25). The remaining 839 publications were subjected to further evaluation through full-text review. In this phase, 67 documents were discarded as irrelevant (n = 52) or due to lack of access to the whole document (n = 15), resulting in a total of 772 selected publications. Finally, an additional filtering process was applied, selecting 21 publications that contained RSA manuals and case studies, which were included in this literature review.
From the review and analysis, it was determined that the most impactful items are those related to geometric design (L5), which include considerations such as cross slope, intersection design, road alignment, horizontal and vertical alignment, volume and speed, skid resistance, sight distance, and road type. Additionally, items related to horizontal and vertical signage, lighting (L6), and those covering safety devices and road furniture (such as guardrails, delineators, speed reducers), as well as rest areas and service areas (L7), also play a significant role. It is worth noting that these three items belong to the road factor (Calderón Ramírez et al., 2023). To define the SI, the following items were considered: slope, degree of curvature, superelevation, and guardrail.
Based on the identification of HCCPs, an analysis was conducted to verify geometric and safety characteristics, including the degree of curvature, maximum superelevation, maximum slope, horizontal signage, vertical signage, and safety devices. Subsequently, a correlation analysis was performed using Minitab Statistical Software to assess the relationship between each parameter and the incidence of crashes. Additionally, the respective SI values for each of the criteria above were determined, as outlined below.
Degree of curvature
- High level: ≥10°
- Medium level: 10°–5.5°
- Low level: 5.5°–4.5°
The variable exhibits a positive correlation, meaning that as the degree of curvature increases, the number of crashes also rises. For the analyzed road segment, both in ascent (0.220) and descent (0.328), the correlation indicates that higher curvature is associated with a greater incidence of crashes, as sharper curves pose a higher risk.
Maximum Superelevation
- High level: ≤4%
- Medium level: 7%–4%
- Low level: 10%–7%
For the analysis of maximum superelevation, only curves with superelevation were considered, while spiral curves were excluded due to their transverse behavior, which prevents the development of superelevation. The correlation results indicate a higher incidence of crashes as superelevation decreases, according to the study sample in both ascent and descent. In the ascending direction, the correlation is -0.381, whereas in the descending direction, it is -0.200, suggesting that the impact is more significant in ascent.
Slope
- High level: ≥ 6%
- Medium level: 3.5%–6%
- Low level: ≤ 3.5%
This range is classified as high level, a designation that can be validated based on the current regulations outlined in the Manual de Diseño Geométrico de Carreteras (Manual of Geometric Design of Roads) of the SICT, which establishes a maximum slope of 6% for this type of roadway. According to the sample results, this parameter exhibits a non-perfect negative correlation (-0.160) in the ascending direction, indicating that slope does not strongly influence crash incidence in this case. However, in the descending direction, the slope is highly correlated with crash occurrence (r = 0.403). This discrepancy may be attributed to differing conditions: in ascent, vehicles experience greater mechanical strain, whereas in descent, gravity contributes to increased speed, elevating the risk of crashes.
On the other hand, due to the nature of the parameters related to horizontal and vertical signage, evaluation is conducted as an attribute, with 0 representing the absence and 1 representing the presence of these items.
Lines and road studs
- High level: road studs, lane delimiters, or separators present
- Medium level (without reflection): road studs, lane delimiters, and separators without reflection
- Medium level (with reflection): road studs, lane delimiters, and separators with reflection
The characteristics of the studied segment do not allow for a correlation between horizontal signage and crash incidence, as the entire segment features road studs, lane delimiters, and separators, leaving no points for comparison where these items are absent. However, according to the literature review, it has been demonstrated that road markings impact road safety, as they provide drivers with crucial information regarding the road’s trajectory (Babić et al., 2022).
Speed bumps
- High level: no speed bumps are established before a CCP
- Medium level: speed bumps are established before a CCP
The presence of speed bumps before a curve, as indicated by CCP, shows a 43.48% difference in crash incidence, meaning that 56.52% more crashes occur at points where speed bumps are absent.
Warning signs
- High level: no warning signage present
- Low level: warning signage present
- According to the crash analysis results, it was determined that the absence of warning signs indicating an ascending curve contributed to 29% of the crashes. In contrast, for descending curves, this absence accounted for 22% of the crashes.
Due to the nature of the step safety device parameter, the evaluation is analyzed as an attribute, with 0 representing the absence, 0.5 representing the presence but not in compliance with the provisions established in the Manual de Señalización Vial y Dispositivos de Seguridad (Manual of Road Signaling and Safety Devices) (Secretaría de Comunicaciones y Transportes [SCT], 2014), and 1 representing full compliance with the requirements.
Guardrail
- High level: no guardrail present
- Medium level: the guardrail is not ideal according to the AADT, considering the type of vehicles passing through the studied segment
- Low level: guardrail present according to the characteristics of the studied segment
After analyzing all the CCPs, 15 of them, equivalent to 19% of the total locations, did not have a guardrail; specifically, three places were in the ascending direction and 12 in the descending direction. In the ascending direction, 50% of the crashes occurred where a guardrail was present. Still, it did not meet the ideal conditions as specified in the Manual of Road Signaling and Safety Devices (Secretaría de Comunicaciones y Transportes [SCT], 2014). Three-crested guardrails, according to Mexican regulations, are recommended for roadways such as the studied segment, as they require high levels of protection due to their design and traffic conditions. However, along the studied segment, there are curves without guardrails, as well as curves with two-crested guardrails.
From the analysis between crash incidence and the items to which correlation was possible, it is determined that for the ascending direction, the items with the highest crash incidence is superelevation, followed by the degree of curvature, and finally the slope. On the other hand, in the descending direction, the correlations between the items and crashes are listed in the following priority order: slope, degree of curvature, and superelevation. Through the established SI, it was possible to identify the conditions and severity levels for each parameter of the studied segment.
Table 3 presents the minimum, maximum, mean, and standard deviation values of the main geometric parameters associated with the ascending HCCPs, including degree of curvature, slope, and superelevation. These statistics enable a quantitative characterization of roadway conditions in ascending sections and support the definition of the Severity Indices (SI) in Section 4.2.
| Variable | Mean | Standard deviation | Minimum | Maximum |
|---|---|---|---|---|
| Degree of curvature | 11.59 | 4.98 | 1.73 | 18.47 |
| Maximum superelevation | 0.06922 | 0.02439 | 0.02255 | 0.10624 |
| Slope | 0.05600 | 0.01676 | 0.00600 | 0.08160 |
In Table A1 of the Appendix, a detailed view of the distribution of SI across various road safety factors is presented, allowing for the identification of the prevalence of CCPs in relation to degree of curvature, superelevation, slope, signage, and guardrail. This table can be summarized as follows: in the ascending direction, concerning the degree of curvature, 65% of the CCPs present a high SI, 15% show a medium SI, and 20% exhibit a low SI. The analysis reveals that most CCPs (65%) have a high SI, indicating that sharp or poorly designed curves are a significant factor in the occurrence of crashes.
For superelevation, it is observed that almost half of the CCPs (46.7%) have a low SI, while 33.3% showed a medium SI, and 20% exhibited a high SI. This suggests that inadequate superelevation contributes to crashes, although it is not the predominant factor.
Slope stands out as a critical factor, with 42.8% of the CCPs presenting a high SI and 50% a medium SI. Only 7.2% have a low SI, indicating that steep slopes are a significant risk to road safety.
Regarding signage, most CCPs (71.4%) present a low SI, while 28.6% have a high SI. This could indicate that, although signage is essential, its direct influence on CCPs is less significant compared to other factors such as degree of curvature and slope.
Regarding guardrail, 50% of the CCPs present a medium SI, followed by 42.85% with a low SI, and only 7.15% with a high SI. This suggests that, while guardrails are necessary, their impact on the severity of CCPs varies and is generally lower compared to factors such as slope.
In Table A2 of the Appendix, a detailed view is provided regarding the distribution of SI in the descending direction for road safety factors, allowing for the identification of how these factors influence the occurrence of CCPs.
Table 4 presents the minimum, maximum, mean, and standard deviation values of the main geometric parameters associated with the descending HCCPs, including degree of curvature, slope, and superelevation. These statistics allow for a quantitative characterization of roadway conditions in descending sections and support the definition of the Severity Indices (SI) in Section 4.2.
| Variable | Mean | Standard deviation | Minimum | Maximum |
|---|---|---|---|---|
| Degree of curvature | 16.89 | 6.12 | 4.47 | 25.58 |
| Maximum superelevation (%) | 0.08757 | 0.03040 | 0.03133 | 0.17442 |
| Slope (%) | 0.05461 | 0.01819 | 0.00600 | 0.10940 |
The analysis reveals that most CCPs (86.95%) exhibit a high SI related to the degree of curvature, suggesting that sharp or poorly designed curves are a significant factor in the occurrence of crashes.
Regarding superelevation, 86.95% of the CCPs have a low SI, 4.36% have a medium SI, while only 8.69% present a high SI. This suggests that inadequate superelevation is not the main contributing factor to CCPs in this sample.
The slope shows a more balanced distribution, with 39% of the CCPs presenting a high SI and 48.8% presenting a medium SI. Only 12.2% have a low SI, indicating that steep slopes pose a considerable risk to road safety.
For signage, most of the CCPs (78%) present a low SI, while 22% have a high SI. This could indicate that, although signage is essential, its direct influence on CCPs is less significant compared to other factors such as degree of curvature and slope.
Regarding guardrails, 31.7% of the CCPs present a high SI, followed by 53.65% with a low SI and 14.65% with a medium SI. This suggests that, while guardrails are necessary, the impact on the severity of CCPs varies significantly.
The regulations establish a maximum slope value of 6%, which aligns with the low SI determined in the analysis. This alignment suggests that complying with the rules is not only a matter of regulatory adherence but also an effective measure to maintain road safety at acceptable levels. This value, applied to the studied segment, complies with the maximum allowed by the regulations for roads with similar conditions. Adhering to a maximum 6% slope is crucial to ensure vehicular stability and user safety, especially in mountainous segments that present additional design and maintenance challenges. This alignment, when compared with the regulations, strengthens the reliability of the design and highlights the commitment to promoting road safety in the developed infrastructure.
In general, it can be concluded that the studied segment in the ascending direction shows a greater correlation with the items in the following order: superelevation, degree of curvature, and slope. This indicates that, in ascending segments, the proper management of superelevation is crucial for road safety, followed by the correct implementation of the degree of curvature, and finally, the slope. In contrast, in the descending segment, the order of influence differs, with slope being closely related to crashes, followed by the degree of curvature, and finally, superelevation. This finding suggests that, in descents, managing steep slopes is essential for preventing crashes. At the same time, the degree of curvature and superelevation also play important roles, though to a lesser extent.
Whenever possible, it is recommended to manage superelevation in the ascending segment. Implementing and maintaining proper superelevation in ascending segments is crucial to improving road safety. Superelevation should be designed to counteract the centrifugal force in curves, improving the vehicle’s adhesion to the pavement and reducing the risk of skidding. It is essential to review and adjust the existing superelevation in ascending segments, conduct regular inspections, and perform preventive maintenance to ensure the superelevation remains in optimal condition.
Ensuring that the degree of curvature on roads is designed and maintained correctly is essential for safety, both in ascents and descents. It is recommended to evaluate and redesign curves with a high incidence of crashes, as well as to install proper signage that warns drivers of the presence of sharp curves.
Proper slope management in downhill sections is crucial, as steep slopes must be carefully designed and maintained to avoid vehicle control issues and brake overheating. In this context, the implementation of emergency braking systems is recommended as a measure to support road safety.
An integrated approach should be considered, encompassing a comprehensive review of all aspects of geometric design, including horizontal and vertical alignment, intersection design, and pavement slip resistance. Periodic RSA should be conducted to identify and correct deficiencies in the infrastructure, along with the incorporation of monitoring systems to evaluate road conditions and make necessary adjustments.
Additionally, improving horizontal and vertical signage is crucial for providing clear and timely information to drivers. Promoting road safety education programs that emphasize safety in mountainous segments is also essential, through the installation of signage indicating the presence of dangerous curves, steep slopes, and appropriate speed limits.
The analysis of the SI in comparison with current regulations, as outlined in the Geometric Design Manual for Roads (2018) (Secretaría de Comunicaciones y Transportes [SCT], 2018), yields key findings. Both superelevation and the degree of curvature defined at a low level are aligned with the maximum permitted values, confirming the adequacy of the design in relation to current regulations. Compliance with the rules is crucial for maintaining vehicle stability and ensuring user safety under operational conditions. This alignment ensures safer and more efficient driving in the specific conditions of the studied segment.
The findings regarding the influence of slope, degree of curvature, and superelevation on crash rates are consistent with studies that have analyzed the relationship between road geometry and safety. Previous research has demonstrated that steep slopes and sharp curves significantly increase crash rates on mountainous roads (FHWA, 2018; Gomes et al., 2021). Specifically, slope in descending segments remains a determining factor in the occurrence of crashes. In comparison with the report by (Zegeer et al., 2002), which documented that slopes greater than 6% significantly increase the risk of crashes due to brake overheating and difficulty in vehicle control, these results highlight the particularity of the findings in mountainous environments, as opposed to urban or low-speed roads, where slope is less decisive in crash rates (Federal Highway Administration (FHWA), 2018).
The statistical analysis confirmed that the degree of curvature is a key factor, particularly in curves with reduced radius, where drivers may not adequately anticipate the road’s trajectory. In comparison with studies like Tian et al. (2023), which analyzed high-speed roads, it was found that on mountainous roads, the degree of curvature has a greater impact, as the margins for maneuvering are smaller and vehicles tend to lose stability in sharp curves.
While the results obtained reinforce much of the existing literature, they also differ in some respects. Compared to previous studies that considered signage and road safety devices as key factors, this analysis revealed a stronger relationship between geometric variables and crash rates. This could be due to the nature of the case study, as design errors in mountainous roads can significantly amplify the risk of crashes compared to urban or flat roads. Similarly, it is essential not to overlook that the analysis of signage and safety devices previously conducted indicates the need to implement preventive markings on hazardous curves and to install safety guardrails to prevent crashes and reduce their severity (Montoya-Alcaraz et al., 2020).
The comparison with previous studies in road safety revealed significant differences in both the type of results and their level of practical application. While most of the reviewed works are framed within normative or methodological approaches such as the FHWA (2006), the Colombian methodological proposal (Dallos, 2015), the conceptual review for D. Babić & Ferko (2022), or the multicriteria framework of Calderón Ramírez et al. (2023) the present research contributes a quantitative and applied instrument, based on real accident data from the Centinela–La Rumorosa highway, representing an advance over studies that only systematize international guidelines or identify risk factors qualitatively.
In comparison with empirical works (Monclús et al., 2008; Swanson et al., 2022; Yellman & Sauber-Schatz, 2022), this study does not restrict itself to describing accident rates or associated costs, but develops a methodology that integrates historical records with reproducible statistical tools for identifying critical segments. Likewise, in contrast with global reviews (Heydari et al., 2019); Yan et al., 2023), which emphasize the need to strengthen evidence in low-income countries, this research provides a model adaptable to contexts where road safety analyses are scarce or applied inconsistently.
In this sense, the main contribution of this work lies in articulating international normative frameworks with local statistical validation, moving from conceptual approaches toward a prioritization model applicable to real roads. In doing so, it complements the existing literature by demonstrating the feasibility of translating general guidelines into specific quantitative indicators, thereby strengthening decision-making in road safety and infrastructure conservation.
Unlike traditional approaches based on empirical observations or historical crash reviews, this study employs the Central Limit Theorem and the 68-95-99.7 Rule, offering a more quantitative and replicable method for identifying critical points. While previous investigations have focused on conventional spatial analyses, this approach provides a more precise statistical assessment. Numerous studies have concentrated on urban or high-speed roads, while this methodology contributes to the study of mountainous roads, a less explored segment in road safety. This methodology represents an innovation for assessing and managing road safety in roads with adverse conditions.
Despite the progress made in this research, several limitations should be considered for future work. The accuracy of the analysis heavily depends on the quality and availability of crash and road condition data. While the proposed methodology has been validated for the case of the Centinela-La Rumorosa Highway, its applicability to other road environments may require adaptations due to differences in infrastructure and regulations. This research primarily focuses on geometric and infrastructure aspects, excluding other factors such as driver behavior, changes in road regulations, environmental conditions, and socioeconomic factors, all of which also influence road safety (Federal Highway Administration [FHWA], 2006).
5. Conclusions
This research validated a methodology for evaluating road safety on mountainous highways, based on the Centinela – La Rumorosa Highway case study. The approach integrates statistical, geometric, and normative criteria to identify and classify HCCP, supporting preventive and corrective measures in road infrastructure. The main findings are summarized as follows:
-
Identification of High Crash Concentration Points (HCCP): Using historical crash data (2000–2023) and spatial analysis techniques, segments with a higher concentration of crashes were identified, highlighting critical areas requiring targeted interventions.
-
Definition of Severity Indices (SI): SI were established based on statistical methods (Central Limit Theorem and 68-95-99.7 Rule) and supported by Road Safety Audit (RSA) items, allowing for an objective classification of HCCP severity. The procedure followed is illustrated in Figure 9.
-
Impact of Geometric Parameters: Pearson’s correlation analysis revealed slope, curvature, and superelevation as the main risk factors. In ascending segments, superelevation and curvature had a greater influence, while in descending segments, slope was dominant, often exceeding design limits and increasing the likelihood of crashes.
-
Applicability and replicability: The methodology, validated in this case study, combines RSA principles, statistical tools, and optimization models, enabling structured evaluations of road safety. Although designed for a mountainous context, it is adaptable to other highways and road networks, providing a replicable framework for decision-making and infrastructure management.
-
Discrepancy between regulations and actual conditions: Field measurements showed that in some segments, slope and superelevation exceeded permissible values defined by design standards. This discrepancy underscores the importance of regular maintenance and monitoring to mitigate the risk of vehicle instability and crashes.

Furthermore, the literature review confirmed that each country applies different approaches to road safety evaluations; however, geometric design items such as slope, curvature, superelevation, and safety devices consistently emerge as critical factors. The comparison with international guidelines underscores the potential of Severity Indices (SI) as a practical tool for classifying risks and prioritizing interventions.
The methodology proposed here is not intended to replace traditional audits or inspections but rather to serve as an auxiliary tool for road safety evaluations, providing a quantitative framework for prioritizing interventions. Although initially developed for a mountainous highway, it is adaptable to a wide range of road environments and scales, from specific segments to entire networks, thereby contributing to proactive and cost-effective safety management.
By generating SI tailored to each road’s geometric parameters and crash data, the method reflects local conditions and risks while supporting targeted safety improvements. Importantly, conflict points without prior crash history should not be disregarded, as roadway conditions may still define them as potential HCCPs. The SI highlights the need to prioritize interventions: high-severity items demand urgent attention, medium-severity items allow deferred intervention, and low-severity items have minimal impact on road safety.
Finally, this study presents certain limitations that should be considered when interpreting the results. First, the analysis was based on the FIARUM crash records, which, although a reliable source, may contain underreporting or limitations in georeferencing accuracy. Second, the methodology was applied to a specific mountain road segment, which limits the generalizability of the findings to other roadway contexts without further adaptations. Likewise, some road safety items, such as speed bumps, were analyzed solely based on the information available in the database and field inspections, without considering a specific range of influence as a function of distance or conducting a detailed assessment of operating speed. In the case of the parameter “lines and road studs” (delimiters), the classification did not include a low level because, in the analyzed segment, all conflict points presented some delimiters. For this reason, the classification was limited to differentiating between delimiters with and without reflection, which represented higher or lower risk levels, but not the total absence of the item. Finally, this work focused on geometric and infrastructure parameters, without incorporating human or vehicular factors, which also influence road safety and should be integrated into future research.
CRediT contribution
Itzel Núñez López: Conceptualization, data curation, formal analysis, investigation, methodology, project administration, resources, software, validation, visualization, writing—original draft. Leonel García: Data curation, investigation, supervision, validation, writing—review & editing. Julio Calderón-Ramirez: Data curation, investigation, supervision, validation, writing—review & editing. Marco Montoya-Alcaraz: Data curation, investigation, supervision, validation, writing—review & editing. Manuel Gutiérrez: and Alejandro Sánchez-Atondo: Data curation, investigation, supervision, validation, writing—review & editing.
Declaration of competing interests
The authors report no competing interests.
Declaration of generative AI use in writing
This research work has benefited from the use of ChatGPT, a generative AI tool, to enhance the readability and language of the text. The AI was used exclusively to improve clarity, coherence, and grammar; all substantive content, analysis, and interpretations are the sole responsibility of the authors.
Ethics statement
This study did not require formal ethics approval, as it utilized data exclusively from publicly available open sources. The data analyzed was publicly accessible and did not include personally identifiable information or sensitive content. All research activities complied with ethical standards for the use of secondary data.
Funding
The author(s) declare that no financial support was received for the research, authorship, and/or publication of this article.
Editorial information
Handling editor: Haneen Farah, Delft University of Technology, Netherlands.
Reviewers: Andrea Paliotto, University of Florence, Italy; Alyssa Ryan, Michigan State University, United States of America.
Submitted: 24 April 2025; Accepted: 30 September 2025; Published: 24 October 2025.
Appendix
| Stationing | Crashes (2020-2023) | Safety device | Horizontal signage | Vertical signage | |||||
|---|---|---|---|---|---|---|---|---|---|
| Maximum Superelevation (%) | Degree of curvature (°) | Slope (%) | Guardrails | Lines | Road studs | Speed bumps | Warning signs | ||
| 53000 | 21 | 3.80* | 16.55* | 6.02* | 0.5** | 1** | 0* | 0* | 1*** |
| 53100 | 13 | 3.17* | 1.73*** | 6.50* | 0.5** | 1** | 1** | 0* | 0* |
| 45500 | 6 | 2.25* | 9.68** | 6.23* | 0.5** | 1** | 1** | 0* | 1*** |
| 46300 | 6 | 5.93** | 13.31* | 5.20** | 0* | 1** | 1** | 0* | 0* |
| 46700 | 8 | 6.35** | 11.16* | 5.69** | 0.5** | 1** | 1** | 0* | 1*** |
| 54600 | 16 | 6.62** | 16.38* | 4.56** | 1*** | 1** | 1** | 0* | 0* |
| 59000 | 8 | 6.39** | 9.17** | 6.70* | 1*** | 1** | 1** | 0* | 1*** |
| 51900 | 8 | 6.53** | 7.54** | 6.46* | 0.5** | 1** | 1** | 0* | 1*** |
| 54700 | 12 | 8.71*** | 16.92* | 6.88* | 1*** | 1** | 1** | 0* | 0* |
| 54800 | 6 | 8.49*** | 14.03* | 8.04* | 1*** | 1** | 1** | 0* | 1*** |
| 54900 | 6 | 8.10*** | 15.99* | 8.16* | 1*** | 1** | 1** | 0* | 1*** |
| 58400 | 7 | 9.67*** | 18.47* | 6.78* | 1*** | 1** | 1** | 0* | 1*** |
| 47200 | 6 | 9.57*** | 14.34* | 5.87** | 0.5** | 1** | 1** | 0* | 1*** |
| 52900 | 8 | 10.62*** | 16.55* | 5.31** | 0.5** | 1** | 1** | 0* | 1*** |
| 53300 | 7 | 7.63*** | 11.93* | 5.91** | 1*** | 1** | 1** | 0* | 1*** |
| 49000 | 10 | Cross slope | 12.43* | 7.24* | 0.5** | 1** | 1** | 0* | 0* |
| 48500 | 12 | Cross slope | 12.69* | 5.18** | 0.5** | 1** | 1** | 0* | 1*** |
| 54500 | 8 | Cross slope | 3.71*** | 7.82* | 1*** | 1** | 1** | 0* | 0* |
| 55400 | 6 | Cross slope | 4.99*** | 4.15** | 0.5** | 1** | 1** | 0* | 0* |
| 56100 | 6 | Cross slope | 4.13*** | 5.52** | 0.5** | 1** | 1** | 0* | 1*** |
| 46200 | 8 | n/a | 5.84** | 0* | 1** | 1** | 0* | 1*** | |
| 48600 | 8 | n/a | 4.62** | 0.5** | 1** | 1** | 0* | 1*** | |
| 49800 | 9 | n/a | 6.33* | 0.5** | 1** | 1** | 0* | 0* | |
| 53200 | 8 | n/a | 5.48** | 0.5** | 1** | 1** | 0* | 1*** | |
| 53500 | 12 | n/a | 2.01*** | 1*** | 1** | 1** | 0* | 1*** | |
| 53800 | 8 | n/a | 3.86** | 1*** | 1** | 1** | 0* | 1*** | |
| 58600 | 9 | n/a | 3.85** | 1*** | 1** | 1** | 0* | 1*** | |
| 61410 | 13 | n/a | 0.60*** | 1*** | 1** | 1** | 0* | 1*** | |
| Stationing | Crashes (2020-2023) | Safety device | Horizontal signage | Vertical signage | |||||
|---|---|---|---|---|---|---|---|---|---|
| Maximum Superelevation (%) | Degree of curvature (°) | Slope (%) | Guardrails | Lines | Road studs | Speed bumps | Warning signs | ||
| 56300 | 178 | 8.20* | 23.39* | 9.36*** | 1*** | 1** | 1** | 1*** | 1*** |
| 49700 | 76 | 10.94* | 25.58* | 10.70*** | 0* | 1** | 1** | 1*** | 1*** |
| 5500 | 53 | 6.22* | n/a | 0.5** | 1** | 1** | 0* | 1*** | |
| 5500 | 53 | 6.21* | n/a | 0.5** | 1** | 1** | 0* | 1*** | |
| 45100 | 31 | 6.18* | 17.67* | 11.21*** | 0* | 1** | 1** | 0* | 1*** |
| 50400 | 29 | 6.81* | 20.29* | 10.30*** | 1*** | 1** | 1** | 1*** | 1*** |
| 50700 | 28 | 7.41* | 18.58* | 10.36*** | 0* | 1** | 1** | 0* | 1*** |
| 50300 | 27 | 6.03* | 20.29* | 9.69*** | 1*** | 1** | 1** | 0* | 1*** |
| 50600 | 27 | 6.29* | n/a | 0* | 1** | 1** | 0* | 1*** | |
| 45500 | 21 | 7.46* | 14.66* | 12.84*** | 0* | 1** | 1** | 1*** | 1*** |
| 53500 | 21 | 6.22* | n/a | 1*** | 1** | 1** | 0* | 1*** | |
| 58600 | 20 | 6.10* | 18.15* | 17.44*** | 1*** | 1** | 1** | 0* | 0* |
| 56900 | 18 | 6.60* | 15.17* | 12.42*** | 1*** | 1** | 1** | 0* | 1*** |
| 43300 | 18 | 7.22* | n/a | 0* | 1** | 1** | 1*** | 1*** | |
| 45400 | 18 | 6.60* | n/a | 0* | 1** | 1** | 0* | 1*** | |
| 54900 | 17 | 6.47* | n/a | 1*** | 1** | 1** | 0* | 1*** | |
| 61400 | 53 | 4.10** | 13.87* | 11.02*** | 1*** | 1** | 1** | 0* | 1*** |
| 49800 | 52 | 5.91** | 25.58* | 3.84* | 0* | 1** | 1** | 0* | 1*** |
| 61500 | 48 | 3.60** | 6.31** | 3.13* | 1*** | 1** | 1** | 1*** | 1*** |
| 45000 | 39 | 5.98** | 17.67* | 7.23*** | 1*** | 1** | 1** | 1*** | 1*** |
| 49600 | 36 | 4.13** | 25.58* | 8.19*** | 0.5** | 1** | 1** | 0* | 0* |
| 56400 | 35 | 5.91** | 23.39* | 4.86** | 1*** | 1** | 1** | 0* | 1*** |
| 49500 | 32 | 5.22** | n/a | 1*** | 1** | 1** | 1*** | 0* | |
| 55100 | 30 | 5.80** | 17.93* | 9.18*** | 0* | 1** | 1** | 0* | 0* |
| 44500 | 29 | 5.70** | 4.62*** | 10.33*** | 0.5** | 1** | 1** | 0* | 0* |
| 50500 | 27 | 5.94** | n/a | 1*** | 1** | 1** | 0* | 1*** | |
| 52000 | 27 | 5.51** | n/a | 1*** | 1** | 1** | 0* | 1*** | |
| 50500 | 27 | 5.94** | n/a | 1*** | 1** | 1** | 0* | 1*** | |
| 58800 | 26 | 4.26** | 10.46* | 9.89*** | 1*** | 1** | 1** | 0* | 1*** |
| 61300 | 26 | 3.74** | 4.47*** | 7.13*** | 1*** | 1** | 1** | 0* | 1*** |
| 57000 | 25 | 5.40** | n/a | 0.5** | 1** | 1** | 0* | 0* | |
| 55500 | 23 | 5.42** | n/a | 1*** | 1** | 1** | 0* | 1*** | |
| 534000 | 19 | 5.24** | 17.59* | 13.42*** | 1*** | 1** | 1** | 0* | 1*** |
| 58700 | 18 | 4.91** | n/a | 0.5** | 1** | 1** | 0* | 1*** | |
| 58700 | 18 | 4.94** | n/a | 1*** | 1** | 1** | 0* | 1*** | |
| 56200 | 17 | 3.74** | n/a | 0* | 1** | 1** | 0* | 0* | |
| 49900 | 17 | 5.27** | n/a | 0* | 1** | 1** | 0* | 0* | |
| 60600 | 39 | 2.90*** | 15.05* | 9.33*** | 1*** | 1** | 1** | 0* | 1*** |
| 60700 | 23 | 3.26*** | 15.05* | 8.30*** | 1*** | 1** | 1** | 1*** | 1*** |
| 43200 | 21 | 0.69*** | n/a | 0* | 1** | 1** | 0* | 0* | |
| 43200 | 21 | 0.69*** | n/a | 0* | 1** | 1** | 0* | 1*** | |
| 60500 | 18 | 1.54*** | 17.12* | 12.24*** | 1*** | 1** | 1** | 1*** | 1*** |