What Characterizes Bicycle and E-Scooter Accidents Not Included in Official Accident Statistics? Lessons Learned From the ReCyCLIST Project in Agder, Norway
Abstract
This study explores the characteristics of bicycle, e-bike, and e-scooter accidents that are not included in official Norwegian accident statistics, focusing on findings from the ReCyCLIST project in Agder County. Traditional accident reporting systems overlook most incidents involving vulnerable road users (VRUs), particularly single accidents, which represent the majority of such cases. ReCyCLIST introduced a digital self-reporting tool deployed in hospitals and clinics, collecting 671 accident cases between June 2022 and April 2024. The study analyses 487 incidents that occurred in traffic environments, revealing that 73% were single accidents, predominantly caused by infrastructure issues or loss of balance, rather than collisions. The data also highlight demographic differences in accident patterns by age, gender, and vehicle type. Notably, women were more frequently involved in e-scooter accidents, and men were overrepresented in racing bike collisions. Multivariate analysis shows that vehicle type, especially racing bikes, is a strong predictor of collisions. The findings emphasize the critical role of underreported single accidents and provide actionable insights for urban planning and policy development aimed at improving micromobility safety.
1. Introduction
Underreporting of bicycle accidents in the official statistics is a well-known problem, common for many countries (Shinar et al., 2018). Most bicycle and e-scooter accidents are single accidents, and usually not registered by the police. Hence, they are not included in the official statistics, neither in Norway nor in other countries (Schepers et al., 2015; Veisten et al., 2007). According to data from Oslo Emergency Clinic the number of cyclists injured in road traffic accidents is twenty times higher than what is registered in the official road accident statistics, and e-scooter accidents are even less reported (Norwegian Public Roads Administration, 2021).
Furthermore, underreporting of bicycle accidents is probably increasing due to the successful promotion of active transport and restrictions of car use in the cities, resulting in less crashes with motor vehicles, but possibly more single accidents (Norwegian Public Roads Administration, 2021). One consequence of this underreporting of single accidents is that the risk factors influencing most bicycle accidents (single accidents) are neglected, i.e., issues related to infrastructure and maintenance. The risk factors being addressed are typically concerned with the risk of being hit by motor vehicles, even if this risk is dramatically reduced. The recent increase of e-scooters, and e-scooter single accidents (Badia & Jenelius, 2023), adds importantly to this picture, underlying the need to change both the focus and the data basis for safety efforts for these vulnerable road users.
Given that most bicycle and e-scooter accidents are not registered in the official statistics, we lack important knowledge about these accidents. What are the typical accident patterns? Are they similar for bicycles, e-bikes and e-scooters? Do accident rates vary by gender and age group across different vehicle types?
The project ReCyCLIST (Recording Cyclist Crashes and Long-term Injury Consequences by new Smart Tools) has developed and utilized a new tool to register accidents with bicycle, e-scooters, and other forms of micro mobility, capturing also the many single accidents which are typically not registered in official statistics. Thus, ReCyCLIST provides vital new insights that will add importantly to our understanding of the accidents for large and growing VRU groups.
2. Method and data
The ReCyCLIST project was initiated in Agder county, Norway in 2021. Agder is the southernmost county in Norway containing a total of 320 000 inhabitants. Accident data was collected in three cities, Kristiansand (112 000 inhabitants), Arendal (45 000 inhabitants) and Flekkefjord (9 000 inhabitants). The three cities all have hospital units that together serve the whole county. Accident registrations were also conducted at Municipal Emergency Clinics in Kristiansand and Arendal; in Flekkefjord the Emergency Clinic is an integrated part of the hospital. In both Arendal and Kristiansand the municipal emergency clinics are located in close proximity to the local hospital.
Most injured cyclists and e-scooter riders go to the local emergency clinic for treatment, but many are transferred to the hospital for X-rays and further care. In such cases, most will receive information about the option to register the accident at the emergency clinic, but they can also register it later at the hospital or from home. The registration form itself includes a question about whether the accident has already been registered (e.g., at the emergency clinic), and if so, the respondent is directed out of the form (to avoid double counting). The most seriously injured bicyclists are brought by ambulance directly to the emergency room at the hospital.
The project implemented a digital accident registration tool in hospital departments (emergency rooms, accident and emergency clinics, trauma outpatient clinics, intensive care units, orthopedic units, radiology departments) and municipal emergency clinics across Agder County, Norway[1]. The tool was used to register accidents involving bicycles, e-scooters, and other micro-mobility devices from June 1, 2022, to April 30, 2024[2].
Upon arrival at the hospital or emergency clinic, patients were informed about the project and asked to register their accident using their mobile phone. They could do this by scanning a QR code or copying a short URL displayed on posters and leaflets at the facility. Health personnel were also available to assist with the registration process, either on the patients’ mobile devices or using a project-provided iPad. Most registrations were conducted independently by the patients.
The most seriously injured patients, not able to register their accident when arriving at the hospital, were approached by health personnel at the intensive care units and informed about the project when the patients were able to register (either themselves or on iPad) or upon departure from the hospital. In addition, health personnel were also equipped with business cards with information, QR codes and links, which they could give to patients, enabling patients to register their accident later from home.
The QR code directed patients to a digital questionnaire developed by TØI and Walr/MiPro, that collected detailed information about the vehicle, the type of accident, and various accident characteristics (Bevan, 2022). A notable and innovative feature of the registration process was the ability to locate the accident site using Google Maps and Street View, providing precise geographic data for analysis.
The total sample consists of 671 accidents. Of these, a total of 57 accidents were classified as play/sport accidents based on free text given by the respondent and omitted from most of the analyses presented here. These are typically accidents happening in skate parks and ramps, downhill tracks, velodrome etc. Furthermore 177 accidents happened outside of traffic environment, such as in forests and nature areas, mountain biking trails, bicycle and skateboard ramps, playgrounds, and similar locations. Some accidents are both play/sport accidents and located in a non-traffic environment. In most of the analyses presented here, we use the traffic sample consisting of 487 accidents that happened in a traffic environment.
Compared to women, men are significantly more involved in play/sport accidents (11.6 % vs. 3.1 %, χ2=14.6, p < 0.001) and in accidents outside the traffic environment (33.1% vs. 15.7%, χ2=24.3 p < 0.001). However, men also constitute most traffic accidents in our sample (56% vs. 44% (two respondents did not answer the question about gender)).
Initially, the ambition was to have full coverage of bicycle and micromobility accidents in Agder County. However, it became evident after some time that this was not realistic for different reasons. We did not manage to include most of the patients not visiting the hospital or the emergency clinics but coming to their general practitioner for treatment of injuries from bicycle or micromobility accidents. In addition, we experienced that not all health personnel at the relevant hospital departments and emergency clinics were aware of the project and/or informed the patients. Especially during the summer holidays, with many substitutes, we saw a downward trend in accident registrations. Finally, not all patients wanted to register their accident and/or they started filling in but did not finalize the questionnaire. The coverage is therefore incomplete, and the exact coverage rate is challenging to estimate. However, the project records contain ten times more bicycle accidents than the official police-reported data, see section 3.2.
For single accidents we have identified a broad number of variables that could contribute to the accident and grouped them together in the three following types: Infrastructure, technical failure and loss of balance. The following elements have been grouped together as “infrastructure”: kerbs, potholes, stones, poles, cracks, gravel and object in the road. “Technical failures” cover technical failure with the vehicle and obstruction to the wheel. “Loss of balance” consist of the following mechanisms: “slipped and lost balance”, "lost balance (due to distraction from mobile etc.), “lost balance for other reasons”.
On the questions about accident mechanism, respondents could indicate more than one alternative. For instance, some answered both that an infrastructure element contributed to the accident, and that a technical failure contributed. When presenting the results, such accidents are counted both as an infrastructure accident and as a technical failure accident.
3. General results
3.1. Most accidents are single accidents
In the following we present descriptive statistics about accident and accident types distributed by vehicle type, age groups, gender etc. These are all accidents that happened in a traffic environment.
Figure 1 shows the distribution of traffic accident types by vehicle type. The category Skateboards ++ includes roller skates, roller blades, hoverboards, roller skis, BMX, tricycles and others.
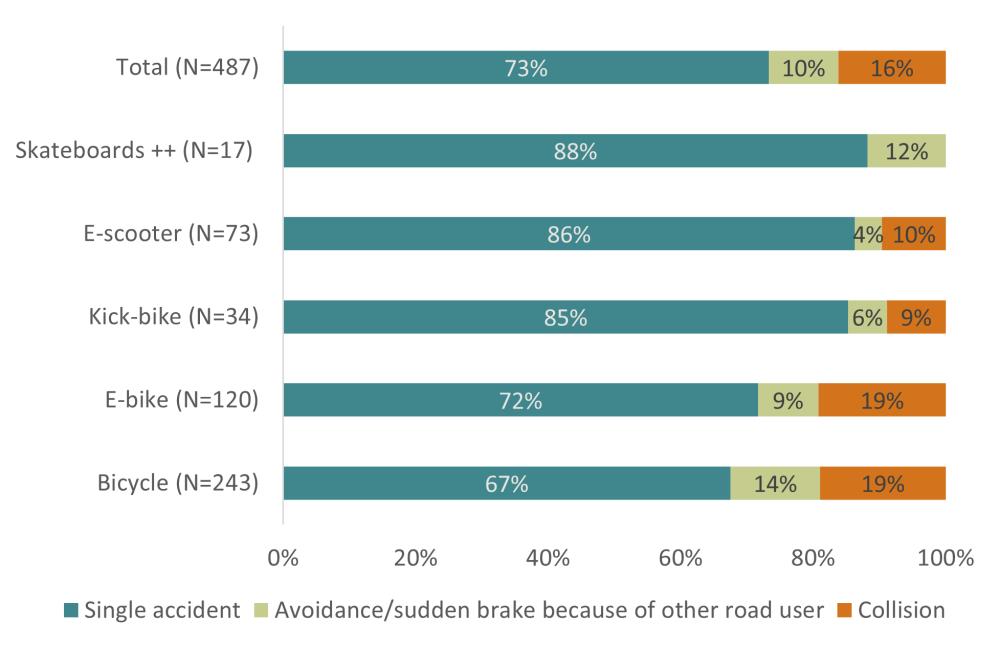
Most accidents are single accidents. Bicyclists riding ordinary bicycles or e-bikes are significantly more involved in collisions or conflicts than micro mobility users (χ2=17.6, p ≤ 0.024), but also for cyclists, single accidents constitute a large majority of accidents, nearly 70%.
Figure 2 gives the distribution of accidents by age group and vehicle type.
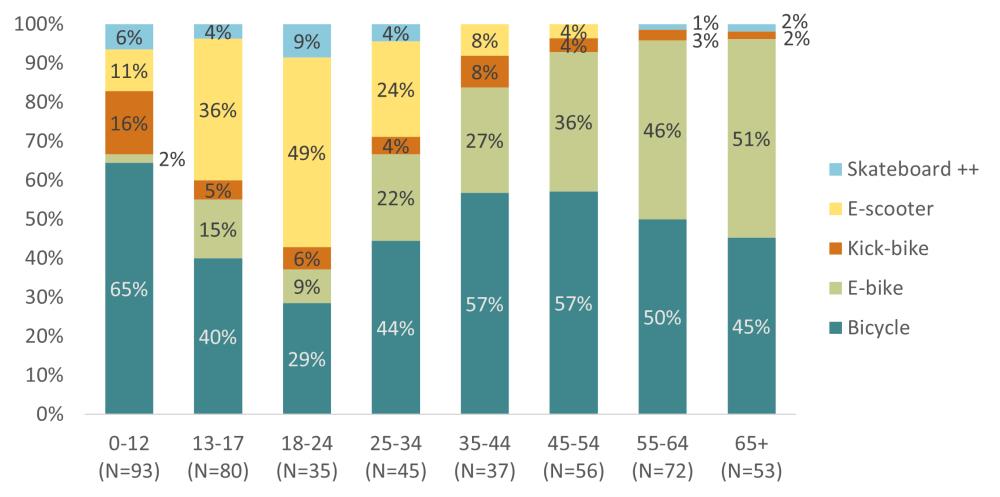
There is a clear pattern in accident figures when broken down by age group and vehicle type. A chi-square test confirms a significant association between age group and vehicle type (χ²=171.6, p ≤ 0.001).
E-scooter accidents are most common among teenagers and young adults, whereas e-bikes are most common in the older age groups. In most groups bicycle accidents are more frequent, apart from the age group 18–24 where e-scooter accidents predominate and in the oldest age groups where e-bikes are even more common than ordinary bicycles. Among children, accidents with ordinary bicycles are much more frequent than accidents with other vehicle types.
Figure 3 shows the distribution of vehicle types for men and women.
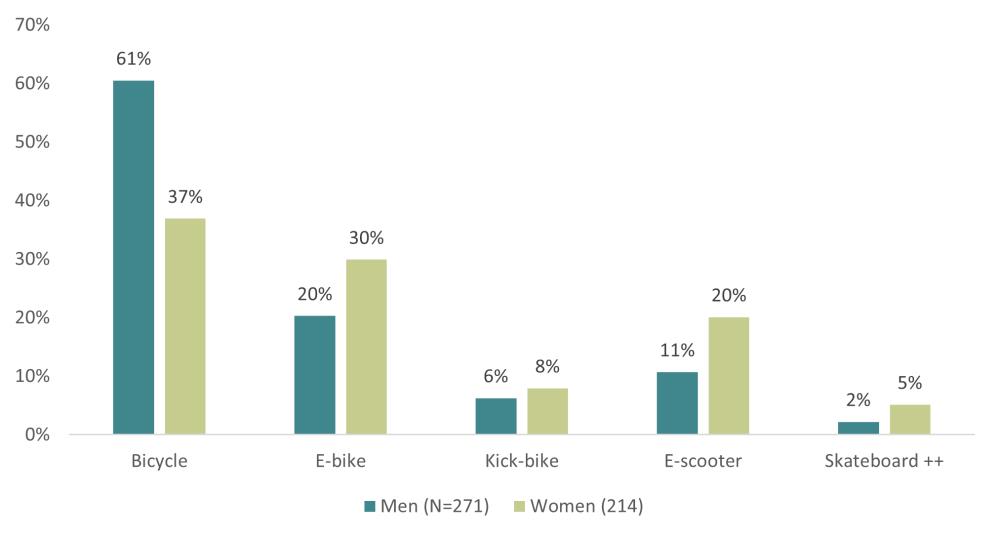
There is a statistically significant association between gender and vehicle type (χ²=28.3, p ≤ 0.001). Among men, bicycles are by far the most frequent vehicle in accidents, whereas for women the distribution is more even with e-bikes and e-scooters constituting a much larger proportion of accidents. In total there are slightly more e-bike and e-scooter accidents among women than among men, despite there being more men in the total sample.
In Figure 4 accidents are distributed both by age, gender, and vehicle type.
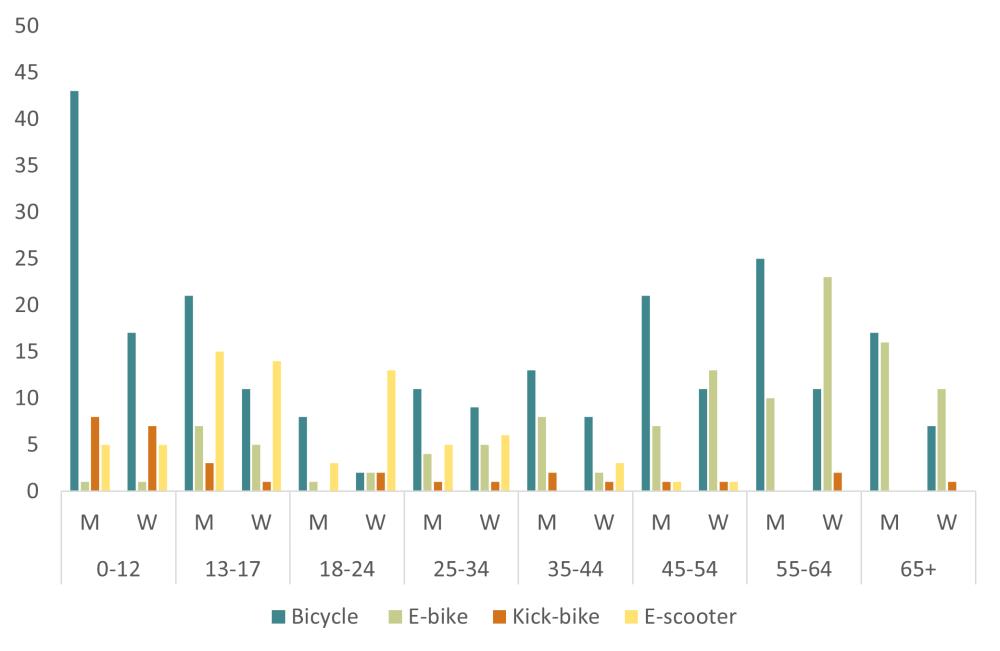
According to Figure 4 there is a clear pattern in the distribution of accidents by gender and age. Among children, boys have more bicycle accidents than girls, while there is no clear gender difference when it comes to other types of vehicles. The same trend is observed for teenagers (13–17 years). Among young adults (18–24 years), women have more accidents involving electric scooters than men, while men also have more bicycle accidents in this group. In the 25–34 and 35–44 age groups, the distribution of vehicle types is quite similar for men and women. Among those aged 45 to 64, men have more accidents with regular bicycles, while women have more accidents with e-bikes, especially in the age group 55–64. For those over 65, the distribution of bicycle and e-bike accidents is more similar between men and women, but also in this age group women have most accidents with e-bikes.
The differences between men and women are statistically significant in age groups 18–24 (χ²=11.2 ≤ 0.011), 35–44 (χ²=6.3 ≤ 0.011) and 55–64 (χ²=12.6 ≤ 0.002).
3.2. Comparison with official statistics
In Norway, as in most countries, official road accident statistics are based on police-reported accidents. Accidents involving a personal injury and a moving vehicle that happen on streets or roads open to general traffic, are included in the official road accident statistics. Thus, the accidents involving bicycles and micro mobility devices presented above should in principle also be registered by the police and found in the official road accident statistics for Agder County.
To compare the accidents registered in the ReCyCLIST project with the official accident data, we must ensure that similar vehicle types and periods are used. When e-scooters entered the transport system in Norway, in 2019, they were not defined as a separate vehicle type but registered together with cyclists in the official statistics. From June 15. 2022 e-scooters were registered as “small electric vehicle” together with segways, hoverboards, one-wheelers and e-skateboards in the official accident statistics. E-bikes are registered together with ordinary bicycles in the official accident statistics.
To compare ReCyCLIST accident data with the official statistics for Agder County we restrict the ReCyCLIST accident sample and the official road accident sample to the period July 1, 2022–December 31, 2023. Results are given in Table 1.
| Vehicle/acc. type | ReCyCLIST data | Official data | Ratio |
|---|---|---|---|
| Bicycle (incl. E-bike) collisions |
59 | 30 | 2.0 |
| Bicycle (incl. E-bike) single accidents | 235 | 0 | — |
| Total bicycle (incl. E-bike) | 294 | 30 | 9.8 |
| E-scooter collisions | 4 | 2 | 2.0 |
| E-scooter single accidents |
46 | 0 | — |
| Total E-scooter | 50 | 2 | 25 |
Table 1 clearly shows that the accident registrations conducted in the ReCyCLIST project capture significantly more accidents than those officially recorded. It is evident that single-vehicle accidents involving bicycles and e-scooters are the ones not being registered officially, and these primarily account for the large discrepancy. However, we also see that twice as many collisions are recorded in the ReCyCLIST project compared to official records. This applies to both bicycles and e-scooters.
In the official data, containing 30 collisions involving bicycles, the counterpart in the bicycle collisions was a passenger car in 26 cases, a van in two cases, a bus in one case and a tractor in one case. Thus, it is clearly passenger cars that constitute the typical counterpart in collisions involving bicycles in the official accident statistics.
In the ReCyCLIST data, containing 59 bicycle collisions, the pattern is different. In 26 cases the counterpart was a car; in one case it was a bus or HGV, in two cases an e-scooter, in two cases a pedestrian and in 16 cases the counterpart was another bicycle. It seems that all cases with crashes between cars and bicycles registered in ReCyCLIST are also found in the official statistics. Those typically missing are predominantly collisions between cyclists, but also between cyclists and pedestrians and e-scooters. The pattern is similar for ordinary bicycles and e-bikes.
4. Accident details and mechanisms
As shown in section 3.2 it is obvious that data on single vehicle accidents among bicyclists and e-scooter riders are severely lacking in the official accident statistics. Hence data from the ReCyCLIST project may provide important new insights about single vehicle accident patterns and mechanisms for these road user groups. Nevertheless, collisions also seem to be underreported, and it is of interest to investigate in more detail what type of collisions/counterparts that are not registered in the official statistics.
In the following analyses we use the full data set from ReCyCLIST from June 1, 2022 to April 30, 2024, but we restrict the analyses to accidents happening in a road traffic environment and omit sports/play accidents.
We start by showing the differences in the distribution of accidents between vehicle types and gender, restricted to bicycles, e-bikes and e-scooters. For the other vehicle types, the numbers are too small to warrant meaningful presentation in this context. Figure 5 shows the distribution of the three accident types, single accidents, avoidance and collisions on vehicle types and gender. Avoidance accidents are accidents that happen due to heavy braking or abrupt movements, to avoid collision with another road user, which resulted in an accident but no collision.
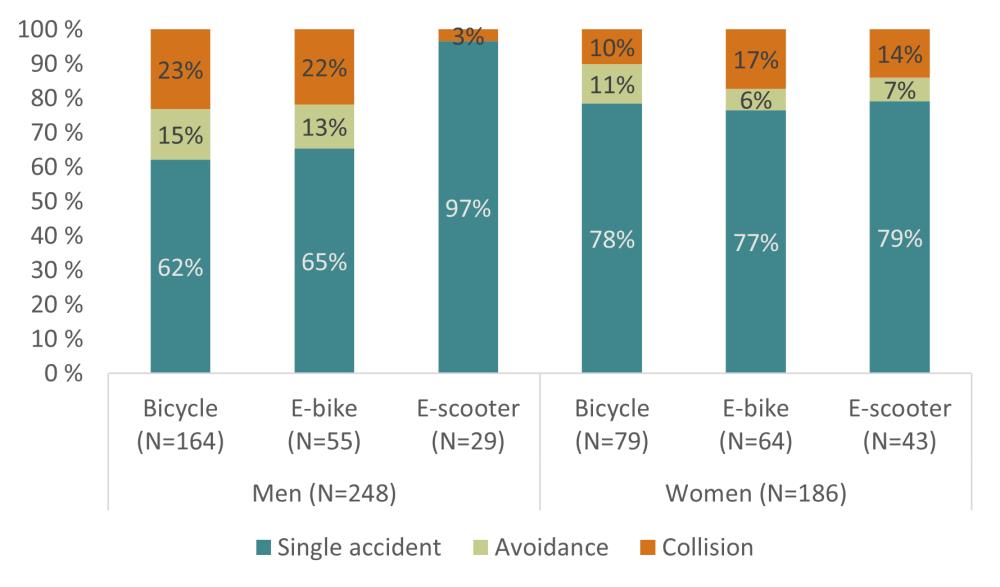
Figure 5 reveals that the difference in accident types between vehicle types is greater among men than women, and that especially e-scooter accidents differ. Among men, almost all e-scooter accidents are single accidents, whereas among women the share of single e-scooter accidents is like those of bicycles and e-bikes. Another difference revealed in Figure 5 is that the share of collisions on bicycles and e-bikes is larger among men then among women.
A chi-square test confirms a significant association between accident type and vehicle type among men (χ²=13.3, p < 0.010), but not among women (χ²=2.6, p ≤ 0.626).
4.1. Single accidents
Single-vehicle accidents constitute by far the largest share of the accidents in our data, and in the following we will investigate these in more detail. Table 2 shows how single accidents are distributed by general mechanisms/causes for the different vehicle types (see section 2 for description of the content of the mechanisms). The different accident mechanisms can contribute alone, i.e., the respondent only ticked for instance an infrastructure element as the main contributing factor, or they may contribute in combinations, for instance both an infrastructure element and some technical failure to the vehicle contributed.
| Accident mechanism | Bicycle | E-bike | Kick-bike | E-scooter | Skate-board++ | TOTAL |
|---|---|---|---|---|---|---|
| Infrastructure | 15.2 | 20.9 | 24.1 | 25.4 | 26.7 | 19.6 |
| Technical failure | 5.5 | 4.7 | 0.0 | 9.5 | 6.7 | 5.6 |
| Loss of balance | 28.7 | 34.9 | 31.0 | 17.5 | 13.3 | 27.7 |
| Infrastructure + Technical failure | 2.4 | 2.3 | 0.0 | 11.1 | 26.7 | 4.8 |
| Infrastructure + Loss of balance | 22.6 | 17.4 | 31.0 | 23.8 | 20.0 | 22.1 |
| Infrastructure + Technical failure + Loss of balance | 0.6 | 1.2 | 0.0 | 1.6 | 0.0 | 0.8 |
| Technical failure + Loss of balance | 0.6 | 1.2 | 0.0 | 0.0 | 0.0 | 0.6 |
| Other mechanism | 24.4 | 17.4 | 13.8 | 11.1 | 6.7 | 18.8 |
| TOTAL (N=100%) | 164 | 86 | 29 | 63 | 15 | 357 |
For bicycles loss of balance is the largest contributor with 28.7 % of the single accidents. In addition, 22.6 % of single accidents are due to a combination of loss of balance and some infrastructure element. For e-bikes loss of balance alone contributes to 34.9 % of single accidents.
For all vehicle types, infrastructure, loss of balance and the combination of infrastructure and loss of balance, contribute to most single accidents, ranging from 60 % for skateboards to 86 % for kick-bikes.
Table 2 shows that technical failure is an uncommon accident cause, both as a single cause and in combination with other factors. However, for e-scooters technical failures contributed in 23 % of single accidents, for skateboards ++ it contributed in 34 % of single accidents. Several e-scooter riders provided open-text responses about technical failures, with the most reported issue being that the scooter unexpectedly braked on its own.
The accidents where some infrastructure elements have contributed are of particular interest since the infrastructure is the responsibility of the road owner, typically the municipality, the county, or the national road administration. Table 2 reveals that some infrastructure element contributed in 47.3 % of the single accidents (19.6% + 4.8% + 22.1% + 0.8%).
A substantial proportion of the respondents (e.g., 24.4 % of bicyclists) indicated that the single accident did not occur due to infrastructure, technical failure, or loss of balance, but some other mechanism. In section 4.2 we provide some examples from their free-text responses describing the causes of these accidents.
In Table 3 the infrastructure accidents are distributed by more detailed characteristics of the infrastructure contributing to/causing the accident.
| Infrastructure element/mechanism | Bicycle | E-bike | Kick-bike | E-scooter | Skate-board++ | TOTAL |
|---|---|---|---|---|---|---|
| Kerb | 32.8 | 41.7 | 6.3 | 15.4 | 18.2 | 27.2 |
| Pothole | 7.5 | 11.1 | 18.8 | 17.9 | 9.1 | 11.8 |
| Stone | 10.4 | 11.1 | 25.0 | 25.6 | 27.3 | 16.6 |
| Pole | 6.0 | 2.8 | 0.0 | 5.1 | 0.0 | 4.1 |
| Cracks | 16.4 | 8.3 | 25.0 | 20.5 | 27.3 | 17.2 |
| Gravel | 20.9 | 16.7 | 43.8 | 33.3 | 27.3 | 25.4 |
| Brake for object | 19.4 | 41.7 | 31.3 | 30.8 | 54.5 | 30.2 |
| TOTAL accidents (N=100%) | 67 | 36 | 16 | 39 | 11 | 169 |
Table 3 shows that one third of the cyclists (32.8 %) say kerbs were involved, either alone or together with another element. For bicyclists and e-bike riders, kerbs are the most frequent infrastructure element contributing to single accidents. In total, brake for object was the most frequent infrastructure element contributing, followed by kerbs and gravel. Potholes, stones and gravel seem to be more typical for kick-bikes, e-scooters and skateboards ++, than for bicycles and e-bikes.
Respondents could indicate more than one contributing factor to the accident, and one-third did so. Among these, the most frequent combination—reported by two-thirds of those giving multiple answers—was “brake for object.” This combination, when paired with other infrastructure elements, can be interpreted in two ways. Some respondents who selected both “kerb” and “brake for object” may have meant that the object was a kerb, while others may have braked for an object and then collided with a kerb, stone, pothole, or similar hazard. Based on the free-text comments, the first interpretation appears most likely: respondents often described crashing into a pothole or similar obstacle and categorizing it as an object they braked for.
Table 2 revealed that loss of balance is a very important accident mechanism and that it might happen without any specific infrastructure element being involved. Thus, we have also distributed loss of balance accidents on the different mechanism producing loss of balance: “slipped and lost balance”, "lost balance (due to distraction from mobile etc.), “lost balance for other reasons”. The reasons for loss of balance are distributed by vehicle type in Table 4.
| Loss of balance mechanism | Bicycle | E-bike | Kick-bike | E-scooter | Skate-board++ | TOTAL |
|---|---|---|---|---|---|---|
| Slipped | 60.5 | 63.8 | 44.4 | 51.9 | 40.0 | 57.9 |
| Distracted | 2.3 | 2.1 | 0.0 | 7.4 | 0.0 | 2.7 |
| Other | 38.4 | 36.2 | 61.1 | 40.7 | 60.0 | 41.0 |
| TOTAL accidents (N=100%) | 86 | 47 | 18 | 27 | 5 | 183 |
For bicycles and e-bikes more than 60 % of loss of balance accidents happened because they slipped. For e-scooters, kick-bikes and skateboards the proportion is somewhat lower. In general, very few report that they lost balance because of distraction, but among e-scooter riders 7 % of loss of balance accidents happened for this reason.
Table 5 gives the distribution of loss of balance accidents by vehicle type and road surface.
| Loss of balance/surface | Bicycle | E-bike | Kick-bike | E-scooter | Skate-board++ | TOTAL |
|---|---|---|---|---|---|---|
| Snow/ice | 9.3 | 19.1 | 0.0 | 0.0 | 40.0 | 10.4 |
| Gravel | 24.4 | 10.6 | 5.6 | 14.8 | 0,0 | 16.9 |
| Asphalt | 75.6 | 70.2 | 94.4 | 77.8 | 80.0 | 76.5 |
| Leaves | 2.3 | 4.3 | 0.0 | 0.0 | 0.0 | 2.2 |
| Cobblestones | 3.5 | 0.0 | 0.0 | 3.,7 | 0.0 | 2.2 |
| TOTAL accidents (N=100%) | 86 | 47 | 18 | 27 | 5 | 183 |
Most of the loss of balance accidents happen on an asphalt surface, probably reflecting that such surfaces carry most of the bicycle and e-scooter traffic. Only 10 % take place on snow/ice; for e-bikes the proportion on snow/ice is nearly 20 % and substantially higher than for ordinary bicycles.
Table 4 revealed that a large part of loss of balance accidents is caused by other factors than slip and distraction, and some of these factors will be described in section 4.2
4.2. Description of single accidents
The data set contains several free text descriptions about the accidents. Such self-reports can shed important light on the mechanisms involved in the accidents. We have not conducted a systematic analysis of all free text answers given for the single accidents but provide examples of descriptions that are typical.
First, we provide a few examples of free text descriptions given by those who stated that the single accident occurred because of some other mechanism than infrastructure conditions, technical failures or loss of balance:
-
Was sitting on the back and got caught in the wheel.
-
Don’t know how the accident happened
-
Child who couldn’t brake going down a hill to an underpass
-
I had trash in my hand that I was going to throw in the first trash bin I saw, but it jumped out of my hand onto the cobblestones, and I lost focus, tried to stop, and hit the sidewalk.
-
I tipped over.
Secondly, we provide some free text descriptions of the accidents where the riders have stated that they lost balance, but did not slip or were distracted, cf. Table 4.
-
I think I braked too hard, too quickly
-
Stepped wrong on the pedal, fell to the side
-
The accident happened when my foot got caught in the front wheel, the bike stopped, and I flew over the handlebars and landed on my arm
-
A water hose was lying across the road and was covered with hard rubber for protection. It was shaded when the accident occurred
-
Let go of the handlebar with one hand
-
My foot slipped off the pedal
-
Probably a bit too high speed for the conditions. Some uneven asphalt and an e-scooter with small wheels
-
I was going slowly and was about to turn. Then the front wheel twisted
-
Unnecessary accident due to alcohol
-
Went out onto the edge of the asphalt and turned the handlebar, but slid out on the asphalt
Lastly, we provide some of the most typical descriptions of the single accidents that have been reported:
-
The front wheel hit the kerb.
-
The front wheel slipped on a manhole cover. The handlebars turned 90 degrees.
-
I was cycling with a dog on a leash and got pulled over.
-
I hit the kerb wrong.
-
There was gravel and sand on the road, which caused the bike to slip.
-
I slipped on the transition between the road and the sidewalk.
-
I rode down a hill and ended up in a hole in the road.
-
Slipped on slippery conditions
-
Didn’t see the low kerb under the snow and slipped on it
4.3. Collisions and conflicts
Figure 5 revealed that men have substantially more collisions and avoidance accidents with bicycles and e-bikes than women have, but the opposite was true for e-scooters. Detailed analyses of collisions and conflicts distributed by gender and counterparts are shown in the following. Figure 6 shows the distribution of counterparts in conflicts and collisions among men and women.
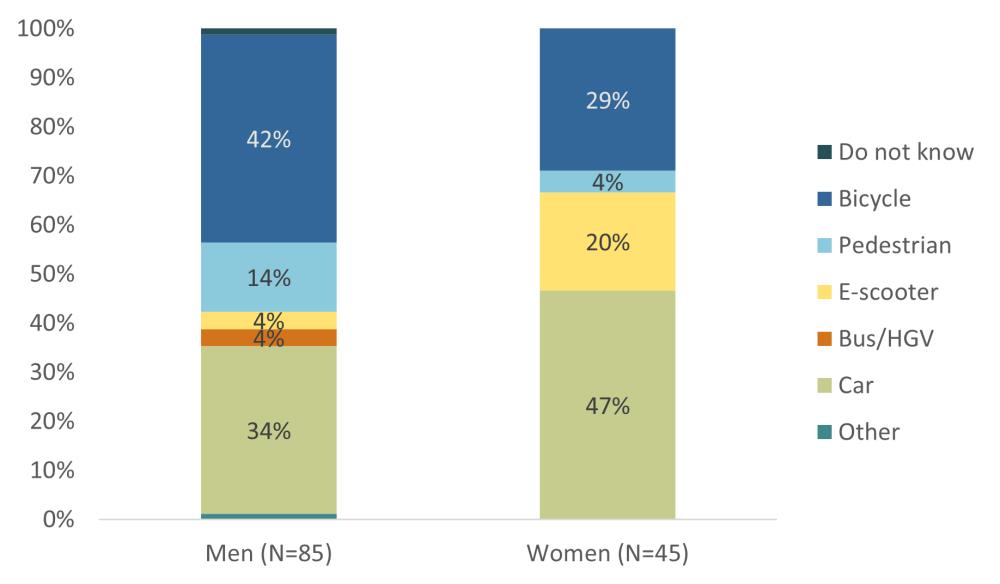
Figure 6 reveals that compared to women, men are more often in collisions or conflicts with other cyclists and pedestrians. Women seem to be more in collisions and conflicts with e-scooters and cars. A chi-square test reveals a significant difference (χ2=16.5, p < 0.011).
When looking into the data in more detail, there is a tendency that female e-scooter riders are more often involved in collisions/conflicts with other e-scooter riders than males are. The numbers are small, and such tendencies may be due to random variations, but perhaps female e-scooter riders choose to ride on sidewalks etc. where they might get in conflicts with other (female) e-scooter riders. However, if that was the case, one should perhaps expect them to be more involved in conflicts/collisions with pedestrians, and that seems not to be the case.
Among cyclists, men are more frequently involved in conflicts and collisions with other cyclists, largely due to their higher participation in training and racing. Nineteen male cyclists involved in such incidents were using racing bikes, compared to just two females. Of these, nine men and two women were injured during organized training or races. Although based on small numbers, the data suggest that men’s greater involvement in sport cycling contributes to their higher collision rates with other cyclists.
The descriptive statistics show that bicyclists, especially men, are more frequently involved in collisions and conflicts. However, it is unclear whether this overrepresentation is due to gender or the higher usage of bicycles and racing bikes among men. To distinguish the effects of gender and vehicle type, multivariate analyses are needed.
4.4. Multivariate analysis
To determine the effects of gender and vehicle type on the probability of being involved in collisions or conflicts we have computed a hierarchical logistic regression model with the following variables: Vehicle type (racing bicycle, other bicycle, e-bike, e-scooter), gender (men/women) age group (0–12/13–24/25–44/45 +), day of week (weekend/weekday).
The reason for including these variables is both that we have seen that they are associated with the accident types and that they can be expected to be linked both to other variables and to the dependent variable. For instance, we expect more racing bike accidents on weekends, but less collisions/conflicts involving other vehicle types. Table 6 gives the results.
| Predictor variables |
Step 1 | Step 2 | Step 3 | Step 4 | Step 5 | |
|---|---|---|---|---|---|---|
| Gender | M=1, W=0 | 1.715** | 1.784*** | 1.412 | 1.546* | 1.554* |
| Age group | 0–12 (ref.) | |||||
| 13–24 | 1.157 | 1.341 | 1.322 | 1.317 | ||
| 25–44 | 1.837* | 1.521 | 1.537 | 1.545 | ||
| 45 + | 1.873** | 1.222 | 1.214 | 1.215 | ||
| Vehicle type | Bicycle (ref.) | |||||
| E-bike | 0.980 | 0.987 | 1.004 | |||
| Racing bike | 2.753*** | 1.283 | 1.313 | |||
| E-scooter | 0.336** | 0.077** | 0.078** | |||
| Other | 0.421* | 0.427* | 0.436* | |||
| Interaction | M × Racing | 2.448 | 2.428 | |||
| (gender/vehicle) | W × E-scooter | 8.493* | 8.450* | |||
| Weekend | Yes=1 No=0 | 0.918 | ||||
| Constant | 0.244*** | 0.168*** | 0.247*** | 0.231*** | 0.234*** | |
| Nagelkerke R2 | 0.019 | 0.039 | 0.097 | 0.116 | 0.117 |
In the first step there is a statistically significant effect of gender revealing that compared to women men are almost twice as likely to having experienced a collision or conflict with another road user. When including age groups in step 2, the effect of gender is strengthened, and the coefficients reveal that adults (> 25 years) are more likely to have experienced a collision or conflict than children. However, when controlling for vehicle type in step 3, the effects of gender and age are no longer statistically significant.
The reduction in the effects of gender and age can be explained by the strong association between vehicle type – particularly racing bikes and e-scooters – and the likelihood of experiencing a collision or conflict. These associations are further moderated by gender and age. Children, for example, are less likely to be involved in collisions or conflicts, partly because they more frequently use “other” vehicle types such as kick-bikes and skateboards, which are typically associated with single-vehicle incidents and less with traffic conflicts. Another factor is that children are likely to use bicycles in low-traffic areas to a greater extent than adults.
Riding a racing bike significantly increases the odds of having experienced a collision or conflict – almost tripling the likelihood compared to using an ordinary bicycle. Similarly strong effects are found for e-scooters and “other” vehicles, which substantially reduce the odds of such incidents relative to ordinary bicycles.
As previously mentioned, the data indicate a tendency for men to dominate among those using racing bikes, while the analyses show that racing bikes are more frequently involved in collisions and conflicts. This effect may apply specifically to male racing bike riders, and we have therefore included an interaction term M × Racing. Similarly, we have observed a tendency for women to be more frequently involved in collisions and conflicts with e-scooters than men and have included an interaction term W × E-scooter.
M × Racing equals 1 if the injured respondent is a man riding a racing bike, and 0 otherwise. W × E-scooter equals 1 if the injured respondent is a woman riding an e-scooter, and 0 otherwise. In step 4, the two interaction terms are introduced:
Both interaction terms have large coefficients that go in the expected direction, but only W × E-scooter is close to reaching statistical significance (p < 0.059). Including these interactions alters the main effects of vehicle type: the negative effect of e-scooter use on collision/conflict probability becomes even stronger, while the effect of racing bike use is attenuated and no longer statistically significant.
In step 5, the variable Weekend is added, but it does not significantly affect the probability of collisions or conflicts. The coefficients for the remaining variables remain largely unchanged.
The analysis clearly shows that racing bikes are more often involved in collisions/conflicts than other bicycles and vehicle types, indicating that one important reason why men are generally more involved in collisions and conflicts is due to their more frequent use of bicycles and especially racing bikes. Similarly, the analysis reveals that women on e-scooters have more conflicts and collisions than their male counterparts, a finding also shown in Figure 5.
4.5. Descriptions of collisions and conflicts
The free text descriptions of collisions and conflicts confirm the results of the descriptive statistics and the regression analysis. Although there are more collisions and conflicts between VRUs in our data set, there are also classic bicycle-car accidents represented. Some typical free text answers are the following:
-
Was cycling alone along the old E39 towards Søgne, got side-swiped by a car. The mirror hit my handlebars; there was plenty of room to give space. No oncoming traffic and I was cycling outside the white line. Was using clip-in pedals—got thrown over the handlebars. The car drove off.
-
A car crossed the bike path. Did not yield.
-
My friend and I crashed on our bikes.
-
I was coming from county road FV176 and going to county road FV128 (pedestrian path). An oncoming cyclist was coming from county road FV128 to county road FV176—the cyclist was on the wrong side of the road.
-
Was a bit too close to another cyclist, lost balance and fell.
-
An oncoming cyclist moved into my lane right before the crash
The regression analysis revealed a strong tendency for racing bikes being more often involved in collisions and conflicts than other vehicle types. There are only a few free text comments about the collisions involving racing bikes. The comments are as follows:
-
Was a bit too close to another cyclist, lost balance and fell.
-
Motorist did not yield the right of way, drove in from the side, landed first on the hood, then on the asphalt.
-
Was hit by a car.
-
Overtaking a cyclist.
-
The accident happened because a cyclist was about to ride off the road due to a high asphalt edge. Cyclists made an evasive maneuver, causing an imbalance in the group, leading to the crash.
-
Car crossed the bike path. Did not yield the right of way.
The comments highlight the risks of group cycling, where close proximity makes it easy for cyclists to touch and cause accidents. Additionally, we observe more conventional accident mechanisms, such as collisions between cars and cyclists at intersections or when crossing bike paths. Racing bicycles are more frequently involved in collisions, both because they frequently ride in groups, but probably also because they are often ridden on the road rather than on separate bike paths. Their higher speeds may also increase the likelihood of accidents and conflicts.
Figure 5 revealed a higher number of collisions and conflicts with e-scooters among females than males. The numbers are small, and might be due to random variations, but it would nevertheless have been of interest to investigating what mechanisms that might account for such differences. However, there are too few free text reports on this and thus it is not possible to draw any conclusions about the mechanisms.
5. Discussion
The ReCyCLIST project has introduced an innovative and effective method for registering and pinpointing bicycle and e-scooter accidents that previously went unrecorded. Since most of these incidents involve single riders, they often go unreported and, as a result, are not addressed or mitigated by road authorities.
Our results indicate that the ReCyCLIST registration captures significantly more accidents than those officially recorded, approximately ten times more bicycle accidents (see Table 1). However, we are aware that far from all relevant bicycle accidents are recorded in the ReCyCLIST project, and it is difficult to estimate the coverage rate. Given the coverage rate in Oslo, where Oslo emergency clinic registered 20 times more bicycle injuries than officially recorded, our findings could indicate a coverage rate in Agder around 50 %, which looks quite good. However, we do not think that is the case. We believe that given the long distances and rural characteristics of Agder County, the police will be notified and react to a smaller proportion of bicycle accidents than in Oslo with smaller distances. Thus, we believe that underreporting is an even bigger problem in Agder. If that is the case, we catch less than 50 % of the true numbers in our data set.
In the accident data collected in the ReCyCLIST project three out of four accidents are single accidents, 11 % are due to avoidance maneuvers because of another road user, and only 16 % are collisions. Furthermore, data reveal that the counterparts in collisions and conflicts are often another bicyclist or other vulnerable road user, but cars are still the counterpart in four out of ten collisions.
The results from the ReCyCLIST project align with findings from other studies of bicycle accidents based on healthcare data, both in Norway and internationally. The accidents not reported to the police are typically single accidents occurring because of slippery surfaces, kerbs, holes etc. (Eriksson et al., 2022; Norwegian Public Roads Administration, 2021; Olesen et al., 2021; Schepers et al., 2015; Schepers & Klein Wolt, 2012).
Our results reveal that 73% of accidents involved single riders, typically due to infrastructure issues or loss of balance. This aligns with Olesen et al. (2021), who used self-reported data to estimate hospital costs of single bicycle crashes in Denmark and confirmed their dominance in total cyclist injuries. Eriksson et al. (2022) also highlighted the prominence of single accidents in Swedish hospital data, with older cyclists especially vulnerable to severe outcomes. Both Olesen et al. (2021), Eriksson et al. (2022) and Schepers & Klein Wolt (2012) have found infrastructure-related factors—slippery roads, kerbs, and obstacles—to be primary contributors to single accidents, closely mirroring ReCyCLIST findings.
For e-scooter accidents, there are less studies about such accident mechanisms; most studies based on healthcare data are on injury patterns. The studies about accident mechanisms often rely on police reported accidents (Li et al., 2025; Shah et al., 2021), and hence miss the single accidents that constitute an even higher proportion for e-scooter accidents than for bicycle accidents. Nevertheless, the results reported here align with other studies showing that e-scooter accidents typically occur among younger riders, but in contrast to other studies (Azimian & and Jiao, 2022; Li et al., 2025; Shah et al., 2021), our data shows females to be more frequently involved in e-scooter accidents than males.
The results reveal that collisions are rare, and only collisions where a motor vehicle is involved together with a bicycle or e-scooter are reported to the police and included in official statistics. The self-reported data from the health institutions reveal that collisions are equally frequent between cyclists as between cyclists and motor vehicles, and that racing bikes seem to be particularly at risk of experiencing collisions, both with other cyclists and with motor vehicles.
Even if our sample is far from complete, there are reasons to believe that the results give a representative picture of the accident patterns for bicyclists and e-scooter riders in Agder. The results reveal the well-documented dominance of single accidents, and their accident mechanisms align with other studies on bicycle accidents both from Norway and abroad (Eriksson et al., 2022; Norwegian Public Roads Administration, 2021; Olesen et al., 2021 and Schepers & Klein Wolt, 2012). Furthermore, the accident distribution on gender and vehicle type reflects well documented usage patterns in Norway. It is well documented in Norway that men cycle substantially more than women (Bjørnskau et al., 2024), that e-scooter usage is dominated by teen-agers and young adults (Fearnley et al., 2022), and that e-bikes are particularly popular among adults and elderly, especially elderly women (Dahl et al., 2023; Fyhri & Johansson, 2018). Compared to ordinary bicycles, e-bikes are used somewhat more frequently during winter (Dahl et al., 2023), which likely explains the higher proportion of e-bike accidents occurring under icy or snowy conditions.
The results from the ReCyCLIST project contribute significantly to a more detailed and better understanding of bicycle and e-scooter accidents and accident mechanisms, showing how infrastructure elements contribute significantly to both e-scooter and bicycle accidents, and how accident types and mechanisms vary between vehicle type, gender and age groups.
An important weakness of the presented study is however that the data collected only covers a sample of the accidents happening, and the representativeness of this sample is unknown. The data are based on self-selection and self-report so both the validity and the reliability of the recorded data can be questioned. However, since the results align well with other studies based on accident data from the healthcare system, there is reason to trust that the results provide a good picture of the accidents involving bicycles and e-scooters in Norway.
An important strength of this study is the information that the respondents themselves have provided about the accident mechanisms in free text. This information clearly shows how different mechanisms have contributed to accidents, and the free-text responses also provide new information that is not typically found in accident analyses, such as, for example, that the accident occurred due to a dog pulling on the leash, etc.
Previous studies have not been able to precisely identify the specific locations where kerbs or other infrastructure elements have contributed to accidents. This information has been requested by European Transport Safety Council (Carson et al., 2025) and is one of the key advantages of data registration in ReCyCLIST where most accidents have been geolocated, enabling the possibility to identify specific accident hotspots where targeted interventions could be effective. This is an important strength of the ReCyCLIST data, and the utilization of such information will be described in a separate article.
The ReCyCLIST project was conducted in Agder County. A follow-up project, CyWalk, starting from May 1, 2024, records accidents with the same tool, but includes pedestrians in addition to cyclists and e-scooter riders. The CyWalk project also expands geographically to include Oslo, Vestland, Buskerud, Østfold, Rogaland, Akershus and Trøndelag counties, in addition to Agder.
6. Conclusion
The findings from the ReCyCLIST project underscore the significant underreporting of bicycle and e-scooter accidents in official statistics, particularly for single-vehicle crashes. Our study highlights that most accidents involve infrastructure-related hazards and loss of balance rather than collisions with motor vehicles, which challenges the current focus of road safety measures. The disparity between official records and self-reported data emphasizes the need for improved accident registration systems to capture a more comprehensive picture of bicycle and micromobility risks.
While limitations exist in data representativeness, the study provides valuable insights that can guide policymakers in designing safer urban environments. Future research should build on these findings by expanding data collection efforts and investigating targeted interventions to reduce bicycle and micromobility accident risks.
CRediT contribution
Torkel Bjørnskau: Conceptualization, Funding acquisition, Investigation, Methodology, Project administration, Supervision, Writing—original draft, Writing—review & editing. Ingeborg Hesjevoll: Conceptualization, Data curation, Formal analysis, Funding acquisition, Methodology, Software, Writing—original draft, Writing—review & editing. Rikke Ingebrigtsen: Conceptualization, Data curation, Formal analysis, Methodology, Software, Writing—original draft, Writing—review & editing. Katrine Karlsen: Conceptualization, Funding acquisition, Methodology, Investigation, Writing—original draft, Writing—review & editing. Hanne Beate Sundfør: Conceptualization, Funding acquisition, Methodology, Writing—original draft, Writing—review & editing. Petr Pokorny: Methodology, Investigation, Resources. Kjell Vegard Weyde: Writing—original draft, Writing—review & editing. Odd Mjåland: Conceptualization, Funding acquisition, Investigation.
Acknowledgement
Preliminary results of this work were presented at the FERSI Conference in The Hague 6–7 October 2022 and at the International Cycling Safety Conference in the Hague 17 November 2023.
Declaration of competing interests
The authors report no competing interests.
Declaration of generative AI use in writing
During the preparation of this work the authors used ChatGPT 40 to improve English language in some sections of the article. The output was reviewed and revised by the authors who take full responsibility for the content of the publication.
Ethics statement
The methods for data collection in the present study have been approved by The Norwegian Agency for Shared Services in Education and Research (Sikt).
Funding
The study was mainly financed by the Research Council of Norway and with co-funding from Agder County, Norway.
Editorial information
Handling editor: Stijn Daniels, Transport & Mobility Leuven | KU Leuven, Belgium
Reviewers: Anne Vingaard Olesen, Region Nordjylland, Denmark; Tanja Madsen, Aalborg Universty, Denmark.
Originally, the registrations were scheduled to end on September 30, 2023, but since Agder joined the follow-up project CyWalk, starting on May 1, 2024, accident registrations continued. Thus, accidents from the period October 1, 2023, to April 30, 2024, are also included in the dataset analyzed here. ↩︎