How Can We Integrate Road Safety Into Occupational Health and Safety Management ‘to Save Lives Beyond 2025’? A Study of Safety Management Among Drivers at Work
Abstract
The Academic Expert Group (AEG) recommendations related to the 4th Global Ministerial Conference on Road Safety in 2025, suggests a strategy of ‘Saving Lives Beyond 2025’, through integrating road safety into occupational health and safety management; implementing safety management systems like ISO:39001, or ISO:45001, and through working with safety culture. In this study, we study commitment to road safety and the prevalence of road safety management measures, according to the Safety Ladder approach (Nævestad et al 2018). Based on survey data, we compare professional drivers at work; bus drivers (n = 305) and truck drivers (n = 298) and employees who drive at work who are not professional drivers (‘work drivers’) (n = 355). We also draw on data from qualitative interviews. We find that organizations with work drivers have a lower focus on road safety, and that they have introduced fewer safety management measures, compared to organizations with professional drivers. However, the study also shows that there is still potential for improvement in organizations with truck drivers and bus drivers. These also have an unexploited potential when it comes to implementing effective measures. Multivariate analyses indicate the importance of the Safety Ladder practices, as they influence safety culture, which in turn is related to driving style and accident involvement. Specifying the AEG recommendations into more concrete actionable steps, we suggest specific management practices that organisations can employ, based on the Safey Ladder approach, and specific third-party actions to motivate organisations to implement the management practices.
1. Introduction
1.1. Background
Occupational driving is a crucial focus area in the global strategy to achieve the United Nations’ goal of halving road traffic deaths and injuries by 2030. This was underlined in the 4th Global Ministerial Conference on Road Safety in Marrakech, 2025. In the report of the conferences’ Academic Expert Group (AEG), titled “Saving Lives Beyond 2025: Taking Further Steps,” it is underlined that work-related crashes comprise about one-third of total global road deaths, or about 400,000 fatalities per year (STA 2025). The AEG report includes six recommendations as to how we can contribute to halving the world’s road deaths, by targeting occupational road fatalities (cf. Appendix 1). The key focus is on organisations, both public and private, including those outside of government, emphasizing that these must internalize responsibility for road safety as part of occupational and public health obligations. Private and public organizations should include specific attention to road safety in the systematic management of their work environment, as required by occupational health and safety (OHS) law. Moreover, organisations should also track their road safety footprints throughout the value chains that they are involved in. This also means ensuring that their road safety policies and practices are upheld not only internally, but also by contractors and suppliers (cf. Wennberg & Hyllenius Mattisson, 2024). The concrete AEG recommendations also suggest systematic management of occupational road risk, e.g. trough ISO standards 39001, or 45001[1], and through fostering an organisational safety culture, that goes beyond compliance with rules, and which is reporting and just.
The acknowledgment that a large proportion of fatal road accidents involve drivers at work is not new. Nævestad et al (2015) reported that nearly 40% of the fatal road accidents in Norway involved drivers at work, while 10% involved commuters. A recent Swedish study has found the same (Kullgren et al., 2023). Thus, about half of the fatal road accidents in these countries are work related. This indicates the large potential in focusing on the road safety of drivers at work.
In spite of this, research has shown that organizations that have employees who drive in their work often have little focus on organizational safety management, and work-related risk factors for transport (e.g. Mooren et al., 2014; Nævestad, Phillips, & Elvebakk, 2015; Wills et al., 2006). Work-related road safety has traditionally been handled by emphasizing the drivers’ individual responsibility for road safety and not through the employers’ organizational safety management (Nævestad & Phillips, 2023).
The lack of focus on organizational safety management in the road sector is particularly evident when compared to other transport sectors. There are legal requirements for safety management systems to contribute to a positive safety culture in aviation, maritime and rail (Amtrak, 2015; Hudson, 2003; Lappalainen et al., 2012). In contrast, companies that have employees who drive for work can choose whether to implement safety management systems, e.g. ISO:39001, ISO:45001.
On the other hand, as noted by the AEG recommendations, the legal obligation for organizations to work systematically with OHS (i.e. a safety management system) exist in many countries, and organisations with drivers at work may include road safety in this work. A main challenge is, however, related to national authorities’ enforcement of OHS regulations in road transport.
We define organizational safety management as measures that focus on safety management systems and safety culture. Safety management systems refer to the formal aspects of safety management (“how things should be done”), which are described in procedures, routines and organizational charts, etc. Safety culture refers to the informal aspects of safety management (“how things are actually done”) (Antonsen, 2009). Safety culture can be defined as shared ways of thinking and acting that are relevant to safety (Nævestad et al., 2020). In addition, organizational safety management also deals with other safety measures that cannot necessarily be categorized as culture or system, e.g. systematic use of technology that records drivers’ driving style, adaptation of salary systems in a way that does not compromise safety, measures to avoid stress and fatigue, etc. (Nævestad, Phillips, & Elvebakk, 2015).
Increased focus on organizational safety management in organizations that have drivers at work can significantly increase road safety (Banks, 2008; Gregersen et al., 1996; Mooren et al., 2014; Murray et al., 2009; Naveh & Marcus, 2007; Thomas, 2012). Previous studies show that up to 60% lower risk of accidents can be achieved in organizations with drivers at work (Gregersen et al., 1996). Managers in organizations with employees who drive at work also have management rights and duties; the employment relationship legitimizes restrictive intervention measures to increase road safety (e.g. fleet management systems that record driving style, alcohol interlocks, etc.). Thus, the potential of effective measures is even greater among occupational drivers than other drivers.
The fact that OSM measures are not sufficiently implemented despite promising results, indicates that there might be important implementation barriers for integrating road safety into occupational health and safety management. These barriers might hamper the ambition of the 4th Global Ministerial Conference on Road Safety, of Saving Lives Beyond 2025, through focusing on occupational road safety. Many national OHS regulations require systematic safety management in work organisations, including those with people driving in their work. In spite of this, such OHS policies are not implemented, or sufficiently enforced by authorities (Nævestad, Phillips, & Elvebakk, 2015). Moreover, it might be argued that the AEG recommendations are relatively abstract for organisations with people who drive in their work, and that concrete operationalisations are required to unleash the potential of targeting the safety of occupational drivers. One of the AEG recommendations is e.g. to implement ISO:39001, or ISO:45001. In Norway in 2018, six years after ISO:39001 was introduced, there were only seven certified companies. In comparison, there are about 8000 trucking companies in Norway. This indicates that it is not sufficient to recommend implementation of ISO:39001; more specific recommendations are required. We will explain why, and provide specific recommendations in this paper, based on the Safety Ladder approach (Nævestad et al., 2018).
Previous research suggests that most measures aimed at organizational safety management are comprehensive, and that they require a lot of time, resources and expertise (Nævestad et al., 2018). This applies e.g. to the safety management system standards ISO: 39001. Thus, implementing such measures may be challenging, particularly for small companies. Additionally, the results of the measures, for example for safety and finances, are not well enough known (Nævestad et al., 2018). There are few robust studies that examine the effects of such measures on safety, and as far as we know, very few that show economic consequences (i.e. what you get in return for the resources you spend on implementation). Thus, there seems to be a great need for scientifically based road safety measures that require few resources, are easy to implement and have clearly quantifiable results in the form of reduced accidents and saved costs.
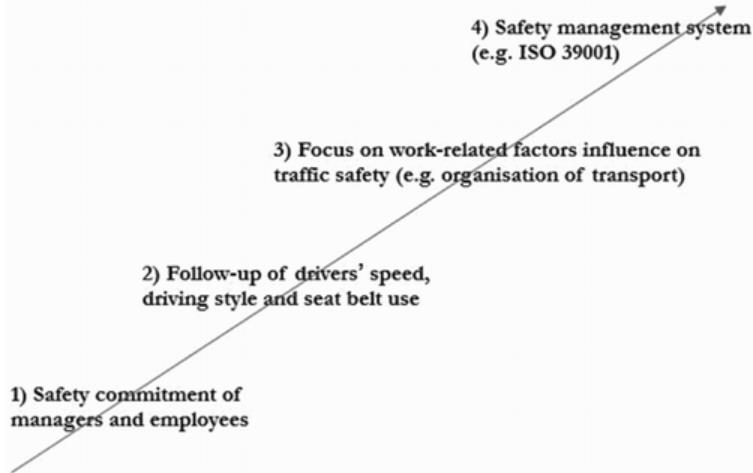
This was the background for Nævestad et al. (2018) to develop the Safety Ladder for safety management in transport companies. The Safety Ladder consists of four main categories of measures, which can be arranged on a ladder, starting at the lowest level before moving on to the next step. The idea behind the Safety Ladder is that companies start at the bottom of the ladder if they do not have any measures aimed at work-related risk factors in the company. Based on previous research, it is assumed that the lowest steps are the easiest to do something about and that they have the greatest effect. The Safety ladder is based on a systematic review of previous research and of accidents involving drivers at work (Nævestad et al., 2018).
The first step in the Safety Ladder is the commitment of managers and employees to road safety, because this is a prerequisite for all safety measures in companies to be successful. The second step is systematic monitoring of drivers’ speed, driving style, seat belt use, phone use e.g. through policies or technologies recording and giving feedback on driving style (In-vehicle-driving-recorder, “fleet management system”). The third step is "Focus on the importance of work-related factors for road safety. Given the low focus on organizational safety management in companies that have employees who drive for work (Nævestad, Phillips, & Elvebakk, 2015), it is important that managers and employees in these companies develop an awareness of the importance of work-related factors for transport safety. This applies, for example, to the organization of transport, with the consequences it has for drivers’ perceived stress, time pressure, fatigue, etc. The fourth step is to implement a “Safety Management System”, e.g. ISO:39001, ISO:45001 or other similar options. This involves systematic risk analyses, reporting of safety incidents, learning systems, etc.
Previous studies have examined the prevalence of the measures at the different levels in the Safety ladder in transport companies. Focusing on trucking companies, Nævestad et al. (2020) find that the level of safety culture increases for trucking companies for each increasing level in the Safety Ladder, while the accident risk decreases. This supports the approach of the Safety Ladder. The different levels in the Safety Ladder concern both (different degrees of) safety management system and safety culture, i.e. both formal and informal aspects of safety management.
1.2. Aims
No previous studies have, however, compared the prevalence of the Safety ladder management practices for different sectors of drivers at work. In this study, we therefore compare the situation for professional drivers at work; bus drivers and truck drivers with the situation for employees who drive at work who are not professional drivers ("work drivers). The background for the comparison is that non-professional drivers account for a significant proportion of road accidents involving drivers at work (Nævestad, Phillips, Elvebakk, et al., 2015), and very little research has been done on them. Furthermore, non-professional drivers are more often defined as triggering fatal accidents than professional drivers (Nævestad, Phillips, Elvebakk, et al., 2015). We assume lower road safety commitment and fewer measures in the organisations of work drivers, as driving is a secondary activity in these organisations. There is also a need to map factors that impede, or facilitate the implementation of organisational safety measures, as we know that several companies experience barriers for implementation.
This study has three aims:
-
Map the extent to which organizations that have employees who drive in their work have measures for organizational safety management in line with the different levels of the Safety Ladder.
-
Examine the relationships between safety culture, safety management measures, driving style and accident involvement.
-
Discuss what organisations with drivers at work and third-parties (transport buyers, insurers, industry organisations) can do to increase the implementation of organisational safety management in organizations with drivers at work.
1.3. Previous research
In the following, we review previous research on accident involvement, behavior, culture, and safety management systems. We also refer here to the other transport sectors (air, sea, and rail), since they have formal requirements for safety management systems. Several intervention studies from different transport sectors find relationships between the implementation of safety management systems, or elements of safety management systems, and positive safety culture and other measures of safety (accidents, behavior, incidents, violations) in aviation (Hudson, 2003; Patankar, 2019), in rail (Zuschlag et al., 2016), in the maritime sector (Lappalainen et al., 2012), and in the road sector (Naveh & Katz-Navon, 2015). Naveh and Katz-Navon (2015) find, in an Israeli study of the implementation of a safety management system in the road sector (ISO:39001), an improved road safety climate in the intervention units, compared with somewhat lower scores in the control units. They also find an average reduction of 75% in road safety violations in the intervention units, while the control units had an increase in violations. In multivariate statistical analyses, they find that the reduction in drivers’ road safety violations is related to improvements in safety climate (Naveh & Katz-Navon, 2015). The study by Zuschlag et al. (2016) from rail finds similar relationships: improved safety culture, 80 % reduction in risk behavior and 81% reduction in accidents. The study has both before and after measurements and test and control groups. In their study of the introduction of the ISM code (International Safety Management) in international shipping, Lappalainen et al. (2012) find that this has led to improved safety culture and an increased safety level in the maritime sector in Finland. Patankar (2019) emphasizes that there is a close relationship between systems for “maintenance resource management” and the development of a good safety culture within aviation (with a focus on the maintenance of technology and equipment). He describes similar relationships within “crew resource management” in aviation.
To sum up, intervention studies indicate that implementation of Safety management systems leads to improvements in safety culture, which leads to safer behaviour, which leads to fewer accidents. These the relationships are also found in various cross-sectional studies (which only examine relationships at one point in time). These do not measure interventions (implementations of safety management systems), safety culture, behavior and accidents sequentially, but they do often examine safety culture (measured as perceptions of safety management systems and managers’ commitment to safety), road safety behavior and accidents simultaneously. There are few studies that explicitly focus on organizational safety climate among professional drivers, or drivers working in road transport. The existing studies often combine questionnaires on organizational safety climate with questionnaires that measure safety outcomes, such as self-reported driving behaviors (e.g., Driving Behavior Questionnaire [DBQ]) (Reason et al., 1990) and self-reported accidents (Davey et al., 2006; Huang et al., 2013; Öz et al., 2014). In addition to focusing on management commitment to safety, as most studies of safety culture regardless of sector do, studies of safety culture in organizations in the road sector also measure other aspects of safety culture, such as the role of the manager, vehicle safety rules, support from managers and superiors during drivers’ trips, communication and support, work pressure, driver training, peer influence, competence, etc. (Davey et al., 2006; Huang et al., 2013; Wills et al., 2005). These studies generally find that positive scores for organizational safety culture are associated with lower incidence of negative driving behavior, as measured by the DBQ.
It should also be mentioned that previous cross-sectional studies of drivers at work find relationships between drivers’ experiences of stress and time pressure and the occurrence of unsafe behavior in traffic. In analyses of data from a survey of over 1,100 Norwegian drivers, Phillips and Bjørnskau (2013) find a relationship between perceived time pressure and risky behavior in traffic, such as driving over the speed limit and violating rest time regulations. Other studies of drivers at work also find relationships between stress and time pressure and accident involvement (Davey et al., 2006), which is probably due to the fact that stress and time pressure influence driving style. Similarly, Nævestad et al. (2019) find a relationship between time pressure and aggressive driving style in a study comparing Norwegian and Greek bus and truck (and non-professional) drivers.
1.4. Hypotheses
We have five hypotheses, which are based on previous research:
-
The organizations of work drivers have fewer measures aimed at organizational safety management, and lower commitment to road safety among managers and employees than in bus and truck, because transport is a secondary activity in these organizations.
-
The driving style of occupational drivers influences their accident involvement.
-
Driving style is influenced by organizational safety culture.
-
There is a relationship between safety management system and organisational safety culture. The first deals with the formal aspects of safety in organisations, the latter with the informal aspects. (The first concerns Level 2-4 in the Safety Ladder, while the latter concerns level 1 in the Safety Ladder).
-
Drivers’ perceived stress and time pressure have a negative impact on their driving style.
2. Method
2.1. Interviews
2.1.1. Recruitment
We have conducted qualitative in-depth interviews with 10 people in organizations with work drivers. We have only conducted interviews in organizations with work drivers, because we have relatively little knowledge about this segment of drivers. The informants have management positions in various organizations that have employees who drive for work. In the recruitment, we emphasized recruiting from a broad spectrum of sectors and organizations . We interviewed many different sectors, such as health and care, cleaning, parks, safety guards, media, etc. The qualitative interviews were conducted in the fall of 2023. The majority of the interviews were conducted by telephone or digitally via the Microsoft Teams platform.
The main purposes of the interviews were: 1) To map road safety measures in general in organisations with people who drive in their work, and to examine the occurrence of measures in these companies at the different levels of the Safety Ladder, and 2) If the companies do not have measures, to examine what the reasons are, and what factors may motivate them to do so. Qualitative in-depth interviews are particularly suitable when there is a need for in-depth knowledge about a topic (Brinkmann & Kvale, 2015). We compare the results from this interview study with the results from the previous interviews with bus drivers (Nævestad et al., 2022) and truck drivers (Nævestad et al., 2023) from several different companies.
2.1.2. Topics in the interview guide
We used a semi-structured interview guide, which means that the interview is structured around some predefined themes. The guide is indicative, in the sense that both the questions and the order of the questions are adapted to the interview situation, so that it is possible to follow up on new information or themes that emerge along the way. The interview guide contains questions about the organizations in general; size, main work activities, etc., in what contexts the employees drive in their work, what vehicles they use, etc. In addition, the interview guide contains questions about road safety measures. These questions are structured according to the Safety Ladder for Safety Management (Nævestad et al., 2018), with questions about safety commitment (Level 1), systematic use of a fleet management system and focus on driving style, seat belt use etc. and travel policy for employees (Level 2), focus on work-related risk factors, such as stress, time pressure when driving at work (Level 3), and safety management systems, such as reporting systems, risk analyses (Level 4).
2.1.3. Thematic analysis
To identify the extent to which the informants focus on work-related road safety in general, fleet management systems in particular and factors that promote and inhibit it, we conducted a thematic analysis of the interviews. A thematic analysis is a systematic method for identifying main themes in text material (Braun & Clarke, 2006). In the first step of the process, the interviews were read carefully several times and then coded. The codes were then systematized and arranged into rough categories. In the next step, the resulting categories were reviewed. In this part of the process, we assessed the categories against each other and against the material, and necessary adjustments were made. Some categories described the same overarching concept and were merged, and others stood out as subcategories under a larger overarching factor.
2.2. Survey
We have conducted three surveys: one for truck drivers (n=298), one for bus drivers (n=305) and one for work drivers (n=355). See Appendix 2 for a detailed description of the recruitment of the respondents. Table 2.1 provides gender distribution of respondents, while Table 2.2 compares the age distribution. More details about the characteristics of the respondents in the three groups is provided in Appendix 3.
| Man | Woman | Total number | |
|---|---|---|---|
| Truck drivers | 93% | 7% | 298 |
| Bus drivers | 93% | 7% | 305 |
| Work drivers | 66% | 34% | 355 |
| Total | 794 | 164 | 958 |
| Total | 83% | 17% | 100% |
There is a higher proportion of women among the work drivers. A chi-square test shows that the difference is statistically significant at the 1% level. the age distribution.
| < 26 | 26-35 | 36-45 | 46-55 | 56+ | Total number | |
|---|---|---|---|---|---|---|
| Truck drivers | 9% | 18% | 17% | 24% | 32% | 298 |
| Bus drivers | 0% | 3% | 5% | 24% | 68% | 305 |
| Work drivers | 1% | 12% | 28% | 23% | 36% | 355 |
| Total | 3% | 11% | 17% | 24% | 45% | 100% |
| Total | 33 | 104 | 166 | 226 | 429 | 958 |
When it comes to the age distribution, it is particularly striking that almost 70% of bus drivers are over 56 years old. A chi-square test shows that the difference is statistically significant at the 1% level.
The survey contains various themes: Background variables, questions on Work-related driving for work drivers, Commitment to road safety (“road safety culture”) (Safety ladder level 1), Policies for speed, driving style, seatbelts and mobile phone use (Safety Ladder Level 2), Focus on work-related factors (Safety Ladder Level 3), Safety Management System (Safety Ladder Level 4), Questions about stress and time pressure, Questions about negative driving style, Questions about accidents, injuries and incidents. The full list and wording of the questions are provided in Appendix 4.
2.2.1. Quantitative data analyses
We have conducted three multivariate regression analyses. In the first, we examine factors explaining the respondents’ accident involvement. In the second, we examine what predicts the respondents’ negative driving style and in the third, what predicts organisational safety culture. We use logistic regression analysis in the first analysis since the dependent variable is dichotomous, meaning that it has two values (for example: Accident: no, yes). In the others, we have used linear regression, since the dependent variables are continuous. The regression analyses show effects of the independent variables that we include, controlled for the other variables in the analysis. It must be pointed out that we cannot say anything about causality in these analyses, and that some of the relationships we see may be due to “unmeasured” third variables.
3. Results
3.1. Focus on road safety
The first aim of the study is to map the extent to which organizations that have employees who drive in their work have measures for organizational safety management, in line with the different levels of the Safety Ladder.
3.1.1. Commitment to road safety
The first step in the Safety Ladder is Commitment to road safety among managers and employees.
3.1.1.1. Survey results
We measure commitment to road safety (“safety culture”) using three statements:
-
Road safety is very important to the top management of the organization where I work.
-
Road safety is very important to my immediate manager.
-
Road safety is very important to my colleagues
Table 3.1 shows the proportions who agree with the statements in the three groups.
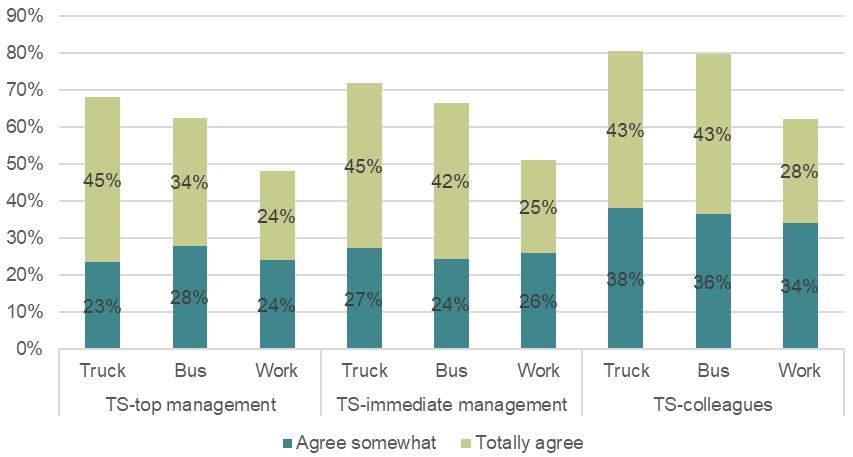
We consistently see higher proportions of truck drivers and bus drivers who agree with the statements, indicating a higher commitment to road safety in organizations with professional drivers, compared to organizations with work drivers. We created a sum score index of the questions (min: 3, max: 15), and Anova tests show significant differences between the groups (p=<0.01). The mean score on the index for truck drivers is 12.2 points, while it is 11.8 for bus drivers and 10.4 for work drivers.
When we compare commitment to road safety in the different subgroups of work drivers, we see that public administration, research, development (11.4) has the highest score, while retail, communication, etc. has the lowest score (9.4). The differences are significant at the 5% level (p=0.015). If we only look at the shares that agree with the statement “Road safety is very important to the top management in the organization where I work” distributed across subgroups of work drivers, we see that approximately 60% agree among those who work in the public administration, research, research sector, while 36% agree among those who work in the retail, communication, etc. sector. In other words, there is a large variation in the different subgroups when it comes to top management’s commitment to road safety. Chi-square tests show that the differences are statistically significant at the 5% level (p=0.016).
3.1.1.2. Interview results
All the work driver informants we interviewed, who have managerial responsibilities, were concerned about road safety for employees who drive at work. However, most of the informants explained that they believe they can do even more for road safety among employees than is done today. There are three areas in particular where the vast majority of informants described that road safety is raised as a topic. First, in meetings, good practice may be discussed (e.g. about securing cargo). Second, through internal communication platforms, for example about: securing cargo, using seat belts, storing loose objects or using quick-release snow chains. Third, in training of new employees, although few have specific safe driving training. Most had guidelines for car use that new employees must read and sign before they can use cars from the fleet.
Previous interviews we have conducted with managers and representatives of employees in bus and truck show a strong commitment to road safety among managers and employees, in line with the results in Figure 3.1. However, the number of measures that different transport companies have varies. This is particularly true in trucking, where clients do not require this, in the same way as in bus transport, where, for example, the road safety standard ISO:39001 may be required by transport buyers.
3.1.2. Guidelines for speed, driving style, seatbelts and mobile phones
The second step in the Safety Ladder is Follow-up of driver speed, driving style, seat belt use and mobile phone use.
3.1.2.1. Survey results
The survey contains two questions about guidelines for, and monitoring of drivers’ speed and driving style:
-
My workplace has clear and well-known guidelines for speed and driving style that employees who drive for work must follow.
-
Management emphasizes that employees who drive for work should not drive faster than the speed limit and conditions allow.
Figure 3.2 shows the proportions who agree with the statements in the three groups.
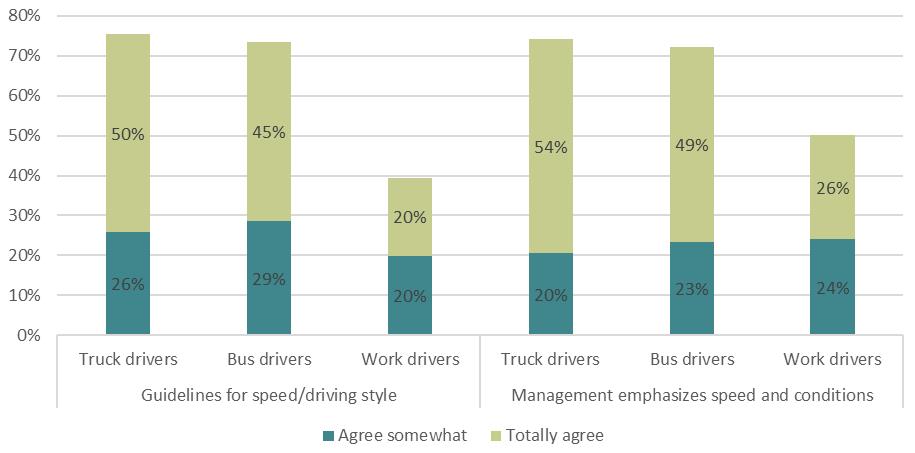
We see higher proportions of respondents agreeing with the statements among truck drivers and bus drivers: The proportions who agree with the first statement are about twice as high for truck drivers and bus drivers as for work drivers. We created sum score indexes of the questions (min: 2, max: 10), and Anova tests show significant differences between the groups (p=<0.01). The average for truck drivers is 8.2 points, while it is 8.1 for bus drivers and 6.2 for work drivers.
When we compare the answers to the statements that measure the Safety Ladder level 2 in the different subgroups of work drivers, we see that public administration, research, development (6.6) has the highest score, while retail, communication, etc. has the lowest score (5.3). Chi-square analyses show that the differences are significant at the 5% level (p=0.27). If we only look at the proportions who agree with the statement about guidelines for monitoring speed and driving style in their own organization, divided into subgroups of work drivers, we see that approximately 42% agree among those working in the public administration, research, development sector, while 24% agree among those working in the retail, communication, etc. sector.
The survey also contains the following question: “The car(s) I usually drive for work… …has a fleet management system that measures my driving style (fuel consumption, acceleration, braking).” The response options were “yes”, “no” and “don’t know”. A total of 84% answered yes among truck drivers, 78% answered yes among bus drivers, and 9% answered yes among work drivers. This means that there are almost nine times more people who have this measure (i.e. fleet management system) among professional drivers compared to work drivers. However, we must take into account that we are comparing with small numbers when we look at work drivers. A share of nine percent in that group corresponds to 33 respondents. Sample representativeness will probably have a lot to say here, and the share is associated with uncertainty. When we look more closely at the work drivers, we see that the sectors with the highest proportion of yes were public administration, research, develpment and Health, social, education. These are sectors that mainly have public employers.
3.1.2.2. Interview results
Four of the organizations said they had seatbelt and mobile phone policies for employees who drive at work. It varied whether they also had speed and driving style policies. Some of the informants were unsure whether the policies influenced the behavior of employees in traffic, and pointed out that the policies should be combined with other road safety measures. The policies are read and signed upon employment. One of the organizations with policies for speed, driving style, seatbelt and mobile phone policies had rules that the policies must be read and signed by employees every two years. If revisions are made, the policies are reissued, and employees must provide feedback that they have read the revised policies. All the organizations have systems to track the number of kilometers driven per car in the fleet. This is important for insurance purposes. Five of the organizations had fleet management systems to track the fleet. None used this system to follow up on the drivers’ speed and driving style. The fleet management systems were primarily used as an electronic logbook. The system documents that the cars are not used for private purposes. This is important for taxation and insurance.
Previous interviews we have conducted with managers and representatives of employees in bus and truck show that companies have a strong focus on employees’ speed and driving style, in line with the results in Figure 3.2. Not all companies in truck have formalized procedures for speed, driving style, seat belt use, and mobile phone use. This is largely formalized in bus transport. Bus and truck largely have fleet management systems that record a number of aspects of the drivers’ driving style (hard braking, sudden acceleration, etc.). These systems are important for companies’ efforts to reduce traffic accidents, equipment and fuel costs, and that drivers significantly linked their identity to good scores in the fleet management system.
3.1.3. Focus on work-related factors
The third step in the Safety Ladder is Focus on the importance of work-related factors for transport safety.
3.1.3.1. Survey results
We measure focus on the importance of work-related factors for road safety in the organizations in which the respondents are employed using two statements:
-
At my workplace, we have a strong focus on how employees’ private lives (e.g., lack of sleep, stressful life situations) can influence road safety.
-
In my company, it is common for employees who drive in their work to interrupt/delay assignments if they feel tired or unfit.
Figure 3.3 shows the proportions who agree with the statements in the three groups.
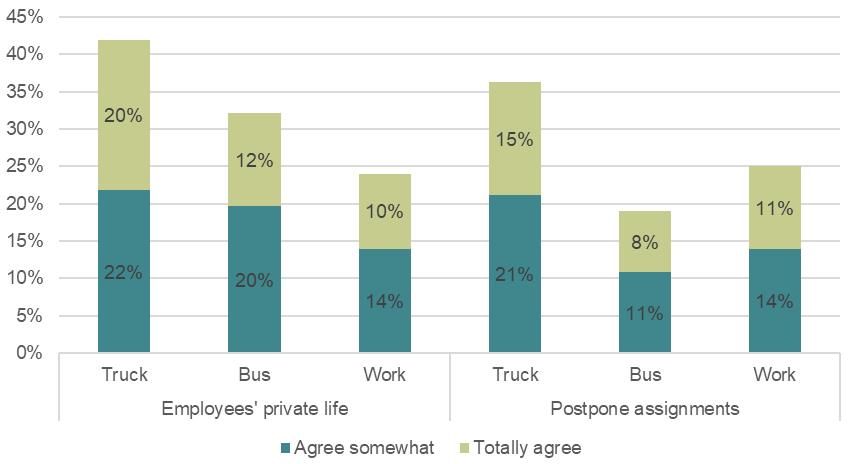
We see higher proportions of truck drivers who agree with the statements: We created sum score indexes of the questions (min: 2, max: 10), and Anova tests show significant differences between the groups ¬(p=<0.01). The mean score for truck drivers is 6.1 points, while it is 5.3 for bus drivers and 5.2 for work drivers.
When we compare the responses to the statements that measure Safety Ladder Level 3 in the different subgroups of work drivers, we see large differences between the different subgroups. For example, the proportion who agree with the first statement (“Employee private life”) is three times higher in the primary sector, industry and transport than in the retail, communication etc. sectors (29% agree versus 10% agree). The differences on the first statement are statistically significant at the 5% level (p=.013).
We also measure respondents perceived stress and time pressure with two questions:
-
When I drive for work, I find that time pressure and deadlines can influence road safety.
-
I am often in a hurry when I drive during work hours.
Figure 3.4 shows the proportions who agree with the statements in the three groups.
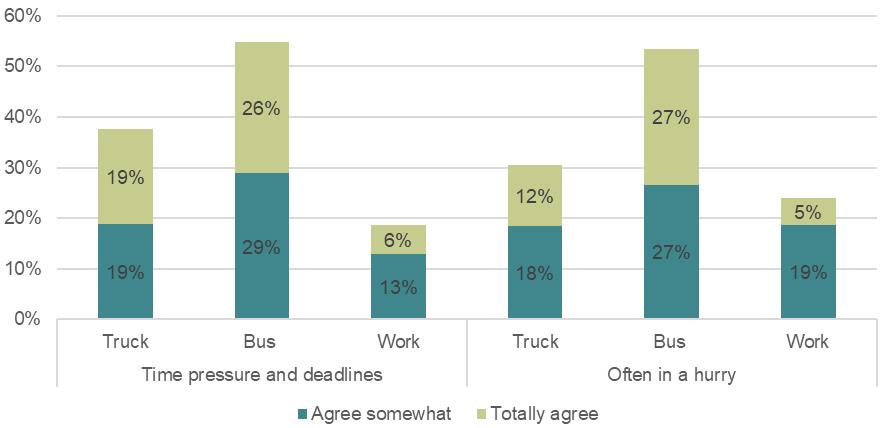
We see larger proportions of bus drivers who agree with the statements. It is reasonable to assume that this is about timetables and possible conditions that can cause delays (i.e. weather, road works, passengers). We created sum score indexes of the questions (min: 2, max: 10), and Anova tests show significant differences between the groups (p=<0.001). The average for truck drivers is 5.7 points, while it is 6.9 for bus drivers and 4.6 for work drivers.
When we compare the answers to the statements in the different subgroups of work drivers, we see that respondents from health, social and education agree to the greatest extent that they experience that stress and time pressure can influence road safety (27% agree) while retail, communication etc. agree to the least extent (12%). The differences between the subgroups are not statistically significant.
3.1.3.2. Interview results
The interviews indicate that employees who drive for work experience stress or time pressure when driving varies with their profession and work tasks. Health and care workers and veterinarians experience stress due to work tasks and the users they have to visit. They also often drive alone. Home care workers and veterinarians also drive a lot. Sectors such as cleaning, parks and caretakers have planned routes that they drive often and perhaps experience less stress. Cleaning workers never drive alone, partly to prevent stress and to cover all work tasks. Media workers drive as needed, and it varies whether they experience stress. We asked whether managers talk to employees about how stress and fatigue can influence driving. There was more focus on stress than fatigue in the conversations about this.
Previous interviews we have conducted with managers and representatives of employees in bus and truck show that stress and time pressure are perceived by many as a significant safety problem. However, the measures taken vary between companies. Some companies have systematic measures to reduce fatigue, stress and time pressure, for example through the payroll system, shift planning, route planning, etc.
3.1.4. Safety management system
The fourth step in the Safety Ladder is to implement a “Safety Management System”, e.g. ISO:39001, or other similar alternatives.
3.1.4.1. Survey results
The survey contains five questions about safety management system:
-
In my company we have a functioning system for reporting non-conformities
-
Reported non-conformities are regularly reviewed and analyzed by management.
-
In my company, measures are implemented based on reported non-conformities and risk analyses.
-
In my company, risk analyses are carried out of potentially dangerous work assignments and activities.
-
In this company we have work descriptions/procedures that describe the dangers of various assignments.
Figure 3.5 shows the percentages who agree with the statements for truck drivers and bus drivers.
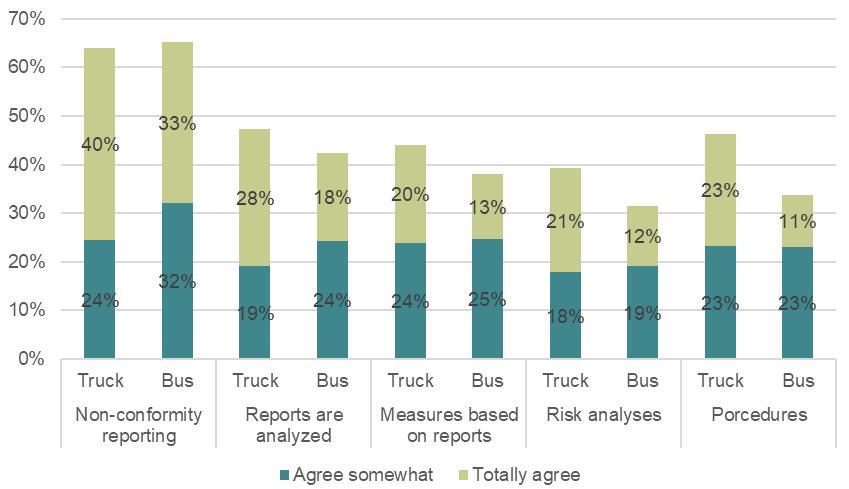
The results are relatively similar for truck drivers and bus drivers on these questions. There are generally somewhat higher proportions who agree with the statement: “In my company we have a functioning system for reporting non-conformities”. This is probably because this is more familiar to employees than what happens with the reports, i.e. whether non-conformities are reviewed and whether measures are taken based on them. On the other hand: the purpose of reporting is to analyze safety challenges and take measures, so measures based on reported non-conformities should be communicated to employees. This is important to motivate employees to report and is an element of a good safety culture.
Questions that measure safety management systems, also for work drivers
We can only speculate on how the work drivers would answer the questions about non-conformity reporting, risk analysis, etc. However, we have some clues from which we can speculate. The survey also contains a statement that measures a key aspect of the safety management system:
- My employer has ensured that I have received training in safe driving in relationship with my driving at work
Since this statement is about safe driving, it could also belong at Level 2 of the Safety Ladder, but we use it as a proxy question for Level 4, because it is about training, which is also an important aspect of the safety management system. Figure 3.6 shows the proportions of respondents who agree with the statements in the three groups.
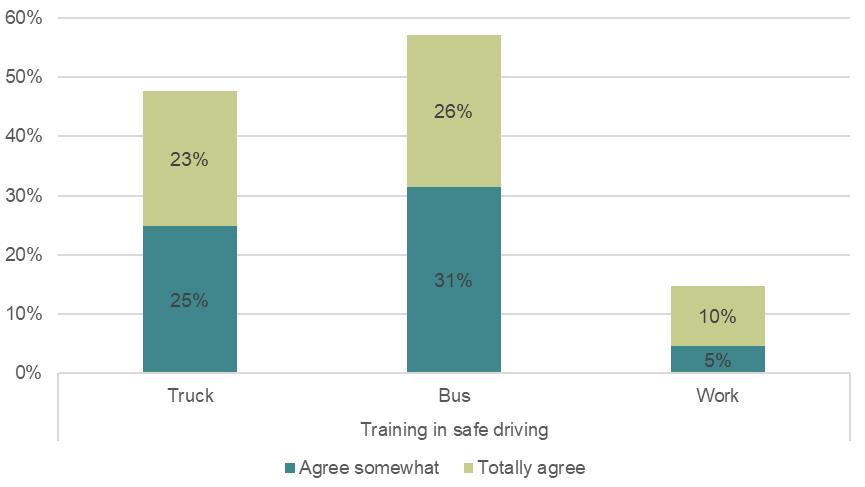
We see that the percentages of people who agree among bus and truck drivers are three times higher than for work drivers. When we look at subgroups of sectors among work drivers, there is a large variation. “Health, social and education” has 29% agree, while retail, communication etc. has 9% agree. The differences are statistically significant at the 1% level.
3.1.4.2. Interview results
Most informants said that they have a functioning reporting system for non-conformities and incidents, but the main focus of these systems is not on road safety and related incidents. The interviews indicate significant underreporting in these systems. Most management teams review reported incidents when they come in, process them on an ongoing basis and discuss them with those concerned. In some of the organizations, only major incidents are reviewed. One of the companies we interviewed conducted risk assessments at least once a year. One of the organizations had a quality management system: ISO 9001, while two organizations had an environmental management system: ISO14001, and the goal was to reduce unnecessary driving.
Previous interviews we have conducted with managers and employee representatives in bus and truck show that the implementation of safety management systems varies significantly among companies in bus and truck. Safety management systems are common in bus transport, especially because of larger companies. ISO:39001 is often required in tenders by buyers of public transport, for example Ruter, which manages over 50% of public transport in Norway. In truck, there is a large number of small companies. These usually do not have safety management systems. However, several large companies do.
3.2. Multivariate analyses
The second aim of the study is to examine the relationships between safety culture, safety management measures driving style and accident involvement.
3.2.1. What influences respondents’ involvement in traffic accidents at work?
We asked respondents whether they have been involved in a road accident while driving for work in the past two years (minimum material damage). A total of 18% of truck drivers, 21% of bus drivers and 9% of work drivers answered yes to this. The different groups have different mileages, so to get a proper comparison of accident involvement, we also need to control for exposure (kilometers driven while at work) in the analyses.
In Table 3.1, we examine variables explaining whether respondents have been involved in a traffic accident while driving for work in the past two years. We use logistic regression, since the dependent variable is dichotomous.
| Variable | Mod. 1 | Mod. 2 | Mod. 3 | Mod. 4 | Mod. 5 |
|---|---|---|---|---|---|
| Thousands of km driven at work in the last two years | 1.003** | 1.002* | 1.002* | 1.001 | 1.001 |
| Gender (Male=0, Female=1) | .378*** | .378*** | .523* | .552 | |
| Age (Over 26 years=0, Under 26 years=1 | 1.019 | .904 | .818 | ||
| Work drivers (=1, others=0) | .423*** | .423*** | |||
| Negative Driving Style Index (4 questions) | 1.137** | ||||
| Nagelkerke R 2 | .011 | .028 | .028 | .053 | .061 |
Exposure, or the number of thousand kilometers driven for work in the last two years contributes significantly in Models 1-3 and the odds ratio is higher than 1. This means that the more thousand kilometers one has driven for work in the last two years, the higher the probability of being involved in an accident. We see this relationship until we include the variable “work driver” in Model 4, which indicates differences between kilometers driven and work drivers: work drivers have lower exposure than the two other groups, and thus lower probability of accident involvement. The odds ratio for work drivers is lower than 1, which means a lower probability of being involved in traffic accidents, also controlled for kilometers driven. The variable gender contributes significantly in Models 2-4, and the odds ratio is below 1. This means that being a woman contributes to a lower probability of being involved in a traffic accident at work, controlled for the other variables. The gender variable stops contributing significantly in Model 5, when we include the Index for negative driving style. This means that the effect of gender on accidents is due to women driving less aggressively and risky than men and therefore having a lower probability of being involved in accidents.
The index for negative driving style contributes significantly and the odds ratio is higher than 1. This means that a negative driving style, i.e. aggressive and risky driving style, contributes to a higher probability of being involved in traffic accidents, controlled for the other variables in the analyses.
The Nagelkerke R 2 value is .061, which means that the models explain 6% of the variation in the respondents’ accident involvement while driving for work in the last two years. This is relatively low, and it indicates that the model only explains a small proportion of the accident involvement. This means that we also need to look at more factors than negative driving style, as we have measured it (and also more factors than gender, age and kilometers driven). The model contains relatively few variables.
3.2.2. What influences respondents’ negative driving style?
In Table 3.1 above, we saw that the variable negative driving style gave a higher probability of involvement in traffic accidents for the respondents. In Table 3.2 we examine variables explaining the respondents’ scores on the index for negative driving style.
| Variable | Mod. 1 | Mod. 2 | Mod. 3 | Mod. 4 | Mod. 5 | Mod. 6 |
|---|---|---|---|---|---|---|
| Gender (Male=1, Female=2) | -.080** | -.078** | -.026 | -.031 | -.036 | -.036 |
| Age (26 and over=1, 25 and under=2) | .082** | .071** | .064* | .066** | .074** | |
| Work drivers (=2, others=1) | -.152*** | -.147*** | -.059 | -.099** | ||
| Seniority (1<10 years, 2>10 years) | -.051 | -.051 | -.051 | |||
| Stress and time pressure index | .269*** | .241*** | ||||
| Safety culture | -.132*** | |||||
| Adjusted R 2 | .005 | .011 | .030 | .031 | .095 | .110 |
We see that gender contributes significantly and negatively in Models 1 and 2, indicating that women have a less negative driving style than men, i.e. a less aggressive and risky driving style. The significant effect of gender disappears when we control for work drivers in Model 3. Being a work driver is related to a lower degree of negative driving style and there are more women who are work drivers than professional drivers in the sample. The variable age contributes significantly and positively to the respondents’ negative driving style. This means that being under 26 years old gives a higher extent of negative driving style, controlled for the other variables in the model.
The variable work drivers contributes significantly and negatively to the respondents’ negative driving style; being a work driver results in a lower extent of negative driving style, controlled for the other variables in the model.
The index measuring stress and time pressure contributes significantly and positively to the respondents’ negative driving style. This means that the higher the levels of stress and time pressure that the respondents experience, the more negative is their driving style. Finally, we see that organisational safety culture, measured as managers’ and employees’ commitment to safety, contributes significantly and negatively in the analyses. This means that the more important the respondents perceive that road safety is among their own managers and colleagues, the less negative is their driving style.
Finally, we see that the adjusted R 2 value is .110, which suggests that the model explains 11% of the variation in the dependent variable.
3.2.3. What influences safety culture?
In the analyses above, we saw that safety culture — i.e., the safety commitment of managers and employees — is crucial for negative driving style, which in turn affects drivers’ involvement in accidents. In Table 3.3, we examine which variables explain variation in the safety culture index.
| Variable | Mod. 1 | Mod. 2 | Mod. 3 | Mod. 4 | Mod. 5 |
|---|---|---|---|---|---|
| Gender (Male=1. Female=2) | -.108** | -.107*** | -.037 | -.033 | .005 |
| Age (26 and above=1. 25 and below=2) | .090** | .072** | .071** | .036 | |
| Work driver (=2. Other=1) | -.214*** | -.281*** | -.016 | ||
| Index for stress/time pressure | -.211*** | -.072*** | |||
| Index for Safety Ladder level 2-4. | .751*** | ||||
| Adjusted R2 | .010 | .017 | .057 | .096 | .586 |
Gender contributes negatively and significantly in Model 1 and 2. This means that women rate the safety culture — i.e., the safety commitment of managers and colleagues — lower than men. The gender variable ceases to be significant in Model 3 when we include work drivers. The reason is that the work drivers variable co-varies with gender: this group includes a considerable proportion of women, in contrast to bus and truck drivers.
Age contributes significantly and positively, controlled for the other variables in Models 2–4. Respondents under the age of 26 report the highest score on the safety culture index (12.9 points compared to 11.4 for older respondents).
Work drivers contribute significantly and negatively to safety culture in Models 3–4. However, work drivers no longer contribute significantly in Model 5, when the Safety Ladder index is included. This is because the work drivers have a low score on the Safety Ladder index and the safety culture index. Work drivers have a score of 13.6 on the Safety Ladder index, while the score is 17.6 for truck drivers and 16.8 for bus drivers. This shows, as we have seen earlier, that work drivers have fewer measures directed toward organizational safety management. Their score on the safety culture index is 10.4, compared to 12.2 for truck drivers and 11.8 for bus drivers.
We also see that the index for stress and time pressure contributes significantly and negatively to safety culture, meaning that the higher the levels of stress and time pressure perceived by respondents — pressures that can affect safety — the lower they rate the safety focus of managers and colleagues. The coefficient for stress and time pressure decreases considerably when the Safety Ladder index is included in the model, indicating that management practices at these levels may help reduce the experience of stress and time pressure.
The Safety Ladder index contributes significantly and positively to organizational safety culture; the higher the scores on the Safety Ladder index, the higher the score on the safety culture index.
Finally, we see that the adjusted R² value is .586, indicating that the model explains 59% of the variation in the dependent variable.
4. Concluding discussion
4.1. Lower focus on road safety among work drivers
Our first hypothesis was that the organizations of work drivers have fewer measures aimed at organizational safety management and lower commitment to road safety among managers and employees than in bus and truck transport, because transport is a secondary activity in these organizations. The results from the surveys support this hypothesis to a large extent. The challenge for work drivers is that transport is a secondary activity in their organisations. The employees and managers in these sectors have other primary tasks than transport, and they are often more concerned with these than transport. This applies, for example, to home care, the entertainment industry, janitorial services, etc. Work drivers are often measured on these primary work tasks by their managers, and to a lesser extent on matters related to road safety. This is in contrast to professional drivers.
4.2. The importance of the Safety Ladder practices for safety
4.2.1. Safety commitment is fundamental
We had four hypotheses about the management practices and factors influencing safety outcomes (driving style and accident involvement) for drivers at work:
-
The driving style of occupational drivers influences their accident involvement (Hypothesis 2).
-
Driving style is influenced by organizational safety culture (Hypothesis 3).
-
There is a relationship between safety management system and organisational safety culture. The first deals with the formal aspects of safety in organisations, the latter with the informal aspects. (The first concerns Level 2-4 in the Safety Ladder, while the latter concerns level 1 in the Safety Ladder).
-
Drivers’ perceived stress and time pressure have a negative impact on their driving style (Hypothesis 5).
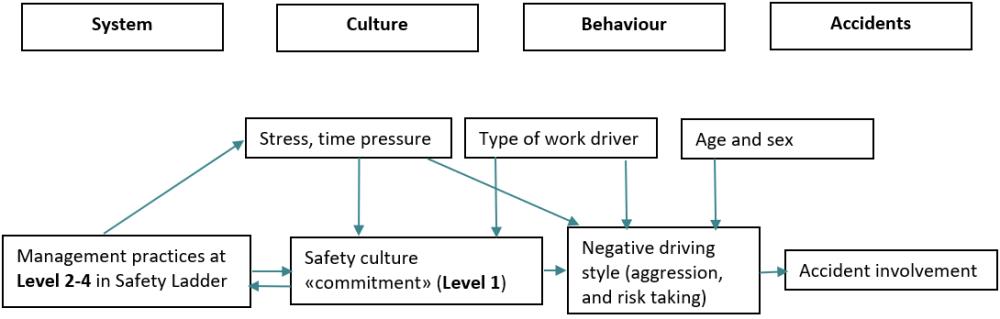
We conducted several multivariate analyses to examine the hypotheses regarding the relationships between respondents’ self-reported accident involvement while driving for work, driving style, safety culture, and safety management. The results are shown in Figure 4.1.
In the first analysis, we examined what influences respondents’ accident involvement when they drive for work. Here we found that negative driving style was one of the most important predictors. This is in line with Hypothesis 2, and previous research. Previous research shows relationships between negative driving style and accident involvement (Nævestad, Laiou, et al., 2019; Wallen Warner et al., 2011). Wallen Warner et al. (2011) and Nævestad et al. (2019) find that this particularly applies to so-called “aggressive violations” and risk-taking. Nævestad et al. (2019) find this for both professional drivers (bus and truck) and passenger car drivers. De Winter and Dodou (2010) find that road safety violations are related to accident involvement in a meta-analysis of passenger car drivers.
In the second multivariate analysis, we found that a good safety culture, i.e. a high commitment to road safety among one’s own managers and colleagues, is related to a lower degree of aggressive driving and risk-taking driving. This is in line with Hypothesis 3 and previous research. Previous studies have found a relationship between organizational culture and driver behavior (Davey et al., 2006; Wills et al. 2005; Huang et al., 2013; Öz et al., 2014). It is relatively well documented that safety culture is important for safety in organizations (Zohar, 2014).
We can conclude that our study shows that managers’ and employees’ safety commitment, i.e. safety culture, is fundamental to road safety. One of the factors that most influences respondents’ driving style is that everyone in the organization feels a shared commitment to road safety. This is especially true for work drivers, who have far fewer formal safety measures than professional drivers. One of the most important things that work drivers can learn from professionals is therefore to have a strong organizational safety culture, with a strong commitment to safety.
In the third analysis, we found a correlation between high commitment to road safety among managers and employees (“safety culture”) and road safety measures in the organization (“safety management system”). Commitment to safety is a prerequisite for such measures (safety management system) and several measures probably create higher commitment (improved safety culture). This is in line with Hypothesis 4. We discuss this correlation in light of previous research below.
4.2.2. What comes first: Safety culture or safety management system?
We have reciprocal arrows between organizational safety culture and the management practices in the Safety Ladder in Figure 4.1. On the one hand, safety culture is the first level in the Safety Ladder, and a prerequisite for further measures. On the other hand, safety culture is influenced by the safety management system (which is measured by levels 2-4 in the Safety Ladder). There is thus a reciprocal relationship between the management practices in the Safety Ladder and safety culture. The first is about formal aspects of safety (“what you say you do”), while the second is about informal aspects of safety (“what you actually do”).
The main hypothesised explanation for the link between safety management system and safety culture is that it is assumed that the development of formal procedures (“how things should be done”) will influence informal practices (“how things are actually done”) (Nævestad & Phillips, 2023) and thus facilitate new (common) ways of acting in organisations. This is the explicit motivation and justification for most sectoral legislation requiring SMS in aviation, rail and the maritime sector (ERA, 2020; ICAO, 2021; Lappalainen et al., 2012). The relationships we have seen between management practices at levels 2-4 of the Safety Ladder and safety culture (level 1) in the quantitative data support this assumption. Finally, the link between safety management system and safety culture can be explained by employees experiencing an increased management focus on safety in the organisation (if new SMS measured are introduced), which makes it easier to address safety topics and prioritise safety in their work.
At the same time, a certain level of safety culture is a prerequisite for implementing measures at levels 2-4 in the Safety Ladder. This is because implementing various formal measures to increase road safety requires a certain level of safety commitment. We can also say that it requires a certain level of organisational maturity, i.e. a desire to increase safety and address fundamental problems. Based on this, it can be argued that introducing a safety management system and the measures in the Safety Ladder require a certain organizational level of maturity. If SMS measures are required by external actors (authorities, transport buyers), organizations with a low level of maturity can implement such measures without them being “alive and known among employees”, “because they have to” (i.e. without having sufficient safety commitment to take the measures seriously enough). This is often due to the fact that the organizations do not have the required organizational maturity level, or not a good enough safety culture to properly benefit from the safety management system or the measures in the Safety Ladder.[2] It is difficult to conclude about these causal relationships in our study, because it is a cross-sectional study that measures all variables at one point in time and not an experiment where we can compare status with before and after measurements.
4.2.3. The negative influence of stress and work pressure
The multivariate analyses indicate that stress and time pressure result in more negative driving style, i.e. more aggression and risk-taking in traffic. This result is in line with Hypothesis 5, and previous studies of drivers at work, which find a relationship between drivers’ experiences of stress and time pressure and the occurrence of unsafe behavior in traffic. This applies, for example, to Phillips and Bjørnskau’s (2013) study of 1100 Norwegian drivers at work. Davey et al. (2006) find relationships between stress and time pressure and accident involvement, which is probably due to the fact that stress and time pressure influence driving style. Similarly, Nævestad et al. (2019) find a relationship between time pressure and aggressive driving style in a study comparing Norwegian and Greek bus and truck drivers.
The observed relationship between stress/time pressure and negative driving style is an important result, because it shows that safety management in organizations with drivers at work is also about reducing negative impact. The management practices at level 3 of the Safety Ladder are precisely about reducing the importance of factors that can create stress and time pressure. It is not enough to have policies for speed and driving style, etc., if the organization also creates a high level of stress and time pressure.
It can also be mentioned that demographic factors (age, gender) and type of driver influence the degree of negative driving style. The relationship between demographic characteristics and negative driving style is in line with previous research. It is well documented that certain key variables related to drivers’ demographic characteristics (e.g. young drivers, male drivers) explain some variation in their safety behavior (Elvik et al., 2009; Parker et al., 1998).
4.3. How can we save lives beyond 2025, through focus on occupational drivers?
The third aim of the study is to discuss what organisations with drivers at work and third-parties (transport buyers, insurers, industry organisations, authorities etc.) can do to increase the implementation of OSM in organizations with drivers at work. The relatively low focus on road safety in organizations with work drivers and the relatively low implementation of effective measures show that there is significant potential for improvement in this group. The study also shows that there is still potential for improvement among organizations that employ professional drivers: truck drivers and bus drivers. In these organisations, there is not 100% commitment to road safety, or 100% implementation of effective road safety measures. Thus, it seems that the implementation of measures in the Safety Ladder has not been completed and that there is also potential for increased safety commitment. The possibilities are considerable, because employers have a managerial prerogative which enables restrictive measures, and because research shows that measures have an effect. How can we save lives beyond 2025, through focus on occupational drivers? In the following, we discuss what can be done internally in organizations with drivers at work, before discussing measures at a societal level.
4.3.1. What can be done internally in organizations to reduce work-related traffic accidents?
Our study and previous studies (e.g. Nævestad et al., 2018, 2020) indicate that the management practices in the Safety Ladder are related to positive road safety outcomes. Additionally, these management practices provide a stepwise and simplified approach to road safety management, which might overcome the implementation barriers related to comprehensive SMS like ISO:39001, especially for organisations with few resources and low competence.
Table 4.1. presents management practices at the different levels of the Safety Ladder.
| LEVEL | Management practices | |
|---|---|---|
| Level 1 | 1 | Managers at all levels have a strong focus on road safety |
| 2 | Management emphasizes that drivers should drive as safely as possible | |
| 3 | Drivers receive praise and recognition from managers for driving safely | |
| Level 2 | 1 | Speed, driving style, seat belt and mobile phone policies, which are known to drivers |
| 2 | Fleet management system and continuously monitoring of drivers' speed and driving style. | |
| 3 | Drivers receive regular feedback (weekly, monthly) on speed and driving style from the system. | |
| Level 3 | 1 | The payroll system and work scheduling are designed to minimize drivers' stress and fatigue. |
| 2 | Drivers are encouraged to, and postpone, assignments when they believe it is not safe to complete . | |
| 3 | When planning assignments, an evaluation is made of the strain in terms of fatigue and stress that a new assignment will entail. | |
| Level 4 | 1 | The company has a functioning reporting system, which is used by both employees (reporting) and managers (systematically reviewing and learning). |
| 2 | The company regularly conducts formal risk analyses for all its assignments. | |
| 3 | The company has a good training program, with predefined, theoretical and practical sequences of activities and a plan for knowledge goals and activities to achieve and assess the goals. |
The importance of commitment to safety (safety culture)
Our analyses show that managers and employees’ commitment to safety, i.e. safety culture, is fundamental. It influences driving style (which influences accidents), and it is a prerequisite for further measures in the organization. We will therefore exemplify the management practices at level 1 in the Safety Ladder even further. We state e.g. in Table 4.1 that “Managers at all levels have a strong focus on road safety.” What does it mean in practice?
Edgar Schein (2004, p. 246) points to what he calls “six primary embedding mechanisms” that managers can use to shape culture. These provide more concrete examples of how managers can demonstrate that they prioritize road safety over other considerations in their daily lives:
-
What managers pay attention to, measure and regularly check
-
How managers respond to critical incidents and organizational crises
-
How managers allocate resources
-
Conscious role modelling, teaching, and coaching
-
How managers distribute rewards and status
-
How managers recruit, select, promote and fire.
Creating a good (or bad) safety culture is done on a day-to-day basis through these mechanisms, systematically prioritizing safety (over competing demands like delivery speed or efficiency).
4.3.2. What can be done at a societal level to reduce work-related traffic accidents?
The recommendations in the AEG report also focus on how different “third parties” can contribute to increased focus on road safety in organisations with employees who drive in their work. This applies e.g. to the role of authorities, as large employers of people driving in their work, as procurers of transport, and also to the role of financial organisations (banks, insurance companies etc.), which can require that organisations report their road safety footprint, and address road safety across their value chains (STA 2025). In the following, we provide a specific discussion of how third parties can contribute to reducing work related traffic accidents.
4.3.2.1. Internal motivation for managers: Create increased commitment to road safety
The question of what is needed to increase the implementation of the measures in the Safety Ladder is largely about how to contribute to increased commitment to road safety in organizations with drivers at work. Or in other words, what motivates managers. Our analyses show that managers’ motivation is crucial in influencing employees’ motivation to work actively with measures for organizational safety management. This is also found in previous research. Previous studies often highlight economic factors to motivate managers. The potential benefits of safety improvements are often “sold” to management as something that can lead to increased productivity (Murray et al., 2009, 2012; Wallington et al., 2014). Studies also refer to serious accidents and negative statistics on safety incidents as the primary reason why managers and employees in organizations are motivated to participate in the interventions . The importance of managers’ commitment to safety has also been highlighted in several intervention studies across transport sectors (e.g. Edkins, 1998; Lappalainen et al., 2012; Zuschlag et al., 2016).
We have little knowledge of what it takes to motivate managers in companies to focus more on road safety and the driving style of their employees. Raising awareness of the economic costs associated with road accidents is probably a relevant strategy, because it shows that road accidents are costly in several ways: income is lost when vehicles and employees are put out of action, there are also costs associated with vehicles having to be repaired or replaced, insurance premiums can increase, etc. This is a promoting factor in many studies from the road sector (Murray et al., 2009, 2012; Wallington et al., 2014).
An inhibiting factor found in previous research is that managers and employees do not have the competence, or resources to fully benefit from measures that focus on safety culture and safety management systems; that the organization is not mature. Nævestad and Phillips (2023) point out that there are significant differences in the organizational maturity level among managers and employees in the road sector compared to managers and employees in transport sectors with requirements for a safety management system. Organisational maturity level limits the types of measures and interventions that can be implemented. Developing courses and training for managers and elected officials on organizational safety management, aiming to increase the organisational maturity level in the road sector, can therefore be an important measure.
4.3.2.2. External motivation for managers: Enforcement of national OHS rules
As noted by the AEG recommendations, the legal obligation for organizations to work systematically with OHS (i.e. a safety management system) exist in a lot of countries, and organisations with drivers at work may include road safety in this work. Previous research has, however, found that OHS regulation, which is regulated by national labour authorities, not necessarily is sufficiently enforced in practice in road transport. This is also noted as an important challenge in the AEG 2025 recommendations. In Norway for instance, challenges are that drivers at work often are on the move, and regulators may lack specific road transport competence (Nævestad & Phillips, 2013). (Evaluations of OHS rule compliance may, however, be made in case of accidents.) Another challenge is that the OHS rules are not as comprehensive as SMS rules in other transport sectors. Nævestad and Phillips (2013) cite for instance a Norwegian accident investigation report, stating that the regulatory requirements that apply to companies operating bus transport do not include requirements for a safety management system to ensure overall traffic safety in connection with the company’s operations. Moreover, the AEG report, states that the widely accepted best practice for organizations implementing occupational health and safety requirements is use of a systematic management approach such as prescribed by e.g. ISO:45001 (STA 2025: 43). Thus, a central challenge to fulfil the intentions of the 4th Global Ministerial Conference on Road Safety in Marrakech, 2025, seems to be to ensure better OHS rules (e.g. in line with ISO:45001), and a more systematic national enforcement of OHS rules in the road transport sector, e.g. through increasing national awareness of these challenges, increased regulator competence and suitable regulation methods in the road transport sector (cf. Nævestad, Hesjevoll, et al., 2019).
4.3.2.3. External motivation for managers: Transport buyers and other third parties may set requirements
Previous research show that requirements from a third party, for example authorities, transport buyers, or insurance companies are decisive for safety measures to be introduced. The comparison between sectors shows that (inter)national rules and authorities’ requirements for safety management systems are decisive for measures to be implemented (e.g. Nævestad & Phillips, 2023). This is crucial in aviation, rail and the maritime sector. In the road sector, where international legal SMS requirements do not exist, and national OHS rules do not seem to be sufficiently enforced, transport buyers’ requirements are decisive, because this can contribute to raising the standard in the sector. This is a possible solution when safety management systems are not legally required in the road sector, as is done in other transport sectors.
In Norway, for example, the largest public transport authority, Ruter requires ISO:39001 from bus operators in tenders. The Norwegian Truck Owners’ Association has its own certification scheme “Fair Transport”. In the municipal and county government sectors, The Norwegian Council for Road Safety has the approval scheme “Traffic Safe Municipality”, which is an example of a safety management system for the municipal sector, which aims to contribute to a good safety culture. These schemes are largely voluntary. Industry organisations and insurance companies are also examples of third parties that can require and facilitate road safety measures from companies.
4.3.2.4. External motivation for managers: Road Safety Footprint and Road safety as an element of sustainability reporting
The first AEG recommendations related to the third ministerial conference on Road Safety, in Stockholm in 2020 (STA 2019), and UN Resolution 74/299 encourage organizations to identify and report their road safety footprint. The idea is that this can be included as part of the organizations’ overall sustainability reporting, which must be carried out by several large organizations from 2024. In this way, organizations can clarify how their operations and value chains influence road safety and show how they take responsibility for it; for their own employees, customers and society. Wennberg and Hyllenius Mattison (2024) provides a detailed study of this. Work on road safety footprints seems to involve, among other things to: 1) conduct analyses of accidents and incidents, 2) analyses of direct (employees who travel for work) and indirect (purchase of services, arrangements, etc.) impacts on road safety and 3) implement measures to reduce the footprint. The second AEG recommendations related to the fourth ministerial conference on Road Safety, in Marrakech in 2025, follow up the road safety footprint principle, suggesting financial organisations (banks, insurers, investors, auditors), specifically require that organizations receiving investment funds maintain an assurance process that includes reporting on their road safety footprint across their value chains, setting crash reduction targets, and implementing evidence-based interventions where necessary to reduce or eliminate serious crashes (STA 2025).
4.4. Methodological weaknesses
1) Small numbers in the survey of work drivers. Unfortunately, the sample in the survey of work drivers was relatively small. We would have liked to have had a larger data set for this group. We also used social media to recruit this group, i.e. the study is based on self-recruitment. Therefore, it is not possible to generalize to the entire population or say anything about different sub-sectors. We do not know anything about those who did not want to participate in our study, or how representative those who responded are, either for the different sectors or geographically. With few responses, it is conceivable that only those who are most positively or negatively engaged respond. It may seem that our respondents generally drive long distances for work, and that they are therefore particularly concerned about the topic of work-related driving. In addition, we have a dominance of men in our sample and a large share of respondents over 56 years of age. We need more studies with larger samples, drawn in other ways, to be able to draw robust conclusions.
It can also be mentioned that the informants we interviewed are probably more concerned about road safety than average, since they agreed to participate in the interviews. If we compare it with the results from the questionnaire, the informants from the interviews seem more committed to road safety than the respondents in the questionnaire. It is not unreasonable to assume that managers who are committed to road safety and work actively with it in their organization also have more initiatives and are more willing to be interviewed about this. However, there was no room for extensive recruitment work and follow-up of more reluctant participants.
2) The representativity of the professional drivers. It can also be asked whether the professional drivers in our sample work in organizations with a greater focus on safety than is the case for these populations in general. We recruited professional drivers through unions. The degree of union membership is very low in the trucking industry (e.g. 10%), and it is far higher in bus transport (probably around 80%). Trucking companies with unionized workers may be larger than is generally the case, or they may have more safety measures and a management that is more concerned with safety and the working environment than the average in the industry. Thus, it is not unlikely that the truck driver respondents’ assessments of the prevalence of commitment and measures may overestimate the prevalence in the population of trucking companies. Previous research shows a general low focus on organisational safety management in organisations with drivers at work (Mooren et al., 2014; Nævestad, Phillips, & Elvebakk, 2015; Wills et al., 2006). Our results from bus and truck do, however, not indicate very low commitment. These are important questions for future research.
3) Results are largely based on self-reported figures. It is also important to remember that our results are based on self-reported figures, with the possible biases that this may entail. For example, respondents may have incorrect or poor memory, they may potentially over-report positive things about themselves and under-report negative things, etc. These are known problems when using self-reported data. However, we do not have indications of such effects in our data. On the other hand, we ask about different types of measures in the Safety Ladder, and it is not inconceivable that respondents in the different sectors interpret these questions in different ways, as they have different baselines and points of reference. This is also an important question for future research, for example qualitative interviews.
Moreover, the study is based on self-reported data on employees perceived safety commitment among managers and colleagues, employees perceived safety management and employees’ self-reported driver behaviour and self-reported accident involvement. It would be better to follow up the key outcome measures directly, e.g. through measurements of speed and seat belt use compliance. This was, however, not possible with the current study design. The reliance of self-reports is a weakness of the study. However, the Safety Ladder approach involves that these indicators are followed up directly and objectively in the companies, e.g. through fleet management system technology.
4.5. Need for future research
1) Future research could also include analyses of, and measures for, commuters. It is important to focus on people who drive to/from work, because they account for 11% of those involved in fatal traffic accidents. In addition, the study by Nævestad et al. (2015) shows that commuters are more often defined as triggering the accidents in which they are involved to a greater extent than drivers at work. Commuter accidents can be considered a work-related road safety issue, because these accidents are likely to be influenced by working hours; it is not unreasonable to assume that driving home after, for example, a night shift involves a higher risk of road accidents.
Nævestad et al. (2015) indicate that fatigue is a challenge for a significant proportion of commuters. In future research, it is important to examine stress and time pressure for commuters, and how employers, authorities and others can facilitate increased road safety for this group of road users. Nævestad et al. (2015)'s analyses of injury rates in fatal and personal injury accidents may indicate that commuters have a higher risk of personal injury accidents and fatalities than drivers at work in general. However, there are no comparable exposure figures for the two groups. We can assume that the same mechanisms are important for improving commuter road safety as for drivers at work: commitment to safety and measures at levels 2-4 of the Safety Ladder. Commuters appear to be more exposed to risk factors related to fatigue and stress (Nævestad, Phillips, Elvebakk, et al., 2015).
2) Taxi drivers should be included in future studies. Taxi drivers are also professional drivers, but they are not included in this study. Future studies of working drivers should also include taxi drivers.
3) Self-employed drivers at work. The survey on safety culture and safety culture is generally aimed at employed drivers at work. This is because measures for safety culture and safety management generally assume an employment relationship, where managers facilitate employees. However, there are considerable proportions of self-employed drivers at work. Seven percent of the work drivers we study are self-employed. Mapping relevant measures for this group and good ways to measure safety culture is an important topic for future research. One can focus on measures and measurement tools that do not assume an employment relationship. A number of technological measures will be relevant, for example; fleet management systems, ISA, etc.
4) Choice of vehicle fleet. Companies’ choice of vehicle fleet, involving high levels of active and passive safety measures, is a significant measure that organizations can take to influence their road safety performance. This should have been included as a question in the interviews, and it is a limitation that it was not included. This is clearly a factor which is crucial for road safety, and which is likely to be influenced by managers safety commitment. The fleet choice can both concern mode choice (e.g. walk, cycle, car) and active and passive safety measures. In future Safety Ladder studies, choice of vehicle fleet can be included both as an aspect of level 2, which already includes choice of active safety vehicle technology in general (fleet management system), and level 4, which concerns risk assessments that can serve as basis of choice of vehicle fleet.
CRediT contribution statement
Tor-Olav Nævestad, Conceptualization, Formal analysis, Funding acquisition, Investigation, Methodology, Project administration, Writing—original draft, Jenny Blom, Investigation, Methodology, Writing—original draft, Ingeborg Hesjevoll, Investigation, Methodology, Writing—original draft
Declaration of competing interests
The authors report no competing interests.
Funding
This study was funded by the Norwegian Traffic School Association “Norges Trafikkskoleforbund”. Our contact person has been Ingunn Haavi Finstad.
Acknowledgements
We are very thankful to all the respondents who have helped us by answering our survey and the people who have agreed to participate in interviews.
Ethics statement
The methods for data collection in the present project have been approved by Norwegian Agency for Shared Services in Education and Research (SIKT)which assists researchers with research ethics of data gathering, data analysis, and issues of methodology.
Declaration of generative AI use in writing
The authors declare that no generative AI was used in this work, except for providing suggestions for language improvements and translations from Norwegian to English.
Editorial information
Handling editor: Stijn Daniels, Transport & Mobility Leuven | KU Leuven, Belgium
Reviewers: Nicholas John Ward, Leidos, the United States of America; Claes Tingvall, Monash University Accident Research Centre, Australia | Chalmers University of Technology, Sweden; Maria Krafft, Swedish Transport Administration, Sweden
Appendix
Appendix 1: The six AEG 2025 recommendations
The six recommendations are found here (STA 2025): https://trafikverket.diva-portal.org/smash/record.jsf?pid=diva2%3A1936696&dswid=-8451
-
In order to prevent road traffic fatalities and injuries among employees and third parties, private and public organizations should include specific attention to road safety in the systematic management of their work environment as required by occupational health and safety law.
-
In order to fully utilize the potential of governments and government organizations to improve road safety on a global scale, national and city governments and international governmental organizations should use their influence as leaders and role models as well as their power as large employers and their authority as regulators and enforcers to advance road safety actions following the Safe System approach.
-
In order to incentivize organizational action to improve road safety, financial actors such as banks, investors, insurance companies, and auditors should, e.g. explicitly mandate that entities actively address road safety across their value chains as a prerequisite for financial involvement, and require that organizations receiving investment funds maintain an assurance process that includes reporting on their road safety footprint across their value chains, setting crash reduction targets, and implementing evidence-based interventions where necessary to reduce or eliminate serious crashes, etc.
-
In order to internalize road safety responsibility across their entire value chain, fulfill legal requirements, and ensure compliance with road rules as a minimum standard, public and private organizations should apply a safety management system such as ISO 45001 or ISO 39001.
-
In order to establish a safety culture that goes beyond compliance with rules, organizations should introduce and nurture a safety-first principle where employees can expect the safest working environment, including, e.g. encouragement for employees to identify and report safety risks without concern about punishment or retribution and with expectation that the organization will investigate and respond with corrective actions, incorporating suggestions from employees where possible for improved safety procedures, products and practices, etc.
-
In order to support organizational efforts to comply with occupational health and safety obligations, take responsibility for road safety across their footprint, and realize the potential benefits of safer vehicles in the global fleet, the automotive sector, including vehicle and equipment manufacturers, should, e.g. take responsibility for road safety across their organizational footprint, including transparent data collection, problem identification, implementing evidence-based interventions, and reporting on progress.
Appendix 2: Recruitment of respondents
The truck drivers and bus drivers were recruited through three trade unions. These respondents were recruited via our contact persons at the trade unions. The contact persons forwarded links to the survey which stated that we wanted to learn more about road safety for people who drive trucks or buses at work, that answers are treated confidentially etc. The information and links were, for example, published in joint newsletters to union members, distributed via email, or sent by email separately. We have not calculated response rates for the different groups, either because we lack information about how many people have received the information and link to the survey, or how many have seen the information and link and possibly opened it. We do not know the number of people who have had the opportunity to respond. We do know, however, that relatively few truck drivers responded in one case. To increase the number of responses from truck drivers, we gave the drivers the opportunity to participate in a draw for a gift card of 3,000 kroner in a new sample of truck drivers. The truck drivers were therefore recruited from two unions.
We have also conducted a survey involving 355 respondents who drive for work, but are not professional drivers. We call these work drivers. These work in various sectors. We recruited these through an advertisement on Facebook, from a wide range of sectors and organizations across the country. The advertisement on Facebook was posted by the Institute of Transport Economics with the text:
“Do you drive a car when you are at work, but are not a professional driver? Then we would like you to participate in a survey about road safety. Everyone who participates is entered into the draw for a gift certificate of 5,000,- at “Elkjøp”. We are interested in all driving during working hours, even if you only drive occasionally, to meetings, to pick up things, etc. during working hours. Answer the survey here:”
A main reason for disseminating information about the survey through such an advertisement on Facebook is that we wanted to examine the topics in the survey in as many different organizations as possible. We wanted to reach out broadly to all types of professional groups except professional drivers, and to employees all over the country. Another recruitment alternative could have been a panel of representative respondents from all over the country, and then filter out work drivers from that, but we considered that this would be costly, because only some of the representative respondents would be work drivers. We would therefore have had to use a fairly large panel to get a reasonable number of respondents. Through an advertisement on Facebook, we could let the work drivers “recruit themselves”. We have not calculated response rates for the different groups of work drivers, because we lack information on how many relevant respondents have seen the advertisement on Facebook and what proportion have chosen to click on the link and respond.
Appendix 3: Characteristics of the respondents
| Permanent employee | Part-time | Self-employed | Employment agency/ staffing |
Other | Total | |
|---|---|---|---|---|---|---|
| Truck drivers | 96% | 2% | 0% | 0% | 2% | 298 |
| Bus drivers | 77% | 17% | 0% | 0% | 6% | 305 |
| Work drivers | 85% | 4% | 7% | 1% | 4% | 355 |
| Total | 86% | 7% | 3% | 0% | 4% | 100% |
| Total | 830 | 71 | 25 | 3 | 38 | 958 |
The majority of bus drivers are permanent employees. The most important differences are that several of the bus drivers are part-time employees, and that some of the work drivers are self-employed. The truck drivers and bus drivers are, as mentioned, recruited from trade unions (with no self-employed).
We ask what type of driving the truck drivers do: 19% work in long-distance transport, 35% in distribution transport, 20% in regional transport and 25% in a mix of these three. In terms of industry, 32% of the truck drivers work in general cargo, 23% in thermo transport and 15% in dangerous goods (ADR), while the rest work in construction transport, bulk and other.
We also ask about the type of driving the bus drivers are involved in: 22% drive city buses, 26% regional buses, 8% long-distance buses, 14% school buses and the rest various types or “other types” than mentioned. In total, 75% drive diesel buses, 11% electric buses, 7% gas buses, and the rest various types. In total, 23% drive 12-meter high-floor buses, while 16% drive 13-15-meter low-floor buses.
Table A2.2 shows the sectors where the work drivers are employed. We originally had 12 different options, which we have combined into six options.
| Sector | total | Percentage | Seniority | 1000 km last 2 years |
|---|---|---|---|---|
| Primary sector, industry, transport etc. | 118 | 33 | 14 | 34 |
| Retail, communication etc. | 66 | 19 | 13 | 26 |
| Public administration, research, development | 85 | 24 | 12.3 | 21 |
| Health, social, education | 56 | 16 | 11 | 26 |
| Other | 30 | 9 | 10.9 | 34 |
| Total | 355 | 100 | 12.4 | 26 |
We also ask about the work drivers’ position, level in their own organization, and 12% are managers of a company, organization, unit, 18% are middle managers, 13% are “other” managers, while 56% are employees. A proportion of 87% of respondents are permanent employees, 3% are part-time employees, 6% are self-employed, 1% are employed by a temporary employment agency/staffing company, while 3% have answered other.
Figure A2.1 shows the frequency of driving of the work drivers
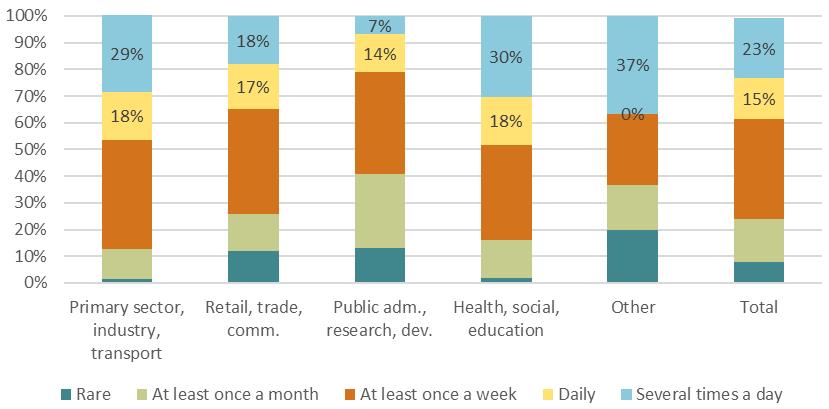
Around half of the work drivers use their own car in their work. A total of 78% of the drivers drive a passenger car for work, while 19% drive a van and the rest other types of vehicles. The proportion of drivers driving a van is highest in primary industry, industry and transport (36%). Around 40% drive an electric car in their work.
Appendix 4: Topics in the survey
The survey contains various themes:
-
Background variables: gender, age, seniority in the job, county, position level, employment status (permanent, employee, part-time employee, self-employed, temporary worker/staffing agency, etc.). Which sector the respondents work in. We have questions measuring the type of truck (cf. Nævestad et al., 2020, 2023), and three questions for the type of bus transport and the type of bus that the respondents drive (cf. Nævestad et al., 2022).
-
Work-related driving for work drivers: how often they drive, where they drive (in urban areas, rural areas, both, etc.).
-
Commitment to road safety (“road safety culture”) (Safety ladder level 1)
We measure commitment to road safety through an index based on three statements:
-
Road safety is very important to the top management of the organization where I work.
-
Road safety is very important to my immediate manager.
-
Road safety is very important to my colleagues
The response alternatives range from 1 (strongly disagree) to 5 (strongly agree). This applies to all of the statements listed below, unless otherwise specified. In addition, we have a sixth option, which is “don’t know”. We removed the sixth option and created a sum score index based on the three statements (min: 3, max: 15) (Cronbach’s Alpha: .860).
-
-
Policies for speed, driving style, seatbelts and mobile phone use (Safety Ladder Level 2)
We have two statements that measure the Safety Ladder’s level two:
-
My workplace has clear and well-known guidelines for speed and driving style that employees who drive for work must follow.
-
Management emphasizes that employees who drive for work should not drive faster than the speed limit and conditions allow.
We removed the sixth answer alternative and created a sum score index with the first two statements (min: 2, max: 10) (Cronbach’s Alpha: .846).
-
-
Focus on work-related factors (Safety Ladder Level 3)
We have two statements that measure the Safety Ladder’s level three:
-
At my workplace, we have a strong focus on how employees’ private lives (e.g., lack of sleep, stressful life situations) can influence road safety.
-
In my company, it is common for employees who drive in their work to interrupt/delay assignments, if they feel tired or unprepared.
We removed the sixth answer alternative and created a sum score index (min: 3, max: 15) based on the two questions (Cronbach’s Alpha: .860).
-
-
Safety Management System (Safety Ladder Level 4)
We have six statements that measure the Safety Ladder’s level four. Unfortunately, the five first statements were only answered by truck drivers or bus drivers.
-
In my company we have a functioning system for reporting non-conformities
-
Reported non-conformities are regularly reviewed and analyzed by management.
-
In my company, risk analyses are carried out of potentially dangerous work assignments and activities.
-
In my company, measures are implemented based on reported non-conformities and risk analyses.
-
In this company we have work descriptions/procedures that describe the dangers of various assignments.
We removed the sixth answer alternative and created a sum score index (min: 3, max: 15) based on the five statements (Cronbach’s Alpha: .922).
A sixth statement measuring a key aspect of safety management system (safety training), was answered by all three groups. This is our primary measure of Safety Ladder’s level 4:
- My employer has ensured that I have received training in safe driving in relationship with my driving at work.
Since the question is about training in safe driving, it could also belong at Level 2 of the Safety Ladder, but we use it as a proxy question for Level 4, because it is about training, which is also a central aspect of Level 4 of the Safety Ladder.
-
-
Questions about stress and time pressure:
-
When I drive for work, I find that time pressure and deadlines can influence road safety.
-
I am often in a hurry when I drive during work hours.
-
-
Questions about negative driving style. For every tenth time you drive a car for work, approximately how often do you do the following:
-
Positioning yourself so far out at an intersection that the driver with the right of way must stop to let you through
-
Getting annoyed by a certain type of driver and showing your annoyance in every possible way
-
Honk your horn to show a fellow road user that you are annoyed with him or her.
-
Accepts some risk because “the situation demands it” (e.g. due to time pressure, bad weather)
Answer alternatives: 1) Never, 2) 1-2 times, 3) 3-4 times, 4) 5-6 times, 6) 7-8 times, 7) More than 8, but not always, 9) Always. The three first questions are from "Driver behaviour Questionnaire » (DBQ) questions, based on Wallén Warner et al. (2011). The questions used, as they have been shown to be related to drivers’ accident involvement in previous research (Nævestad, Laiou, et al., 2019; Wallen Warner et al., 2011). We combined the four statements into a sum score index (Chronbach’s Alpha: .604).
-
-
Questions about accidents, injuries and incidents. “Here are some questions about accidents, injuries and incidents.” “Have you been involved in a traffic accident while driving a car for work in the last two years? (You can choose multiple options).” Answer alternatives: 1) No, 2) Yes, an accident with only material damage, 3) Yes, an accident with personal injury, 4) Yes, an accident with fatal personal injury.
ISO 39001 and ISO 45001 both follow the Plan–Do–Check–Act cycle and emphasize leadership commitment, worker participation, continual improvement, and legal compliance, but ISO 39001 focuses specifically on road safety while ISO 45001 addresses overall occupational health and safety. ISO:45001 is more common, and can also be adapted to road safety measures, indicators and outcomes in organisations with drivers at work. ↩︎
e.g. Companies may have formal reporting routines, but they are not followed in practice, as employees fear punishment for reporting their mistakes. Thus, the organisation does not learn from reports. ↩︎