TARGET Setting for High Severity Collisions: Tolerance-Based Assessment of Risk for Generalized Event Thresholds
Abstract
Vision Zero represents a road safety approach with aspirations toward eliminating serious and fatal injuries associated with traffic collisions. Given the well-described relationship between speed at impact and injury outcomes, many researchers have used a variety of methodological approaches to develop speed thresholds associated with human injury tolerance levels for serious and fatal injuries. The goal of this study was to present a framework based on state-of-the-art injury risk models using the latest field data and featuring biomechanically-relevant predictors in order to create safe impact speed thresholds. Tolerance-based Assessment of Risk for Generalized Event Thresholds (TARGET) values for safe speeds for several sets of the most commonly observed collision geometries and partners were estimated using previously-developed injury risk models. Consistent with prior literature, an injury tolerance level of 10% risk at the MAIS3+ severity level was evaluated given its association with high severity injury outcomes. Leveraging models built on German collision data for VRUs, the safe impact speed thresholds were 34 kph for pedestrians and 49 kph for cyclists and motorcyclists. Using models built on U.S. collision data for collisions involving passenger vehicles, the thresholds for closing speed were 99 kph for a frontal collision, 73 kph for a near-side collision, and 126 kph for a rear-end collision. The TARGET values established in this study are consistent with those previously developed and can serve as a validation of these previous studies. As an additional demonstrative, we highlighted other factors (increased age and vehicle seating position) that affect serious and fatal injury risk and were associated with decreased safe impact speed thresholds. This study used a data-driven approach, injury risk models with additional biomechanically-relevant predictors, and the most modern collision data to provide a more precise approach to quantify generalized speed thresholds associated with biomechanical tolerance for humans involved in automotive collisions. Given the relationships between speed and injury risk, reducing speed in a collision below these thresholds is key to mitigating serious and fatal injury outcomes. The objective injury risk approach used in this study enables traffic safety practitioners to determine the relative effect of related safety countermeasures on reaching the goals of Vision Zero and a Safe System Approach.
1. Introduction
According to the most recent data from the World Health Organization, approximately 1.19 million persons died in 2021 as a result of road traffic collisions, ranking as the leading cause of death for persons aged 5-29, with an additional 20 to 50 million people sustaining non-fatal injuries annually (WHO, 2023). Globally, there has been a decrease in the overall number of traffic-related fatalities (~5%) and traffic fatality rate (~16%) over the last decade ending in 2021, though the United States has a fatality rate more than double the average among other high-income countries (WHO, 2023; Yellman & Sauber-Schatz, 2022). It must be noted that after having over 43,000 people suffer traffic-related fatalities in the U.S. in 2021, the country has since seen eight consecutive quarters of decreasing fatalities when compared to the corresponding quarter from the previous year (NHTSA, 2024).
1.1. Vision Zero and the Safe System Approach
Over the last 50+ years, efforts have been carried out to address the aforementioned global harm caused by injuries and fatalities associated with traffic collisions (e.g., seatbelt enforcement, airbag development and improvement, separated cyclist lanes, roadway speed limits). Perhaps the most successful has been the holistic Vision Zero approach championed by Sweden (Larsson et al., 2010; Lie & Tingvall, 2001; Tingvall, 2022). Initiated in 1997 via Parliamentary action, Vision Zero strives for no serious injuries or fatalities within the road transport system and has resulted in a greater than 50% reduction in traffic-related fatalities in Sweden (Road Safety Sweden, n.d.). Other countries, cities, and communities have since adopted this approach. An underlying, implicit aspect of Vision Zero is that the biomechanical tolerance of the human body to injury represents the limiting factor in a Safe System (Larsson et al., 2010; Tingvall & Haworth, 1999).
Fundamental to the Safe System Approach is the interplay of humans, vehicles, and roadway infrastructure with speed (Larsson et al., 2010). As implemented by the U.S. Department of Transportation, the Safe System Approach calls for Safer People (e.g., cyclist helmet usage, pedestrians using crosswalks, belted vehicle occupants), Safer Vehicles (e.g., improvements in active and passive safety to avoid and/or mitigate collisions), Safer Roads (e.g., improved roadway design, such as divided cyclist lanes, traffic circles), Safer Speeds (e.g., refined speed limit setting, enforcement of speed limits), and Post-Crash Care (e.g., access to timely medical care, secure collision scenes) (United States Department of Transportation (U.S. DOT), 2022). This creates a shared responsibility among roadway users that acknowledges that serious injuries and fatalities are unacceptable, and humans are an inherently vulnerable member of the human-centered Safe System.
However, in order to achieve the goals of Vision Zero and the Safe System Approach, practitioners need an objective, accurate characterization of human injury tolerance that accounts for factors related to the transportation system (e.g., speed, vehicle type, safety equipment) across a variety of collision scenarios. Decisions related to Vision Zero, like the setting of road speed limits or design of active and passive safety technology, can then be informed using these objective injury risk functions. Because the aim of Vision Zero and the Safe System approaches is to eliminate serious injury and fatalities, accurate predictive measurement methods that rely on injury risk are necessary.
1.2. The measurement challenge: assessing injury severity
For any collision event, there exists both a propensity for injury and an actual observable outcome, and approaches for both have been developed. The most straightforward approach is to simply assess the involved person’s injury status (injured or uninjured) post-collision to define the collision severity (outcome-based approach). An alternative approach is based on characteristics of the collision and person-specific considerations. The severity of the collision may be evaluated by estimating the probability of an injury occurring for a person involved in a collision (risk-based approach). Risk-based assessments have historically been based on models built from injury outcome data and can be used to prospectively evaluate the potential for an injury rather than indexing on an actual occurrence.
1.2.1. Abbreviated injury scale
While Vision Zero’s objective is to eliminate serious traffic injuries and fatalities, a precise, objective definition was not outlined at its outset. Previous definitions of serious injury have included hospital or intensive care unit admission, length of hospitalization, inability to work (disability), and length of recovery, among others (European Commission, 2015; Lupton et al., 2022). Regardless of whether a risk-based or outcome-based approach is used, determination of serious injury outcomes requires some communicable coding system for assessing injury severity. In 1969, to support this type of analysis, the Association for the Advancement of Automotive Medicine (AAAM) generated the Abbreviated Injury Scale (AIS) (AAAM, 2016). Since its introduction, the system has undergone many updates, including the latest revision in 2015. This internationally recognized scale scores injuries from 1 (minor) to 6 (maximal), with AIS3 injuries being defined as ‘serious.’ The scoring system itself is developed by expert consensus with considerations of “energy dissipation, tissue damage, treatment, impairment, and quality of life (AAAM, 2016).” Since its introduction, the AIS scoring approach has become the standardized methodology for describing and ranking injuries in automotive medicine, being used to support the research and design of new vehicles and becoming a part of existing laws and regulations. For example, as of 2015, the European Union agreed to a common definition of serious injury as having an injury level of 3 or higher on the Maximum Abbreviated Injury Scale (MAIS) (European Commission, 2015). MAIS represents a convenient way to aggregate multiple injuries into a single metric to convey the severity of sustained injuries by assigning a score associated with the injury with the highest AIS score (e.g., someone who sustained an AIS1 injury and AIS4 injury would be considered as having sustained injury at the MAIS4 severity level).
1.2.2. Severity considerations in standards
The AIS is used extensively in the automotive industry and standards for the assessment of severity from a biomechanical perspective. For example, ISO 26262-3 describes a functional safety framework for use within automotive applications. Part of that includes the definition of severity for events. The standard utilizes four classes that delineate the relative harm associated with given events (Table 1) (International Organization for Standardization (ISO 26262-3), 2018). In a similar vein, SAE J2980 is a recommended practice “intended to provide guidance for identifying and classifying hazardous events” that leverages the severity levels defined in ISO 26262-3 (Society of Automotive Engineers (SAE J2980), 2015). It presents a range of collision speeds associated with the different severity levels for frontal, rear, and side vehicle-to-vehicle collisions based on field collision data from France, Germany, Japan, and the United States. It must be noted that each of these applications utilizes a probabilistic, risk-based approach associated with a non-zero level of injury potential for target setting.
| Severity class | Description | Definition |
|---|---|---|
| S0 | No injuries | ≤10% probability AIS1+ injury |
| S1 | Light and moderate injuries | >10% probability AIS1+ injury and ≤10% probability AIS3+ injury |
| S2 | Severe and life-threatening injuries (survival probable) | >10% probability AIS3+ injury and ≤10% probability AIS5+ injury |
| S3 | Life-threatening injuries (survival uncertain), fatal injuries | >10% probability AIS5+ injury |
Injury tolerance criteria also feature in Federal Motor Vehicle Safety Standards (FMVSS). Specifically, FMVSS 208, which regulates occupant crash protection in the United States, and FMVSS 214, which covers side impact protection, feature a variety of biomechanical injury criteria thresholds for the head, neck, and chest [FMVSS 208, FMVSS 214]. These criteria also feature as cutoffs in New Car Assessment Programs (NCAP), such as U.S. NCAP and Euro NCAP, and the Insurance Institute for Highway Safety’s (IIHS) vehicle testing program [IIHS, NCAP, Euro NCAP]. These tolerances, or injury assessment reference values, are based on decades of biomechanical research and are the result of injury risk models relating biomechanical loading to the observation of injury (Mertz et al., 2016). Given biomechanical variance, rather than being a binary injury vs. no injury threshold, these criteria are associated with some non-zero likelihood of injury. For example, the threshold value for the Head Injury Criterion, a metric approximating the impulse imparted to the head during impact, is 700, which is associated with a 4.3% risk of AIS4+ brain injury and 11.2% risk of AIS3+ head injury (Eppinger et al., 1999; Mertz et al., 2016; National Highway Traffic Safety Administration (NCAP), n.d.).
1.3. Previous research investigating safe speed thresholds
Given the still high global burden of serious traffic injuries and fatalities, many researchers have sought to develop thresholds associated with safe speeds (Table 2). Higher speeds are a well-known factor associated with death and serious injury, and managing speeds through thresholds aimed at mitigating these injury outcomes is a vital part of Vision Zero. While two studies (Eugensson et al., 2011; Tingvall & Haworth, 1999) estimated thresholds with no tolerance for serious injuries or fatalities, the most commonly-used criterion has been a 10% probability of injury at the MAIS3+ severity level, which is consistent with the S2 level of ISO 26262-3. A variety of data sources were used to develop these thresholds, including expert consensus (Eugensson et al., 2011; Rizzi et al., 2023; Tingvall & Haworth, 1999), event data recorders from crashed vehicles (Doecke et al., 2020, 2021), data from reconstructions of collision events (Lubbe et al., 2022, 2024), and previously-developed injury risk models [Jurewicz et al., 2016; Truong et al., 2022]. Among the data-driven methods, older data and/or simplified injury risk models were used or small data samples were leveraged that may not be directly relevant for a representative assessment of serious and fatal injury risk. Additionally, several of these studies presented thresholds for vehicle impact speeds and roadway speed limits. These analyses considered the effect of pre-crash braking, principally through automatic emergency braking (AEB). Each of these studies modeled 100% vehicle occupant seatbelt usage. The summary presented here represents a compendium of recent efforts and is not intended to be exhaustive. As presented in Table 2, impact speed represents the speed at the time of impact, and travel speed represents the vehicle speed prior to any avoidance maneuver or crash mitigation (e.g., braking). Further, head-on collisions represent a subset of frontal events where two vehicles traveling in opposite directions collide, each experiencing a frontal contact. Frontal contacts necessarily also include any other contacts in which the front end of the vehicle contacts another vehicle or object.
| Collision configuration/partner | ||||||||||||||
|---|---|---|---|---|---|---|---|---|---|---|---|---|---|---|
| Study | Injury criteria | Speed value | Frontal | Head-ona | Side | Rear end | Heavy vehicle (head-on) | Heavy vehicle (side) | Infrastructure | Narrow/fixed object | Large animal | Pedestrian | Cyclist | Motorcyclist |
| [b@460082] | “Very low risk of death or serious injury” | Impact speed | 60 | 40 | 30 | 30 | 40 | 30 | 60 | 0 | 20 | 40 | ||
| Speed limit | 80 | 60 | 110 | 50 | 40 | 100+ | 60 | 80 | 5-7 | 40 | 40 | |||
| [b@460073] | 10% MAIS3+ risk | Impact speed | 75 | 70 | 70 | |||||||||
| [b@460072] | 10% MAIS3+ risk | Impact speed | 56 | 29 | 44 | 48 | ||||||||
| Speed limit | 55 | 25 | 20-25 | 20-25 | ||||||||||
| [b@460055] | 1% MAIS3+ risk | Impact speed | 64 | 28 | 51 | 67 | ||||||||
| 10% MAIS3+ risk | Impact speed | 108 | 53 | 71 | 88 | |||||||||
| [b@460056] | 1% MAIS3+ risk | Travel speed | 81 | 17 | 58 | 96 | ||||||||
| 10% MAIS3+ risk | Travel speed | 149 | 92 | 92 | 155 | |||||||||
| [b@460060] | No serious injuries or fatalities | Impact speed | 60 | 55 | 20 | 80 | 30 | |||||||
| Speed limit | 80 | 70 | 40 | 110 | 40 | |||||||||
| [b@460089] | No tolerance | Travel speed | 70 | 50 | 100+ | 30 | ||||||||
| [b@460090] | 10% MAIS2+ risk + whiplash >1 month | Impact speed | 25 | 40 | 20 | 10 | 20 | 0 | 0 | 0 | ||||
| 10% MAIS3+ risk + whiplash >6 months | Impact speed | 50 | 60 | 40 | 25 | 30 | 20 | 20 | 30 | |||||
| Jurewicz et al., 2016 | 10% MAIS3+ risk | Impact speed | 30 | 30 | 55 | 20 | ||||||||
1.4. Study objective
The principal aim of this study was to present the framework for a Tolerance-based Assessment of Risk for Generalized Event Thresholds (TARGET) to support Vision Zero. This framework leverages state-of-the-art injury risk models with biomechanically-relevant predictor variables and modern collision data to enable increased precision. Thresholds for safe speeds at impact, which are representative of the current traffic population, were estimated through a generalized application of these objective injury risk functions for serious and fatal injuries to present kinematic-based thresholds reflective of biomechanical tolerance limits for several common collision crash configurations. As an additional demonstrative, this study examined the effect of increased age (and decreased injury tolerance) and different seating positions on these safe speed thresholds. The methods presented herein may be applied to other crash configurations or severity levels for TARGET setting. Given that most previous studies used expert judgment, small sample sizes, or outdated data, a secondary outcome of this paper was to compare the thresholds from this data-driven, biomechanically-centered approach to existing safe speed thresholds.
2. Methodology
2.1. Defining high severity
2.1.1. Serious and fatal injuries
Given that Vision Zero is focused on reducing and eliminating serious and fatal injuries, it is important to clearly define what a serious injury is. As an AIS score of 3 is considered “serious,” we will use MAIS3+ as our designation for serious or greater injuries. Most injury risk models are developed using similar designations of considering injuries at a given severity level or of higher severity, so the MAIS3+ designation appropriately captures serious and fatal injuries. It should be noted that the potential for long-term impairment/disability is still present for some AIS1 and AIS2 injuries (e.g., hand or foot amputations, concussion).
2.1.2. Setting a target
As outlined in the introduction, significant variability in biomechanical tolerance precludes a serious injury threshold set at 0%. Even in relatively lower injury risk crashes, where high severity injury outcomes are estimated as being unlikely, higher severity injury outcomes may still result. ISO 26262-3 sets severity levels at 10% risk of injury, with the S2 severity level associated with a 10% probability of injury at the MAIS3+ level. Other studies have also used 10% targets at various injury severity levels (Table 2). Accordingly, for the purposes of this study, all presented serious and fatal injury thresholds are based on a 10% probability of injury at the MAIS3+ severity level.
2.2. Considered collision configurations
Injury risk models have been developed to capture risk for a wide variety of reasonably foreseeable crash configurations and scenarios. The present study considers some of the most prevalent that have been investigated (Table 3). The methods outlined in this paper may be applied for other collision configurations in order to generate relevant thresholds. It should be noted that, while the risk assessments reasonably consider the injury potential to all involved collision partners and persons at risk, each collision is associated with an individual at highest risk. For example, while a vehicle occupant may be injured during a collision with a motorcyclist, the injury potential is generally higher for the motorcyclist.
| Heavy vehicle | Car | Pedestrian | Cyclist | Motorcyclist | |||||
|---|---|---|---|---|---|---|---|---|---|
| Front | Side | Rear | Front | Side | Rear | ||||
| Car | X | X | X | X | X | X | X | X | X |
2.3. Injury risk models
Unlike many previous endeavors which have sought to develop Vision Zero speed targets for specific collision configurations using restrictive data inclusion criteria (e.g., new model year vehicles only, belted occupants only) to generate simplified injury risk models, the present analysis, which considers similar collision configurations, leverages state-of-the-art, previously-published injury risk models that incorporate biomechanically-relevant predictors of injury risk. The rationale behind this decision is that it allows for a more representative, or accurate, assessment of injury risk that reflects the current state of the traffic population. For example, vehicle occupant seatbelt use is an orthogonal intervention of Vision Zero and the Safe Systems approach from speed. Although many past safe speed studies chose to model 100% seatbelt use, the reality is, at least in the U.S., that seat belt compliance is not universal and capturing the elevated risk of injury for this population is a valid consideration at this point in time. Further, the effect of age-associated decreases in injury tolerance and safe speed thresholds was evaluated by repeating the analysis for a 65-year-old person rather than a population-average age person. Lastly, an illustration of the protective effect of increased seatbelt compliance is presented in the results as part of a comparison to previous work in this area. In this study, all safe speed thresholds represent the speed at the time of impact associated with a 10% risk of injury at the MAIS3+ severity level.
2.3.1. Analytical assumptions
Injury risk models often include multiple, relevant predictor variables. For the purposes of this study, the injury risk models presented below were effectively reduced to being solely a function of a speed parameter through selection of default predictors and/or average risk considerations, generalizing the data sample while mitigating sampling biases associated with the predictors. This necessarily results in a population-weighted average risk estimate that may tend to under- or overestimate true injury potential for a specific event (Campolettano, Scanlon, Kadar, et al., 2024; McMurry et al., 2021). This approach is consistent with ISO 26262-3, which notes that “the severity classification is based on a representative sample of persons at risk (International Organization for Standardization (ISO 26262-3), 2018).” It is important to note, though, that having injury risk models which feature multiple biomechanically-relevant predictor variables is important for being able to address other research questions without having to modify inclusion criteria or developing a new injury risk model. Sections 2.3.2 through 2.3.5 highlight the specific injury risk model used in this study for assessing different collision partners.
For vehicle-to-vehicle collisions, nearly all injury risk models utilize vehicle delta-v, a measure of collision-induced vehicle speed change, as a primary predictor of injury risk. As delta-v is a consequence of the collision event, it captures relevant physical and collision-specific features (e.g., vehicle mass, vehicle deformation) that allow for comparison across different events and collision partners.
For simplicity of interpretation and comparison to existing work, the delta-v thresholds were estimated back to closing speed values using conservation of momentum by assuming (1) no vehicle restitution; (2) car-to-car collisions involved vehicles of the same mass; and (3) the mass mismatch between cars and heavy vehicles is sufficiently high that the passenger vehicle delta-v may be approximated by the closing speed. Detailed explanation is presented in the Appendix, but for car-to-car collisions, while for car-to-heavy vehicle collisions, Closing speed is the relative speed of the two agents leading up to the collision. For example, were vehicle A traveling at 40 kph and vehicle B traveling in the opposite direction at 60 kph to have a head-on collision, the closing speed would be 100 kph. Were the two vehicles traveling in the same direction such that a front-to-rear collision occurred, the closing speed would be 20 kph.
2.3.2. Vehicle occupants
McMurry et al. presented a novel injury risk model for vehicle occupants involved in planar collisions using data from NHTSA’s crash surveillance systems (National Automotive Sampling System/Crashworthiness Data System [NASS-CDS] and Crash Investigation Sampling System [CISS]) (McMurry et al., 2021). Rather than discretizing the collision forces into specific regions (e.g., frontal, side, rear), a single, omni-directional injury risk model was developed which featured a Fourier series term that allows for the effect of vehicle delta-v to vary by impact direction. Additional predictors included seatbelt usage, occupant sex, age, and seating position, vehicle model year, and an object struck categorical variable to differentiate between striking passenger vehicles, large vehicles, and fixed objects. For application of the risk model in this study, the involved vehicle was considered to be a model year 2012 passenger car (reflecting the approximately 12 year average age of the vehicle fleet [BTS]) with a single occupant in the driver seat. Default predictors for age, sex, and belt use were selected, as reported in McMurry et al., 2021 to approximately reproduce population-average risk. These parameters are presented in the Appendix.
To allow for more direct comparison of vehicle-to-vehicle collision thresholds to other studies, average risk across collision principal direction of force (PDOF) associated with specific collision configurations was carried out as follows: Frontal (11, 12, 1 o’clock), Near Side (8, 9, 10 o’clock), and Rear (5, 6, 7 o’clock). Only near side collisions were considered as they represent the higher risk potential configuration. Within CISS, PDOF is measured in degrees, in increments of 10 degrees (e.g., frontal impacts range from -40 degrees to +40 degrees). Average risk was computed by calculating point estimate risks at each of the discrete PDOF increments and taking the arithmetic mean.
2.3.3. Pedestrians
Leveraging data from the German In-Depth Accident Study (GIDAS), Schubert et al. presented biomechanically-relevant injury risk models for pedestrians involved in collisions with passenger vehicles (Schubert et al., 2023). While vehicle speed at impact is commonly used as a predictor variable in pedestrian injury risk models, the authors opted for a more complete speed variable that considered the maximum of vehicle speed and relative speed in the assessment of injury risk. Additional predictors included pedestrian sex and age, pedestrian height relative to the vehicle front bumper (a term intended to capture wrap vs. forward projections), and a categorical variable indicating whether the vehicle was decelerating at the time of the collision (Table 4). Age was modeled continuously using a cubic spline (with two terms that define the spline) that allowed for capturing the biomechanical effect of young adults exhibiting greater injury tolerance compared to both younger children and older adults.
| Coefficient estimate | Average value | |
|---|---|---|
| Intercept | -1.705 | N/A |
| Impact speed | 0.066 | N/A |
| Sex (female = 1) | 0.022 | 0.52 |
| Height relative to bumper | -4.989 | 0.7 |
| Age | Spline 1: 0.884 Spline 2: 0.597 |
33 |
| Vehicle deceleration | -0.108 | 0.506 |
These default predictors were aggregated along with the base model’s intercept coefficient to compute the intercept for a logistic model solely using impact speed (measured in kph) as a predictor:
2.3.4. Cyclists
Similarly, Schubert et al. developed cyclist injury risk models using GIDAS data (Schubert et al., 2024). This model built on previous work by considering all collision configurations and developing a speed parameter, Effective Collision Speed, that explicitly captures the effect of decreased engagement in non-frontal contacts through use of a frictional parameter which applies to vehicle speed for these contacts (Schubert et al., 2024). The speed parameter considers the maximum of vehicle speed, relative speed, and cyclist speed in the risk assessment. Additional biomechanically-relevant predictors included cyclist age (modeled using a spline as discussed above) and sex and a categorical variable indicating whether the collision would be likely to result in a normal projection away from the vehicle based on the geometry of the engagement and the involved vehicle (Table 5).
| Coefficient estimate | Average value | |
|---|---|---|
| Intercept | -5.730 | N/A |
| Effective collision speed | 0.063 | N/A |
| Sex (female = 1) | -0.018 | 0.42 |
| Age | Spline 1: -0.147 Spline 2: 0.364 |
36 |
| Normal projection | 0.266 | 0.185 |
These default predictors were aggregated along with the base model’s intercept coefficient to compute the intercept for a logistic model solely using impact speed (measured in kph) as a predictor:
2.3.5. Motorcyclists
Lubbe et al. (2022) presented motorcyclist injury risk curves using GIDAS data. This model was developed for frontal collisions and considered closing speed and motorcyclist age. For the current study, the closing speed variable was adapted to the maximum of vehicle speed, closing speed, and motorcyclist speed. The median age for motorcyclists in the dataset (37 years old) was used as a default predictor for motorcyclist age to simplify evaluation of injury risk to only be dependent on a single measure of collision speed (measured in kph). As applied in this study, the resulting injury risk curve based on Lubbe et al. (2022) is as follows:
The consolidation of the motorcyclist injury risk model coefficients into the model form in the above equation is presented in the Appendix by way of example for the interested reader.
3. Results
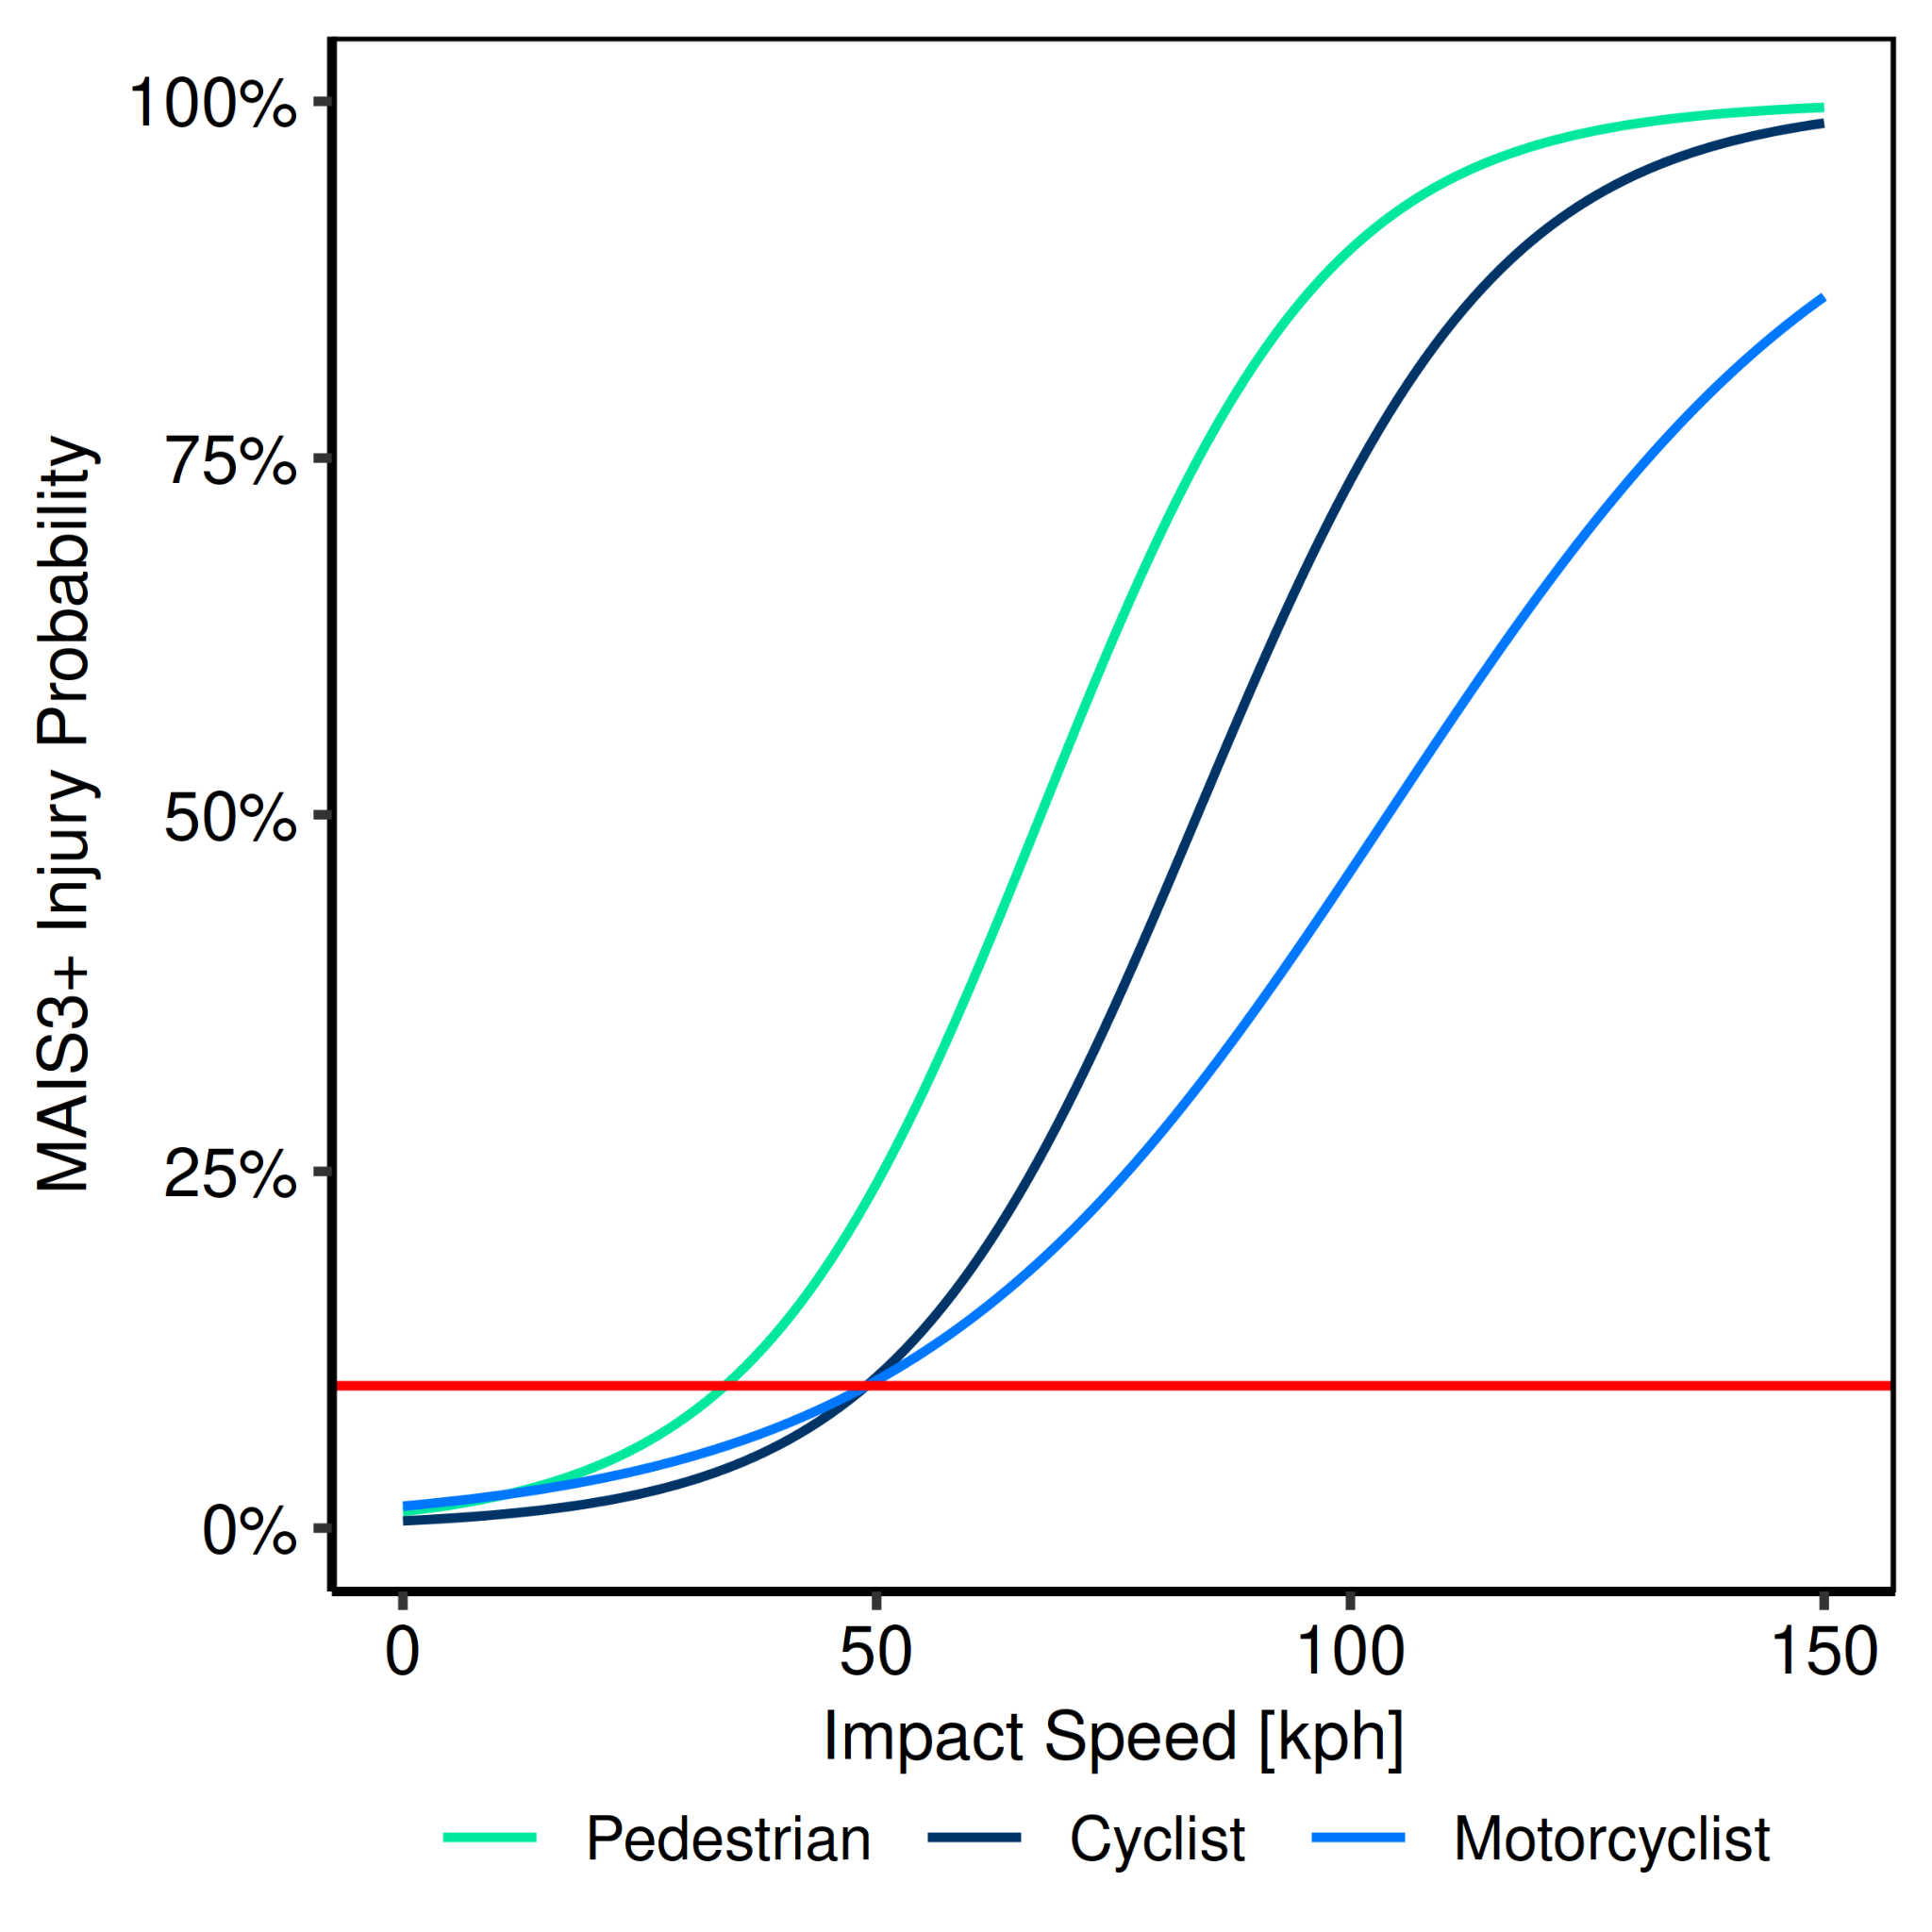
The impact speed thresholds (Figure 1) for VRUs (pedestrians, cyclists, and motorcyclists) consider both vehicle speed and closing speed. In the case of cyclists and motorcyclists, their speed was considered as a factor as well (i.e., the speed threshold of 49 kph for cyclists/motorcyclists represents the maximum tolerable travel speed for a vehicle striking a cyclist/motorcyclist, the relative speed between the two in a collision, or the travel speed of the cyclist/motorcyclist). These reflect the potential for injury during initial engagement with the vehicle as a result of a collision event, as well as the potential for injury during potential engagement with the ground or surrounding roadway environment subsequent to initial impact.
As noted in the methods, established injury risk models for vehicle occupants rely on vehicle delta-v, not vehicle speeds, as a predictor variable. Given the underlying analytical assumptions employed as part of this study, the absolute speed thresholds for vehicle occupants presented in Table 6 were obtained by doubling the vehicle delta-v for car-car collisions and taking delta-v as impact speed for collisions involving heavy vehicles (Figure 2).
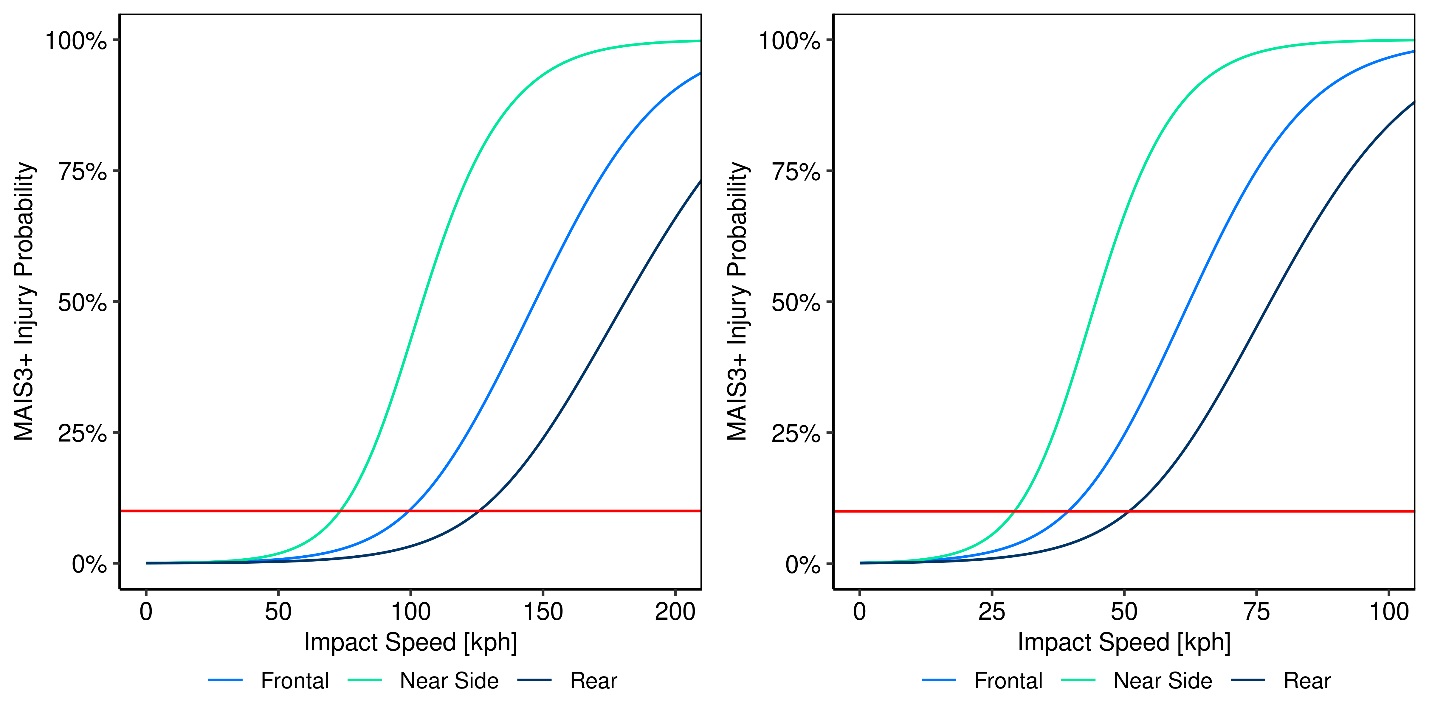
Leveraging the risk curves presented above, generalized event thresholds based on impact speed were presented (Table 6). These thresholds are associated with an estimated 10% risk of injury at the MAIS3+ severity level, reflective of serious and greater injuries (including fatalities). These values are speeds at the time of impact and are not roadway speed limits. For example, the frontal car-to-car threshold of 99 kph (62 mph) represents the total closing speed of the collision; in other words, two vehicles traveling in the opposite direction at 50 kph or one vehicle traveling at 99 kph into the front of a stopped vehicle would both be equivalent for the purposes of this evaluation. The thresholds further reflect the person who would be at highest risk in the given collision (e.g., for a collision involving a car and a heavy vehicle, the presented speed threshold is for the occupant in the car; similarly, for a collision involving a cyclist and the front of a car, the speed threshold corresponds to injury risk for the cyclist). There are notable decreases in safe speed thresholds when the injured party is modeled as a 65-year-old person, highlighting the heightened vulnerability of older persons to serious and fatal injuries in lower severity impacts (Table 6).
| Heavy vehicle | Car | Pedestrian | Cyclist | Motorcyclist | ||||||
|---|---|---|---|---|---|---|---|---|---|---|
| Front | Side | Rear | Front | Side | Rear | |||||
| Car (population-average age) |
39 (24) |
29 (18) |
51 (32) |
99 (62) |
73 (45) |
126 (78) |
34 (21) |
49 (30) |
49 (30) |
|
| Car (65 years old) |
29 (18) |
22 (14) |
39 (24) |
80 (50) |
59 (37) |
103 (64) |
18 (11) |
29 (18) |
41 (25) |
|
For vehicle occupants, all of the existing work in establishing Vision Zero thresholds has assumed 100% seat belt use. Some studies have even made considerations for only including the newest vehicles or an assumed level of vehicle capability. To allow for direct comparison to that work and to better elucidate the effects of lower levels of protection associated with the current driving environment of the United States, closing speed thresholds for vehicle-to-vehicle collisions were developed in the same manner as presented above, assuming 100% seat belt use and a 2024 model year vehicle (Table 7). Comparing the speed thresholds in Table 6 and 7, there is, intuitively, a protective effect of modeling these factors. As seating position is a known risk factor in collisions and many of these previous studies did not address the specific seating position of the occupants, it is also important to highlight that being a passenger, rather than a driver, is associated with increased risk of injury and thus lower safe impact speed thresholds (Table 7).
| Struck by heavy vehicle | Struck by car | |||||
|---|---|---|---|---|---|---|
| Front | Side | Rear | Front | Side | Rear | |
| Driver | 47 (29) |
35 (22) |
60 (37) |
115 (71) |
85 (53) |
145 (90) |
| Front seat passenger | 44 (27) |
33 (21) |
57 (35) |
109 (68) |
81 (50) |
138 (86) |
| Rear seat passenger | 44 (27) |
32 (20) |
56 (35) |
108 (67) |
80 (50) |
136 (84) |
4. Discussion
4.1. Safe System considerations
The speed thresholds at impact presented in Table 6 reflect biomechanical tolerances to loading given current vehicle safety features and can be viewed as collision conditions that should not be exceeded. These thresholds are associated with a 10% risk of injury at the MAIS3+ severity level. As such, serious or fatal injury cannot be ruled out in collisions with speeds below these thresholds, nor is serious or fatal injury necessarily expected in collisions which exceed these thresholds. Biomechanical tolerance to impact loading, specifically in the automotive realm, is well-defined, having been the subject of research interest over the last 70 years [Nahum & Melvin, 2002; Yoganandan et al., 2015]. These biomechanically-based collision thresholds accordingly represent the state-of-the-art on the extent of vehicle collisions tolerable to a 10% average risk of serious or greater injury. It must be noted that these are impact speeds and not travel speeds or speed limits. As evidenced in Table 2, impact speed thresholds are necessarily lower than proposed roadway speed limits or travel speeds, as the capacity for pre-collision braking (driver-initiated or AEB) can reduce the available energy at impact. As part of a broader Safe System, these thresholds reflect the vulnerability of humans to impact loading and provide targets for other approaches to mitigate poor health outcomes (e.g., roadway design, active and passive safety features, speed limits).
While the setting of roadway speed limits represents the interplay of the various aspects of the Safe System, this study focused on the limits of biomechanical tolerance for framing how speed limits may be defined. At the national level, the Federal Highway Administration’s most recent version of the speed limit setting handbook prioritizes safe speeds over vehicle throughput, stating that “safe and appropriate speed limits are safe for all road users (Schroeder et al., 2025).” Notably, many cities around the world have lowered the speed limits in urban areas to 30 kph or 20 mph given the heightened exposure to vulnerable road users within these areas, consistent with the results of this study, as well as previous work. A meta-analysis investigating the effect of these urban speed limit reductions in 40 European cities reported that, on average, collisions were reduced by 23%, fatalities by 37%, and injuries by 38% (Yannis & Michelaraki, 2024).
The present study, as well as much of the previous work in this area, used the best practice of 10% risk of injury at the MAIS3+ severity level as the basis for safe speed thresholds. While this paper does not address whether this represents an acceptable level of risk, discussion of the effect of increased speed on injury risk is warranted. According to the most recent information from 2022 from the American Automobile Association (AAA) as part of their annual Traffic Safety Culture Index survey, nearly half of respondents reported driving more than 15 mph over the speed limit on a freeway within the last 30 days, and approximately 35% reported driving more than 10 mph over the speed limit on a residential street within the last 30 days (AAA, 2023). To illustrate the effect on injury risk, consider a head-on collision between two passenger vehicles on a two-way, undivided residential street with a speed limit of 30 mph (48 kph). With both vehicles traveling at the speed limit, the MAIS3+ risk associated with this collision is 9%. If one of these vehicles is traveling 10 mph (16 kph) over the speed limit, the closing speed has increased by 17% but risk has more than doubled, up to 18%. If both vehicles were traveling 10 mph (16 kph) over the speed limit at the time of collision, the 33% increase in closing speed results in a nearly four-fold increase in risk relative to the baseline collision, 32% risk of injury at the MAIS3+ severity level. As shown in Figures 1 and 2, the 10% threshold is in the steep portion of the risk curves, where small changes in speed can result in larger differences in injury risk potential, as demonstrated by the above example. For 2022, NHTSA reported that speeding was a contributing factor in approximately 28% of fatal crashes, resulting in over 12,000 fatalities for the year, with an additional 300,000 people injured [NHTSA, 2024b]. Taken together, it is clear that compliance with roadway speed limits, which serves to reduce the total energy available in the event a collision occurs, represents a key way to contribute to a Safe System and mitigate the potential for serious and fatal injury outcomes. Further, there is the additional benefit that speed reduction is also associated with decreased risk of being in a collision at all (Elvik, 2013; Elvik et al., 2019).
4.2. Comparison to other studies
For vulnerable road users (pedestrians, cyclists, and motorcyclists), the thresholds presented in Table 6 are very similar, or equivalent in the case of motorcyclists, to those presented by Lubbe et al., 2022. The underlying risk curves leverage the GIDAS database, and differences may reasonably be attributed to differences in case years from the GIDAS dataset, the effect of weighting, the inclusion of additional predictors, and slight differences in inclusion criteria.
The threshold for collisions involving pedestrians of 34 kph (21 mph) presented in Table 6 is consistent with but slightly higher than original consensus estimates of 30 kph (Eugensson et al., 2011; Tingvall & Haworth, 1999). The lower thresholds (20 kph) for pedestrians presented elsewhere can be attributed to older datasets, which may not be reflective of the current vehicle fleet [Jurewicz et al., 2016; Truong et al., 2022]. It should also be noted that pedestrians may fall to the ground, even at lower speeds, and these falls have the potential to result in serious injuries (Campolettano, Scanlon, & Kusano, 2024; Guillaume et al., 2015; Hussain et al., 2019).
For cyclists, the speed threshold of 49 kph (30 mph) found in the current study is slightly higher than that presented by Lubbe et al., 2022. This difference is expected as discussed above, as well as the fact that Schubert et al., 2024 included all collision configurations. These minor differences in methodology resulted in an injury risk function that predicts slightly reduced overall risk in comparison to Lubbe et al., 2022, leading to higher safe speed thresholds. The 20 kph thresholds presented elsewhere are not grounded in a holistic, data-driven evaluation of overall risk, pulling from field data from pedestrian collisions and/or focusing on mitigating head injury (Rizzi et al., 2023; Truong et al., 2022).
For motorcyclists, the speed threshold of 49 kph (30 mph) is higher than those presented by Rizzi et al., 2023 and Truong et al., 2022. These studies leveraged an injury risk model developed by Ding et al., 2019, which used data from GIDAS, though the authors included collisions with other objects (e.g., fixed objects, roadway environment) and not simply cars; this would tend to result in higher injury potential at lower speeds (Lubbe et al., 2022).
For vehicle occupants, there are some more notable discrepancies between existing work and the comparable thresholds established in this study (Table 7). The frontal collision speed threshold of 115 kph (71 mph) is similar to the 102 kph (63 mph) threshold presented by Doecke et al., 2020. Given that both used U.S. crash data, albeit with a different severity component (reconstructed vehicle delta-v in this study compared to impact speed from the vehicle event data recorder in Doecke et al., 2020), this consistency is anticipated. Further, the frontal threshold may reasonably be compared to head-on collision thresholds by reducing it by half (57 kph). At 10% risk of injury at the MAIS3+ severity level, previous impact speed thresholds largely range from 50-65 kph (Table 2). This represents the speed at which each vehicle may be traveling at impact, i.e., closing speed between 100 and 130 kph.
The side impact threshold of 85 kph (53 mph) is higher than the range of 50-70 kph from previously-published studies. This threshold in the current study represents risk in a near-side collision. The side impact configuration (near- or far-side) was not specified in all of the cited studies in Table 2, which inhibits a direct comparison. Further, the use of the most modern data from the United States in the present study may also explain some of these differences. In general, these side impact thresholds are lower than for other vehicle crash directions given the physical design of vehicles, for which occupants are least protected in side impacts. For additional context, both EuroNCAP and IIHS conduct movable deformable barrier side impact testing at impact speeds of 60 kph (European New Car Assessment Programme (Euro NCAP), 2024; IIHS, n.d.).
The greatest discrepancy between previous research and the present study is for the speed threshold associated with 10% MAIS3+ injury severity for rear collisions (Tables 2 and 7). Most other works consider the risk of whiplash-associated injuries, a lower severity injury than the MAIS3+ level, which would tend to bring the speed thresholds down considerably. As outlined in the methods, given this study’s objective definition of serious injury as being at the MAIS3+ severity level, whiplash-associated injuries (MAIS1) are necessarily not included in the present study (AAAM, 2016). Compared to the only other strict MAIS3+ risk assessment (Doecke et al., 2020), the threshold presented here is still markedly higher; given differences in primary injury predictor parameters and a paucity of injury data for the rear-end configuration, these differences are not surprising. Of note, Doecke et al., 2020 reported higher risk across the speed domain for rear collisions compared to frontal collisions, whereas this study and others shows the opposite (Figure 2) (Bahouth et al., 2014; McMurry et al., 2021; Viano & Parenteau, 2022).
For collisions with heavy vehicles, given the large mass mismatch, the lower impact speed thresholds are intuitive (Table 7). The values presented in this study are between previously-published thresholds in the case of side collisions and above the head-on thresholds (Table 2). The vehicle occupant injury risk model used in this study was built using data from CISS, which samples from police-reported tow-away collisions in the U.S. By comparison, GIDAS samples from police-reported collisions with suspected injury. Accordingly, risk estimates developed using the CISS dataset would tend to be lower than would be obtained using GIDAS data; this lower estimate is more representative of true injury risk by better reflecting injury tolerance through the inclusion of injured and uninjured persons. Further, the data-driven approach, along with the inclusion of heavy vehicles as a colliding partner (and predictor in the injury risk model), can reasonably explain differences as well.
It can also be useful to consider the thresholds presented in this study in the context of vehicle crashworthiness standards testing. Various consumer ratings programs (e.g., NCAPs and IIHS) perform various frontal and side tests at speeds in the range of 32 kph to 64 kph (20 mph to 40 mph), which assess crash performance in impacts with narrow, fixed objects, other vehicles, and rigid barriers. These tests require that biomechanical thresholds for different injury criteria not be exceeded, with varying probabilities of injury associated with these injury criteria. Utilizing the injury risk curves that are used to calculate vehicle star ratings as part of U.S. NCAP, at the injury criteria thresholds, risk of injury ranges from 11% to 51% depending on the body region considered (Eppinger et al., 1999); NCAP]. All criteria are at the AIS3+ level, with the exception of femur loading, which is at the AIS2+ level. Given that the most severe lower extremity injuries are associated with AIS2 or AIS3 scores, this makes sense (AAAM, 2016). Of note, Euro NCAP features more stringent injury criteria for high performance ratings, which would necessarily be associated with lower levels of predicted injury risk (European New Car Assessment Programme (Euro NCAP), 2024)
A recent analysis using U.S. data investigated safe speed thresholds using a severity reference point of 50% moderate injury risk (MAIS2+F), reporting impact speed thresholds for head-on collisions of 62 kph for occupants older than 65 years old and 82 kph for occupants younger than 65 years old (Dean et al., 2023). They also reported delta-v based thresholds of 40 kph for those above 65 years of age and 65 kph for those younger than 65 years old. While the impact speed thresholds are lower than that of the present study, mapping the impact speeds from Table 6 and Table 7 to delta-v values result in estimates of 40 kph for occupants at 65 years old, 50 kph for the population average, and 58 kph for the population average in the Safe System (most comparable to Dean et al.'s population). Given differences in methodology and the differing injury severity definitions, these results are in line with expectation.
In general, the closing speed thresholds associated with 10% risk of injury at the MAIS3+ severity level for the various collision configurations presented in this study (Figures 1 and 2) are consistent with previous work in this area (Table 2) and can be considered a validation of these previous investigations. Notable differences in injury severity definition, data sources, and crash data year range likely explain some of the discrepancies, as highlighted above. Specifically, previous efforts have primarily relied on expert judgment and/or collision data from Europe, so it is noteworthy that the thresholds in this study for vehicle occupants using data from the U.S. are so similar. The data-driven approach used in this study, including the use of injury risk models with additional biomechanically-relevant predictors and the most modern collision data, represents a principled approach to quantifying generalized thresholds of biomechanical tolerance for humans involved in automotive collisions.
4.3. Injury risk model considerations
Injury risk models are usually developed from sampling systems (e.g., CISS or GIDAS) which have criteria that are biased toward higher severity events. This issue is often less of a concern at the MAIS3+ severity level, as crashes at this severity level, unlike less severe crashes, are more likely to meet inclusion criteria for these databases. An additional source of potential bias is that logistic regression is the most commonly used model form for these injury risk functions, and it predicts non-zero injury risk at zero speed. Efforts to mathematically and biomechanically align these risk curves to limit the overestimation of low-end risk through use of different models (e.g., weibull or log-normal models, survival analysis) may be warranted depending on the research objectives (Kent & Funk, 2004; Yoganandan et al., 2016). Further, techniques aimed at re-weighting the sample to avoid undersampling non-injury and/or non-tow-away crashes may also be useful to provide more accurate estimates for low-end risk (Andricevic et al., 2018; Bärgman et al., 2024; Lubbe et al., 2024).
It is also important to recognize that injury data from field collision data (as well as a large portion of the specific body region injury tolerance data from biomechanical research) represents censored data. For injured persons (left-censored data), there is no way of telling how much less severe the collision could have been and still resulted in the same injury severity. Similarly, for uninjured persons (right-censored data), there is no way to know how much more severe the collision could have been and still resulted in no injuries. This factor, coupled with biomechanical variance that at a given collision speed, some persons will be injured and others uninjured, manifests itself in the form of variance in the injury risk models, and does not necessarily bias the model outputs (and this study’s results) toward under- or over-estimation of injury risk.
4.4. Other applications
This study presented a framework for TARGET speed setting, with a specific application toward Vision Zero (i.e., mitigating serious and fatal injuries). The injury risk models used in this study, which were simplified for comparison to existing research, feature several biomechanically-relevant factors that may be deliberately selected or varied across a number of research questions beyond those considered in this study. This risk-based approach may also be reasonably applied to other crash configurations provided there is sufficient data. For example, considering what impact speeds for impacts with roadway infrastructure, such as guardrails or end terminals, may result in serious or worse injuries may be an essential part of the design and evaluation process. As exemplified here, development and application of an injury risk model necessitate consideration of relevant biomechanical factors. This may result in needing to adapt inclusion criteria or previously-developed risk models to ensure that the application is valid. While this framework is predicated on generalized whole body injury risk models, body region models may also be leveraged to assess tolerance limits and injury risk in specific scenarios (Brumbelow, 2020; Pipkorn et al., 2019).
Further, the thresholds presented in this study are generalized for a representative assessment of serious and fatal injury risk. These reflect population-average or median risk, but the methodology is adaptable for a variety of use cases that may rely on different default predictors. As shown in Table 6, there are variations in appropriate safe speeds at impact dependent on whether an occupant is the driver or a passenger. For example, considering risk for rear-seat vehicle occupants rather than vehicle drivers may be warranted for assessing injury risk for ride hailing services. This may also be associated with modeling a different level of seatbelt compliance to reflect that rear-seated occupants are less likely than front-seated occupants to don a seatbelt (Boyle, 2023). This study also highlighted the increased vulnerability of an aging population (i.e., modeling injury risk for a 65-year-old) and reported markedly lower serious and fatal injury TARGETs for this population relative to the average (Table 7). This is particularly salient for thinking about promoting safety and equity for all those in the transportation network as well as considerations surrounding the effect of an aging population. These example analyses highlight the importance of having robust injury risk models that appropriately capture the biomechanical factors related to injury risk in order for researchers to be able to leverage these models to address other questions of interest.
Other studies have considered other aspects of the Safe System Approach by including the potential for AEB to mitigate travel speeds prior to impact (Lubbe et al., 2024; Rizzi et al., 2023). As autonomous capabilities in vehicles continue to develop in coming years, it is important to capture these effects. In the same vein, the evaluation of Automated Driving Systems (ADS) can leverage a comprehensive risk-based framework for assessing safety performance for simulated events prior to widespread deployment (Favaro et al., 2023). By ensuring sufficient coverage of and performance in a variety of reasonably-foreseeable crash configurations, the safety readiness of an ADS fleet for avoiding and/or mitigating collisions predicted to result in serious or fatal injury outcomes may be evaluated.
4.5. Limitations
This study presented generalized biomechanical injury tolerance thresholds. Accordingly, these may not reflect the true level of injury potential for a specific individual experiencing a collision at these speeds. For instance, biomechanical tolerance is known to vary by sex and age. The thresholds presented here do not reflect the specific risk for elderly pedestrians, for whom the serious injury speed threshold would certainly be lower. Care should be applied when considering these thresholds for other applications, though the injury risk models do allow for application to other research questions as outlined above. Additionally, there are limitations associated with the injury risk models themselves, from data sampling issues (bias in included cases toward higher severity events) to the large number of years included in the models that may not necessarily reflect the current state of injury risk (e.g., changes in vehicle fleet, safety performance, etc.). This study also utilized simplifying assumptions for evaluating crash configurations that may not directly translate to the real world. Specifically, the assumptions regarding impact speeds with heavy vehicles are extensions of the passenger vehicle reconstructions and may not fully capture the different engagements observed in those collision events. It is also important to note that this study did not consider the effect of pre-collision vehicle maneuvers or AEB on pre-collision travel speeds but instead focused on impacts speeds and the biomechanical tolerance of humans in the traffic system. Efforts to operationalize the thresholds presented in this study (e.g., speed limit setting) should consider these effects as well. Lastly, this study considered serious injuries as only those at the MAIS3 severity level or higher, consistent with past studies that estimated safe speeds. The potential for long-term impairment, which is included in Vision Zero aspirations, does exist for injuries below this severity level, and this is not captured in the current study.
5. Conclusion
Using a data-driven approach with state-of-the-art injury risk models built on the most modern collision data and featuring biomechanically-relevant predictors, this study improved precision in safe impact speed threshold estimation, and the TARGET values presented in this study are consistent with what has been published previously when applying the framework to answer the same research question as those studies. This approach, which considers generalized biomechanical tolerance, may reasonably be applied for other injury severity levels or risk of injury thresholds, as exemplified by modeling the effect of increased age and seating position on safe speed thresholds. Given the relationships between speed and injury risk, reducing speed in a collision below these thresholds is key to mitigating serious and fatal injury outcomes. The objective injury risk approach used in this study enables traffic safety practitioners to determine the relative effect of related safety countermeasures on reaching the goals of Vision Zero and a Safe System Approach. For example, this study showed that achieving 100% seatbelt compliance could justify higher travel speeds on roads.
CRediT contribution
Eamon T. Campolettano: Conceptualization, Formal analysis, Methodology, Visualization, Writing—original draft. John M. Scanlon: Methodology, Writing—review & editing. Timothy L. McMurry: Methodology, Validation, Writing—review & editing. Kristofer D. Kusano: Conceptualization, Methodology, Supervision, Writing—review & editing. Trent Victor: Supervision, Writing—review & editing.
Declaration of competing interests
The authors report no competing interests.
Declaration of generative AI use in writing
The authors declare that no generative AI was used in this work.
Ethics statement
Study is data analysis-based, so no ethical evaluation was required for this work.
Funding
No external funding was used in this research.
Editorial information
Handling editor: Aliaksei Laureshyn, Lund University, Sweden
Reviewers: Nils Lübbe, Autoliv, Sweden; Alfonso Montella, University of Naples Federico II, Italy
APPENDIX
Collision Model Assumptions
The simplified collision model used to establish the relationship between vehicle delta-v and collision closing speed for use in the injury risk models and setting of safe speed thresholds is presented below. Consider a two-vehicle collision, in which vehicle 1 represents the striking vehicle and vehicle 2 the struck vehicle. For car-to-car collisions, we assume that the masses of the two vehicles are equivalent:
From conservation of momentum and assuming a perfectly inelastic collision, we get the following expression:
Other speed terms can also be defined as follows:
Substituting these equations into the conservation of momentum equation and simplifying the masses yields
This reduces algebraically to
A similar exercise may be carried out for collisions involving a car and a heavy vehicle, where the mass of the heavy vehicle is much larger than the mass of the car, such that the final velocity of both vehicles is the initial velocity of the heavy vehicle.
In other words, the heavy vehicle can be treated as not experiencing a change in speed as a result of the collision. Plugging these into the conservation of momentum equation yields
Further simplification results in
Vehicle Occupant Injury Risk Model Parameters
The injury risk model for vehicle occupants leverages the complete case parameters presented in McMurry et al., 2021. Those parameters, as well as the default predictors, are included in Tables A1 and A2 and yield the thresholds as presented in Figure 2 and Table 6. For the Vision Zero comparison presented in Table 7 (i.e., 2024 model year vehicle and 100% seatbelt use), the average values in Table A2 for those parameters would necessarily change from 2012 (2) to 2024 (14) and from 0.17 to 0.
| Coefficient estimate | |
|---|---|
| Intercept | -9.995 |
| Δv | 0.117 |
| cos(PDOF) | 0.264 |
| sin(PDOF) | -0.249 |
| cos(2*PDOF) | 0.053 |
| sin(2*PDOF) | 0.298 |
| cos(PDOF)*Δv | 0.008 |
| sin(PDOF)*Δv | -0.010 |
| cos(2*PDOF)*Δv | -0.033 |
| sin(2*PDOF)*Δv | -0.009 |
| Coefficient estimate | Average value (car-to-car) |
Average value (car-to-heavy vehicle) |
|
|---|---|---|---|
| Object struck | Car: 0 Heavy vehicle: 1.135 |
Use car coefficient | Use heavy vehicle coefficient |
| Seatbelt use (Unbelted = 1) | 1.579 | 0.17 | 0.17 |
| Seating row (Rear = 1) | 0.091 | 0 | 0 |
| Occupant role (Passenger = 1) | 0.331 | 0 | 0 |
| Sex (Female = 1) | 0.257 | 0.54 | 0.54 |
| Age | 0.047 | 42 | 42 |
| Vehicle model year (relative to 2010) | -0.052 | 2012 (2) | 2012 (2) |
Injury Risk Model Form – Motorcyclist Model Example
The final model form presented in the manuscript was The intercept in the base model from Lubbe et al., 2022 was -4.555, with an age coefficient of 0.11, and a closing speed coefficient of 0.040. Using the average age of 37 years old, we can simplify the model as follows.