Road Safety Culture and the Safe System: Comparing Beliefs and Behaviours in African and European Countries
Abstract
The study compares national road safety culture (RSC) in three European countries—Norway, Sweden, and the Netherlands—which are widely recognized as leaders in Safe System implementation and have maintained the world’s best road safety records for several years, with three African countries with poorer road safety records—Ghana, Tanzania, Zambia. The primary focus is on continental-level comparisons, to identify the elements of RSC where we see the biggest differences between the African and the European countries. The study is based on survey data collected from car drivers and pedestrians (n = 3772), interviews (n = 46) and fieldwork. The study is explorative, as it examines four different RSC elements. This is important, as there are few other studies comparing RSC across African and European countries, including several transport modes. The elements of RSC where we see the biggest differences between the African and the European countries are: (a) fatalistic beliefs about road safety and (b) the social valuation of walking as a mode of transport, compared with motorized transport. The fatalistic beliefs are related to road safety violations, which in turn are related to accident involvement. Thus, influencing fatalistic beliefs regarding road safety, and increasing the cultural valuation of walking and pedestrians are likely to improve road safety in the African countries. Finally, interviewees in the African countries pointed to corruption as a potential factor impeding the efficiency of enforcement. We have not measured this, but future studies of RSC should also include beliefs and practices related to corruption, as these are likely to be related to the level of road violations.
1. Introduction
1.1. Background
According to WHO estimates, 1.19 million deaths occur in traffic each year (WHO, 2023). Low- and middle-income countries are disproportionately affected by global road safety challenges, accounting for 92% of traffic fatalities—a figure starkly misaligned with their share of the global population and vehicle fleet (WHO, 2023). Traffic fatality rate (per population) in Africa is the highest among all world regions and is 3 times higher than in Europe (4 times in comparison to EU-countries). There has been a constant growth in African traffic fatalities, and the number is expected to increase by another 68% over the next decade if nothing is done.
Comparing road safety violations between the European and the African context, WHO (2016) states that although few African countries collect road safety behaviour indicators, existing data indicate that road safety violations differ substantially, with a very high risk tolerance among road users in some African countries. This is based on e.g. very low seat belt use (e.g. as low as 18%), low helmet use for drivers (e.g. as low as 15%) and a high share of road traffic deaths attributable to alcohol impairment (e.g. as much as 60%) (WHO, 2016).
In recent years, the concept of safety culture has been applied to road safety, and it has been suggested that differences in national road safety culture (RSC) can contribute to explaining differences in road safety records and in road safety behaviours between countries (Ward et al, 2019; Nævestad et al., 2019; Van den Berghe et al., 2020). RSC can generally be understood as aspects of culture with relevance for traffic safety. RSC can more specifically be defined as shared values, attitudes and beliefs, shared norms prescribing certain road safety behaviours, and shared expectations regarding the behaviours of others (Nævestad, 2021). RSC provides frames of reference that guide individuals’ interpretations of actions, hazards, and their identities. This motivates and legitimizes behaviours that have an impact on safety (Nævestad, 2021). Thus, RSC are related to shared patterns of behaviour. RSC is created through interaction within groups.
There are, however, few studies of national RSC, and there is a need to develop and test (different) conceptualizations and mechanisms to explain the relationship between RSC, road safety violations and accident involvement. Several types of shared beliefs, norms, values attitudes and expectations may be important for road safety, when comparing across European and African countries. Thus, conducting studies of RSC is a sort of “detective task” looking for and testing the significance of different cultural elements that are important for road safety. In this study, we have identified four such elements based on previous research and qualitative research. These are: 1) Descriptive norms (the behaviour we expect from other road users in our country) (Nævestad et al., 2019), 2) Values and attitudes related to the freedom to take risk (Elvebakk, 2015; Nævestad, 2021), 3) Fatalistic beliefs, which refer to a tendency to view life events as predetermined and inevitable. If your fate is predestined, what you do in traffic (including risk taking) will not make a difference (Boua et al., 2024; Kouabenan, 1998), 4) Valuation of motorized transport over walking.
Some previous studies also examine relationships between RSC, road safety violations and accidents. Nævestad et al (2019) find that different national RSCs are related to drivers’ road safety violations, which in turn are related to accident involvement. Van der Berghe (2020) find a strong correlation between national culture and road safety performance, which exists even after controlling for the national level of wealth as measured by the gross national income.
Previous research find that national RSC seem to be influenced by underlying factors such as interactions between road users, infrastructure, education, enforcement, economy, the composition of road users (Nævestad et al., 2019). Several such underlying factors differ greatly between the European and the African countries included in this study, e.g. road infrastructure (Benton et al., 2023), different types of road users and higher risk tolerance in the African context, as indicated by the WHO (2016) study. Thus, the two continental contexts seem suitable for a comparison of RSC.
In the present study, we therefore compare RSC in three European countries (Norway, Sweden, Netherlands), and three African countries (Ghana, Tanzania, Zambia). The three African and the three European countries were chosen for the study because of different levels of Safe System implementation. The three European countries are top performers in road safety and the first countries in the world to implement the Safe System approach. In Norway, Sweden and the Netherlands, the Safe System approach was introduced in the road systems around 2000, when Vision Zero and Sustainable safety were introduced. These countries provide examples of the Safe System approach, which means to establish road safety management systems aiming to reduce road fatalities and serious injuries through a road system design that accommodates human errors and injury tolerances. The three African countries were chosen for the study, as they have not implemented Safe System, as they have poorer safety records than the European countries, and as they are placed in different areas of the African continent, south of Sahara. Thus, they span different sub-Saharan regions, helping to avoid regional bias and lending broader generalizability within the African context.
Comparing numbers of road fatalities per million capita in 2021, as estimated by the WHO (2024) the numbers in Norway, Sweden and the Netherlands were 15, 21 and 34 killed per million inhabitants, while the numbers in Ghana, Zambia and Tanzania are 259, 171 and 158 killed per million inhabitants.[1] Thus, the fatal road accident rate per capita is on average 8.4 times higher in the three African countries than in the three European countries. We want to discuss to what extent the concept of RSC can be used to shed light on different road accident risk levels in the European and the African countries. While our study draws on national-level data from six countries, the primary analytical focus is on continental-level comparisons between African and European RSC. We use national samples to explore broader continental patterns in RSC and behaviors; to contrast overarching cultural trends between Africa and Europe.
1.2. Aims
The aims of the study are to:
-
Compare road safety behaviours among car drivers and pedestrians in the African and the European countries (across continents),
-
Identify the elements of RSC where we see the biggest differences between the African and the European countries (across continents),
-
Examine the relationships between RSC and safety outcomes (respondents’ road safety violations and accident involvement),
-
Discuss factors influencing the different elements of RSC, and
-
Discuss how elements of RSC can be influenced to improve road safety in the African and in the European context.
2. Previous research
2.1. Road safety behaviours
Studies examining road safety behaviours between countries are often cross-cultural studies using the Manchester driver behaviour questionnaire (DBQ). Dotse and Rowe (2021) analyse the DBQ in a sample of 453 Ghanaian drivers and conclude that both violations and errors were higher in Ghana than typically reported in the UK (Dotse & Rowe, 2021). Nævestad et al (2025) found e.g. higher levels of aggressive violations and less seat belt use for Ghanaian bus drivers than for Norwegian bus drivers. ESRA2 collected data from about 45 000 road users in 48 countries, of which 12 countries on the African continent (Benin, Ivory Coast, Cameroon, Egypt, Ghana, Kenya, Morocco, Nigeria, Tunisia, Uganda, South Africa, Zambia (Torfs et al., 2021). The survey finds that the self-reported prevalence of speeding among African car drivers generally is lower than for European drivers and that the prevalence of drink driving in African countries is similar to figures from many European countries. Almost three out of four African respondents reported that they did not wear a seatbelt as a back seat passenger (Torfs et al., 2021).
2.2. Elements of road safety culture
RSC consists of many different elements. In the following, we describe four such elements, which we focus on in the present study.
2.2.1. Descriptive norms
The first element of RSC that we focus on is descriptive norms, which refer to individuals’ perceptions of what other people actually do (Cialdini et al., 1990). Descriptive norms may influence behaviour by providing information about what is normal behaviour in traffic in the road users’ country, thereby creating a “mild social pressure” to do as the others do (Cialdini et al., 1990; Nævestad et al., 2019). This is the “acceptable and expected behaviour” in a country, learned through observation of what others do in traffic. Operationalizing RSC partly as descriptive norms, we may refer to the mechanism mediating between safety culture (shared norms and expectations) and safety behaviours as “subtle social pressures” (Cialdini et al., 1990; Nævestad et al., 2019). It is important to note that descriptive norms can also influence behaviour through the false consensus bias, where individuals overestimate the prevalence of risky behaviour among their peers to justify their own behaviour (Berkowitz, 2005). In a recent study of bus drivers in Norway and Ghana, Nævestad et al (2025) find that bus drivers in Ghana expect a higher level of violations from car drivers in their country than bus drivers in Norway do. This applies to aggressive violations, speeding, drunk driving, lacking seat belt use.
2.2.2. Fatalistic beliefs
The second element of national RSC that we focus on is fatalistic beliefs, which refer to a tendency to view life events as predetermined and inevitable (cf. Boua et al., 2024). If your fate is predestined, what you do in traffic (including risk taking) will not make a difference (Boua et al., 2024; Kouabenan, 1998). People who hold fatalistic beliefs tend to believe that they do not have control over events, as these events are controlled by external factors (Kouabenan, 1998). This contrasts with internal control, where individuals believe they can influence outcomes through their own actions. People with strong fatalistic beliefs may feel they have little power to prevent accidents, which can lead to less safe road behaviours (Ngueutsa & Kouabenan, 2017). In contrast, those with a strong internal control are more likely to take personal responsibility and engage in safer behaviours. Thus, studies show that fatalism is linked to riskier behaviour, while internal control correlates with safer choices (e.g., Boua et al., 2024; McIlroy et al., 2020; Ngueutsa & Kouabenan, 2017). Several studies from African countries report a relatively high level of fatalistic beliefs among road users, and indicate relationships between fatalistic beliefs and unsafe road behaviours (McIlroy et al., 2020; Ngueutsa & Kouabenan, 2017; Omari & Baron-Epel, 2013; Teye-Kwadjo, 2019). There are, however, few studies comparing fatalistic beliefs related to road safety across African and European countries. However, McIlroy et al (2020) provides empirical evidence comparing fatalistic beliefs and their impact on pedestrian behaviours between at least one African country (Kenya) and one European country (UK). This study finds higher average levels of fatalistic beliefs in Kenya compared to the UK.
2.2.3. Values and attitudes related to freedom to take risk in traffic
The third element of RSC that we focus on is values and attitudes related to freedom to take risk in traffic, and paternalism. The Cambridge Dictionary defines freedom as “The condition or right of being able or allowed to do, say, think, etc. whatever you want to, without being controlled or limited” When applied to road safety, individual freedom concerns the right to “act as you want” (i.e. take risks) without being controlled or limited. This may apply to e.g. drivers’ speeding in traffic, driving without using seat belt, driving when drunk etc. Previous research indicates a relationship between the scope of road safety policies in countries and cultural values related to the freedom to take risks and paternalism (Elvebakk, 2015). In a comparison of drivers in Norway, Israel and Greece, Nævestad et al (2022) found that the Greek drivers valued freedom to take risk in traffic higher than drivers from Norway and Israel, and that attitudes measuring this value influenced road safety violations, which in turn influenced accident involvement. Values and attitudes legitimize and motivate road user behaviours and the norms prescribing behaviours (Gehlert et al., 2014). As the three studied European countries studied are early implementers of Safe system and Vision zero, with a high road safety level, we might expect lower focus on values and attitudes related to freedom to take risk (i.e. the opposite of paternalism) in the European countries compared with the African countries (cf. Nævestad et al., 2022).
2.2.4. Valuation of motorized transport over walking
The fourth element of RSC that we focus on is the valuation of motorized transport over walking. In an interview study with stakeholders in transport policy and practice in African countries, Benton et al (2023) report that interviewees perceived that walking is undervalued in policy and practice in African countries. Interviewees also perceived that there is insufficient funding allocated to walking infrastructure and services in comparison to other transport modes. Benton et al (2023) states that in African countries, decision makers tend to prioritize investments focusing on upgrading and expansion of roads, parking, and traffic systems that favour private motorized transport, at the expense of the majority mode of walking and other sustainable transport modes. The rationale for this continued focus on motorized transport is that large road investment projects is a sign of progress, and the beliefs that it may foster economic growth (UN Environment, 2016). In contrast, several European countries have implemented systematic policies to promote walking through Safe System principles. Thus, there seems to be a higher valuation of motorized transport over walking in African countries, compared with European countries. This means that driving a car is viewed as far more prestigious than walking. As a result, walking is less safe, more challenging, and unpleasant in African countries compared with European countries.
2.3. Hypotheses
Based on the previous research outlined above, the current study will test the following hypotheses, about differences across continents:
-
Road safety behaviours. The level of self-reported road user violations (except speeding) is higher among car drivers and pedestrians in the African countries than in the European countries. (Hypothesis 1)
-
Descriptive norms. The level of road user violations that car drivers and pedestrians expect from car drivers in their country is higher in the African countries than in the European countries (except for speeding). This means an RSC with more violations among car drivers in the African countries. (Hypothesis 2)
-
Fatalistic beliefs. There is a higher level of fatalistic beliefs among road users in the African countries than in the European countries. (Hypothesis 3)
-
Values and attitudes related to freedom. There is a higher level of freedom values and attitudes among road users in the African countries than in the European countries (Hypothesis 4).
-
Valuation of motorized transport over walking. There is a higher valuation of motorized transport over walking among road users in the African countries than in the European countries (Hypothesis 5).
-
Influence of national RSC on safety outcomes. There is a relationship between RSC elements and road safety violations, which in turn influences accident involvement (Hypothesis 6).
3. Method
3.1. Interviews and focus groups
Individual interviews and focus group interviews with 46 stakeholders were conducted in three African countries: Ghana, Tanzania and Zambia. A main purpose of the interviews and focus groups was to get information about and discuss the relevance of survey items measuring road safety violations and items measuring RSC. This included getting insights into the most relevant road safety challenges and behaviours, beliefs and norms that might be important in these contexts. Other issues that were discussed were factors influencing RSC, e.g. road user interaction, enforcement, the composition of road users (e.g. vulnerable road users, motorcyclist), economy, and urban planning. Interviews were conducted digitally via Microsoft Teams between November 2022 and April 2023, with interview durations ranging from 40 minutes to 2,5 hours (for group interviews). We focused on assembling a sample that represented various roles in road safety work, including people employed e.g. in authorities, in NGOs and as researchers. We conducted thematic analyses of the interviews, to identify systematically recurring themes in the interviewees’ descriptions of specific topics (Braun & Clarke, 2006).
3.2. Fieldwork
The main author visited Zambia in 2022, and Tanzania in 2023 and 2024 and Ghana in 2023 and 2025. He stayed for 6-7 days each time and spent a lot of time in traffic as passenger in cars and as a pedestrian. Provisional field work notes were made (as well as photographs and videos), focusing on e.g. the: 1) composition of road users, 2) interaction between road users (e.g. the level of cooperation or conflict), 3) the quality of road and road infrastructure, 4) facilitation of the road system for vulnerable road users and 5) car drivers’ respect for and consideration of vulnerable road users and motorcyclists, 6) general risk taking behaviours (e.g. speeding, seat belt use, helmet use) and 7) the situation of children in traffic. The focus on the field notes was on comparing the situation in the African countries with the situation in the European countries (i.e. Norway, Sweden, Netherlands). A second Norwegian researcher has also been to Ghana and Tanzania to observe and discuss results from the fieldwork. The purpose of the fieldwork was that the Norwegian authors should experience traffic in the African countries, to get a deeper understanding of the background of the data in the survey.
3.3. Quantitative survey
3.3.1. Recruitment of respondents
The survey data was mainly collected in the first half of 2024. The survey data aims to include representative samples of private car drivers and pedestrians in the capitals/largest cities of the participating countries. Capitals were chosen in all the participating countries, except for Tanzania, where we choose the largest city (Dar es Salaam, which was the capital until 1996).
All the national samples have been drawn from representative populations. The European samples have been drawn from representative panels, and the African samples have been recruited from different city areas at different times. African pedestrian respondents in the study were recruited when they were walking on the street. European pedestrian respondents in the study were recruited through a survey of representative people in the capitals of the participating countries. People who never walk as a mean of transport, were filtered out. The recruitment of respondents is described in detail in the Appendix (A1).
3.3.2. Survey themes
We have made several sum score indexes, based on the questions in the surveys. When making these sum score indexes, we have taken three considerations. First, we have assessed the importance and relationship between questions based on previous research, indicating that the questions measure the same underlying phenomenon. Second, we conducted exploratory factor analyses (EFA) based on the data from all the countries taken together, examining whether questions load on the same factor, or different factors. Third, we conducted analyses of internal consistency, including Cronbach’s Alpha estimate with: “scale if item deleted” analyses, to identify questions that seem less important, and whose removal might increase the internal consistence of the sum score index. When making the sum score indexes, we combine the different Likert type statements into a general mean score. For instance, a sum score index with five items, each with five answer alternatives will have a minimum score of 5 (5*1) and a maximum score of 25 (5*5). Sum-score indexes are computed for each respondent, allowing for comparisons between different groups of respondents on the different indexes (e.g. African versus European respondents, pedestrians versus car drivers). The description of the survey themes and indexes, the full wording of the survey questions, including means and standard deviations are included in the Appendix (A2, A3).
3.3.3. Multivariate analyses
To test hypotheses regarding predictors of road safety outcomes, two multivariate regression approaches were used. Binary logistic regression was applied to model accident involvement (yes/no), while multiple linear regression was used to model continuous scores on the road safety violations index. Variables were entered hierarchically, beginning with demographic variables (e.g., gender, age), followed by different RSC elements (e.g., fatalistic beliefs, descriptive norms), and culminating in a regional variable (Europe vs. Africa). All indexes used as predictors were constructed from Likert-type items and demonstrated acceptable internal reliability (e.g., Cronbach’s alpha > 0.70). The stepwise modelling strategy allows for the examination of both unique and cumulative contributions of the predictors.
4. Results
4.1. Description of the respondents
A total of 3772 respondents participated in the study. A total of 1910 of the respondents are car drivers, while 1862 of the respondents are pedestrians (cf. Table 1).
| Car | Pedestrian | ||||||||
|---|---|---|---|---|---|---|---|---|---|
| Continent | Country | Male | Female | TOTAL | Male | Female | TOTAL | ||
| Europe | 49% | 51% | 1121 | 48% | 52% | 1109 | |||
| Norway | 53% | 47% | 544 | 49% | 51% | 544 | |||
| Sweden | 46% | 54% | 293 | 44% | 56% | 285 | |||
| The Netherlands | 43% | 57% | 284 | 51% | 49% | 280 | |||
| Africa | 71% | 29% | 789 | 61% | 39% | 753 | |||
| Ghana | 68% | 32% | 282 | 62% | 38% | 258 | |||
| Tanzania | 81% | 19% | 216 | 70% | 30% | 250 | |||
| Zambia | 67% | 33% | 291 | 52% | 48% | 245 | |||
| All | 58% | 42% | 1910 | 53% | 47% | 1862 | |||
Table 1 shows that the share of females is lower among the car drivers in the African countries, especially in Tanzania, and that the share of females is more similar among the pedestrians, but lower in Tanzania than in the other countries. Additional demographic details are provided in the Appendix (A4).
4.2. Fieldwork observations of road safety culture
Traffic flow and road use. Traffic during peak hours was characterized by high levels of congestion, particularly in urban areas. In Tanzania, a large number of motorcyclists were observed weaving between vehicles to navigate through stalled or slow-moving traffic, taking advantage of their smaller size and greater manoeuvrability. Similarly, minibuses (generally carrying 15 to 20 passengers) moved assertively through traffic, sometimes bypassing queues or merging aggressively. Numerous street vendors (hawkers) were observed selling goods directly in the roadway on several road stretches. This created informal zones of interaction between vehicles and pedestrians, introducing additional complexity and risk. Pedestrian traffic was also high, particularly along major roads, where people were observed walking, sitting, playing etc., also in the dark. However, very few bicyclists and no wheelchair users were seen during the fieldwork period.
Interaction between road users. From a European perspective, the traffic seemed chaotic, hectic and unregulated, with a high number of conflicts and near misses. Road user interaction often appeared to be shaped by assertive behavior. Gaps between vehicles were notably smaller than what is typically observed in northern European settings. In congested conditions, forward movement appeared to depend in part on assertiveness, with larger vehicles and more forceful drivers generally prevailing. This created a traffic hierarchy in which smaller or more vulnerable road users (pedestrians, cyclists, or motorcyclists) were required to yield to larger vehicles.
Examples of high-risk situations. In cities such as Dar es Salaam (Tanzania), the main roads exhibited intense competition for space, with frequent overtaking and lateral maneuvering. This resulted in a high volume of near misses and conflicts. The integration of side-road traffic into main road flows further contributed to complexity. Motorcycles, in particular, merged from various directions, often at considerable speed differentials, contributing to unpredictable interactions. All segments of the road space were used by road users, including shoulders, medians, and drainage areas, and spontaneous route changes were common. Pedestrians frequently crossed multilane roads, sometimes running to avoid oncoming vehicles, particularly in areas with limited designated crossings.
Vulnerable road users and infrastructure design. The fieldwork indicated relatively limited protection for vulnerable road users in the observed settings. Physical separation between pedestrians and vehicles was generally absent, even on high-speed roads passing through populated areas or near schools. This stands in contrast to European countries such as Norway and Sweden, where pedestrian infrastructure, traffic calming, and legal norms provide higher levels of protection. Respect for vulnerable road users appeared lower in the African contexts observed.
Protective equipment and risk tolerance. Low usage rates of basic safety equipment were also noted. Helmet use among motorcyclists was inconsistent, and seat belt use appeared limited. Several types of risk taking that are very unusual from a European perspective were observed, e.g. entire families, including infants and young children, riding on motorcycles, frequently without any form of protective gear, people sitting on top of truck loads in traffic, people sitting on, or walking along high-speed roads in the dark etc. These behaviors suggest a higher general tolerance for traffic risk, and they reflect a road safety culture distinct from those in Northern Europe.
4.3. Road safety behaviours
The focus of this section is the first aim of the study. To measure road safety behaviours, we use the driver violation index (based on 10 items, with a high score indicating more violations) and a speeding index (comprised of 2 items, with higher scores indicating more speeding). We expected the level of some types of violations (e.g. aggressive violations) to be higher among the car drivers and pedestrians in the African countries (Hypothesis 1) Our results support this hypothesis for the driver violations index: Anova tests show that African drivers score significantly higher (p=<0.001) on the driver violations index than the European drivers (20.9 vs. 13 points), indicating higher levels of driver violations (cf. Appendix A3, where mean scores and SDs for each item is provided). The main differences are related to aggressive violations, but differences are also significant when it comes to the other driver violations, e.g. driving under the influence, lacking seat belt use. For the speeding index, European drivers score significantly higher (p=<0.001, 4.8 vs. 3.9 points), indicating more over speeding among the European drivers.
For the pedestrian behaviour index, results indicate a significantly (p=<0.001) higher level of aggressive violations among the African pedestrians compared with the European pedestrians. The former scored 6.2 points on the pedestrian aggressive violations index, the latter 5.1 points (total range of scale: 4-28). Thus, results for pedestrians also support Hypothesis 1. Looking at specific countries, the main difference is between the Norwegian and the Ghanaian pedestrians. The scores for pedestrians in Norway, Sweden, Netherlands, Zambia and Tanzania were not significantly different. The score in Ghana was statistically significantly different from the other countries.
4.4. Elements of road safety culture
The focus of this section is the second aim of the study. We compare results for four RSC elements.
4.4.1. Descriptive norms related to road safety
The first element of RSC that we focus on is descriptive norms, measured with the descriptive norms index for violations, and another for speeding. We expected that the level of violations that are expected from car drivers in each country is higher in the African countries than in the European countries. This means an RSC with more violations among car drivers in the African countries. (Hypothesis 2). The mean score of African car drivers on the index is 10,7 points, while it is 10,8 for African pedestrians. Corresponding scores in the European groups are 8 and 7.9 points). This indicates that pedestrians and car drivers in the respective continents have similar expectations to car drivers’ violations, i.e. shared RSCs measured as descriptive norms. These results are in line with Hypothesis 2. (It is, however, important to note that the differences between countries within the two continents were considerable, indicating the importance of comparing countries and not continents.)
For the speeding in residential areas statement, car drivers in Africa had the lowest score (1.8 points), followed by pedestrians in Africa (1.9 points) and the drivers in Europe (2.0 points). Pedestrians in Europe had the highest score (2.3 points). This means that both car drivers and pedestrians in the European countries expect higher levels of over speeding from car drivers in their country. This result is not in accordance with Hypothesis 2.
4.4.2. Fatalistic beliefs related to road safety
The second element of RSC that we focus on is fatalistic beliefs related to road safety. For the fatalism index, a higher score indicates more fatalistic beliefs. We expected a higher level of fatalistic beliefs among road users in the African countries than in the European countries. (Hypothesis 3). Our results support this hypothesis: The scores on the fatalism index among African pedestrians were 19, while it was 16.8 among the car drivers in Africa. Corresponding scores in the European sample was 8.3 points and 8.1 points. Anova tests show that the differences between continents are statistically significant (p=<0.001). To illustrate differences between the continents, Figure 1 shows the proportions of respondents agreeing with the different statements in the European and the African samples.
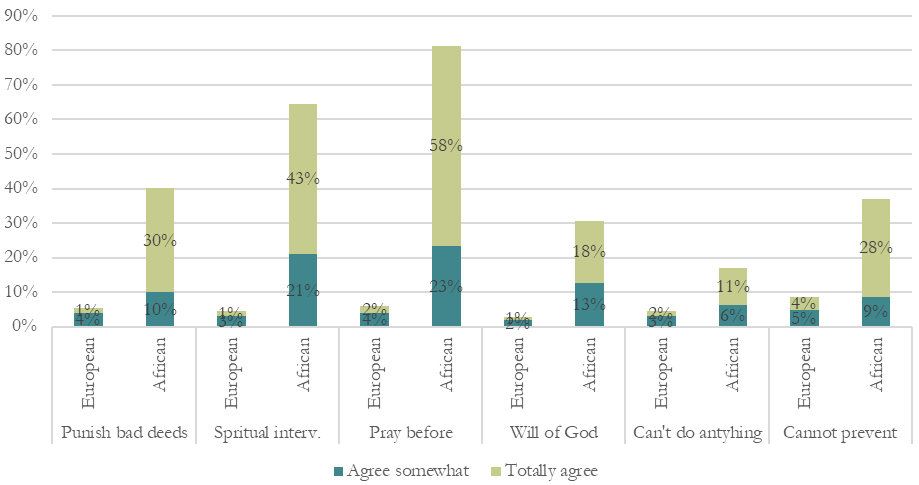
Figure 1 shows strong differences between the African and the European respondents. The shares agreeing with the statements are in some instances 16 times higher in the African sample, e.g. for the statement: “I believe that spiritual intervention, such as prayers, can prevent road crashes”. Other statements are e.g. “I believe that some people die in road crashes as punishment for some bad deeds”, “I pray before embarking on a journey”, I believe that road crashes are the will of God, “People cannot prevent their own death (e.g. in road crashes), they die when it is their time to die” (see full wordings in Appendix, A3).
4.4.3. Values/attitudes related to individual freedom to take risk, and to paternalism
For the freedom to take risk index, a higher score reflects a higher value placed on the freedom to take risk. A high value placed on individual freedom to take risk in traffic is the opposite of paternalism. We hypothesized that road users in the European countries would score lower on this index, as the European countries have implemented Safe system road safety policies and Vision Zero (Hypothesis 4). Our result supports this, as the mean score among European respondents was 3.4 points, while it was 4 among the African respondents (p=<0.001). The scores on the index among African pedestrians were 4.1, while it was 3.8 among the car drivers in Africa. Corresponding scores in the European sample was 3.3 points and 3.5 points. Although Tukey post hoc tests show that differences between scores across continents are statistically significant, these differences are not big. Moreover, we do not see clear patterns across the countries in Europe and Africa when it comes to attitudes to individual freedom to take risk. Both Norway and Ghana have low scores, while Tanzania has the highest scores. Thus, Hypothesis 4 is supported technically, but perhaps not substantially.
4.4.4. Valuation of motorized transport over walking
The valuation of motorized transport over walking items were (unfortunately) only answered by the pedestrians. The statements measuring this are: “People who drive a car to their job are respected more than people who walk to their job”. “The road system in my country is made for cars and not for pedestrians.” Anova tests shows that the difference between European and African respondents was statistically significant (p<.001) on the first statement. This supports Hypothesis 5. The difference on the second statement was only statistically significant at the 10% level (p=0.093). This is probably related to the ambiguous nature of the statement. This statement may be interpreted both as a descriptive statement (how it is now), and as a normative statement (how it should be). To illustrate the differences between the continents, we can look at shares agreeing with the statements. The shares agreeing with the statement: “People who drive a car to their job are respected more than people who walk to their job” was more than seven times higher in the African sample than in the European sample (70% vs. 8%). When it comes to the second statement, 39% of European pedestrians agreed, compared to 51% of the African pedestrians.
4.5. Factors influencing safety outcomes
The focus of this section is the third aim.
4.5.1. Factors influencing car drivers’ accident involvement
In Table 2, we examine factors influencing car drivers’ accident involvement in the last two years. As noted, 28% of the African car drivers report that they have been involved in a car accident in the last two years, while 10% of the European car drivers report the same.
| Variable | Mod. 1 | Mod. 2 | Mod. 3 | Mod. 4 | Mod. 5 | Mod. 6 | Mod. 7 |
|---|---|---|---|---|---|---|---|
| Km’s driven last two years | 1.000* | 1.000* | 1.000* | 1.000 | 1.000 | 1.000 | 1.000 |
| Gender (male=0, female=1) | .675*** | .660*** | .684** | .707** | .739** | .940 | |
| Age (>26=0, <26=1) | 1.909*** | 1.624** | 1.522** | 1.476** | 1.448* | ||
| Experience (0>20years, 1>20 years) | .439*** | .426*** | .441*** | .665** | |||
| Education (university=1, other=0) | .688*** | .687*** | .623*** | ||||
| Road safety violations index | 1.019*** | .993 | |||||
| European vs. African countries | 3.518*** | ||||||
| Nagelkerke R2 | .001 | .011 | .020 | .040 | .047 | .053 | .112 |
First, we see that gender contributes significantly and negatively to car drivers’ accident involvement, in Model 1-6. The contribution is lower than 1, indicating that being female is related to decreased probability of being involved in an accident. Gender ceases to contribute significantly to Model 7, when the European vs. African countries variable is included, indicating a relationship between the two variables. (Perhaps a somewhat lower proportion of female car drivers in African countries).
Second, age contributes significantly. The odds are higher than 1, indicating that being younger than 26 years is related to increased probability of accident involvement.
Third, experience contributes significantly. The odds are lower than 1, indicating that a driver experience of more than 20 years, is related to decreased probability of accident involvement, compared with those with a lower experience.
Fourth, university level education contributes significantly. The odds are lower than 1, indicating that university education, is related to decreased probability of accident involvement, compared with those with a lower level of education.
Fifth, the road safety behaviour index contributes significantly, and the odds are higher than 1, indicating that a higher level of driver violations is related to increased probability of accident involvement, compared with those with a lower experience. The road safety behaviour index ceases to contribute significantly to Model 7, when European vs. African countries variable is included. This is because there is a strong relationship between road safety violations and African vs. European: the former scores higher on the index.
Sixth, the European vs, African countries variable contributes significantly, and the odds are higher than 1, indicating that respondents in African countries have a higher probability of accident involvement, compared with the European sample.
Finally, the Nagelkerke R2 value in Model 7 is .112, which indicates that the variables in Model 7 explains 11% of the car drivers’ accident involvement.
4.5.2. Factors influencing car drivers’ road safety violations
In Table 3 we examine factors influencing car drivers’ road safety violations. As noted above, this variable contributed significantly to drivers’ accident involvement until the variable European vs. African was included in the model. We do not include the fourth RSC element in this analysis, as only pedestrians answered these questions.
| Variable | Mod. 1 | Mod. 2 | Mod. 3 | Mod. 4 | Mod.5 | Mod. 6 | Mod. 7 |
|---|---|---|---|---|---|---|---|
| Gender (male=1, female=2) | -.110*** | -.112*** | -.112*** | -.100*** | -.069*** | -.057*** | -.014 |
| Age (>26=1, <26=2) | .062*** | .062*** | -.002 | -.018 | -.029 | -.031* | |
| Education (university=1, other=0) | .002 | -.017 | -.029 | -.029 | -.032* | ||
| Descriptive norms index | .528*** | .429*** | .394*** | .372*** | |||
| Fatalistic beliefs index | .244*** | .224*** | -.014 | ||||
| Freedom to take risk attitudes | .169*** | .207*** | |||||
| European vs. African | .343*** | ||||||
| Adjusted R2 | .012 | .015 | .015 | .289 | .337 | .363 | .417 |
First, we see that gender contributes significantly and negatively to car drivers’ road safety violations. This means that being a female car driver is related to less aggressive road safety violations, controlled for the other variables in the model. The contribution of this variable ceases however to be significant in Model 7, when Europe vs. Africa is included in the model. This indicates a relationship between the two variables.
The descriptive norms index contributes significantly and positively to car drivers’ road safety violations. This means that car drivers who ascribe a high level of aggressive violations and other road violations to car drivers in their own country also report to commit a high level of road safety violations, controlled for the other variables in the model. Thus, the road safety violations of car drivers are related to the road safety violations of other car drivers in their country.
The fatalistic beliefs index contributes significantly and positively to car drivers’ road safety violations. This means that holding a high level of fatalistic beliefs as a car driver is related to higher levels of road safety violations, controlled for the other variables in the model. This variable ceases to contribute significantly in Model 7, when European vs African is included, reflecting the close relationship between fatalistic beliefs and African nationality.
Freedom to take risk-attitudes contributes significantly and positively to car drivers’ road safety violations. This indicates higher levels of road safety violations among car drivers with attitudes focusing on the freedom to take risk in traffic, controlled for the other variables in the model.
The variable European vs. African contributes significantly and positively to car drivers’ road safety violations. This indicates higher levels of road safety violations among African car drivers, controlled for the other variables in the model.
Finally, the adjusted R2 value in Model 7 is .417, indicating that the model explains about 42% of the road safety violations of the car drivers.
4.6. Factors influencing elements of road safety culture
The fourth aim of the study is to discuss factors influencing the different elements of national RSC. A detailed description for each RSC element is provided in the Appendix (A5), and the main results are summed up in Table 5 in section 5.4.
5. Concluding discussion
5.1. Road safety behaviours
The first aim of the study was to compare road safety behaviours among car drivers and pedestrians in the African and the European countries (across continents). We expected that the level of all types of violations except speeding was higher among the car drivers and pedestrians in the African countries. (Hypothesis 1). Our results support this hypothesis for the 10 item driver violations index. These results are in accordance with previous research, e.g. Dotse and Rowes’ (2021) study of Ghana, comparing with the UK (Dotse & Rowe, 2021) and Nævestad et al’s (2025) comparison of Ghanaian bus drivers than the Norwegian drivers. However, the comprehensive ESRA survey did not find big differences between road safety violations in African and European countries (Torfs et al., 2021). In fact, Torfs et al (2021) found that the prevalence of over speeding was higher among European drivers than African drivers (Torfs et al., 2021). We also found this in our survey results. This was, however, in contrast to our experiences from the field work and the focus group data, which indicated higher levels of speeding in the African countries. Focus group participants were surprised that we found higher levels of self-reported speeding in European than in African countries in the survey. This is an important area for future research.
5.2. Where do we see the biggest differences between the RSCs of the European and African respondents?
The second aim of the study was to identify the elements of RSC where we see the biggest differences between the African and the European countries (across continents). Table 4 shows the mean scores and standard deviations on the RSC elements that we use to measure RSC. We also indicate how many percent higher the mean scores of the African respondents are on the different RSC elements, to indicate where we see the biggest differences between African and European respondents.
| European | African | ||||
|---|---|---|---|---|---|
| RSC element | M | S.D. | M | S.D. | Percent higher |
| Fatalism index | 8.1 | 3.6 | 17.8 | 5.5 | 120 % |
| Valuation motorized transport | 2.0 | 1.1 | 3.9 | 1.4 | 95 % |
| Descriptive norms - violations | 7.9 | 3.2 | 10.2 | 4.6 | 29 % |
| Freedom to take risk index | 3.4 | 1.9 | 4.0 | 2.3 | 18 % |
| Descriptive norms - speeding | 2.2 | 1.1 | 1.8 | 1.2 | -18 % |
Table 4 shows that the largest difference between the African and European respondents when it comes to RSC elements concerns fatalistic beliefs. There are no other comparable results displaying such large differences between the European and the African respondents. The higher level of fatalism among African respondents is in line with previous research, although there seem to be few cross-continental studies of this. Mcllroy et al (2020) which is one of few studies comparing fatalism related to road safety across a European and African context find a higher level of fatalism in Kenya than UK. They also cite a wide range of studies from African countries reporting a relatively high level of fatalistic beliefs among road users, and which indicate relationships between fatalistic beliefs and unsafe road behaviours (e.g. Ngueutsa & Kouabenan, 2017; Teye-Kwadjo, 2019). Thus, our results are in line with Hypothesis 3.
The second largest differences are related to the valuation of motorized transport over walking. In the African sample, the share agreeing with the statement “People who drive a car to their job is respected more than people who walk to their job” was seven times higher in the European sample. This supports Hypothesis 5. Our results are in line with previous research, which indicates a higher valuation of motorized transport over walking in studied African countries (Benton et al., 2023; UN Environment, 2016). Focus group interviews also indicated this.
5.3. The relationship between RSC, behaviours and accident involvement
These results are important, as our study indicates that there is a relationship between RSC elements and road safety violations, which in turn influences accident involvement (cf. Aim 3, Hypothesis 6). This is accordance with previous research. Nævestad et al (2019), finds this, focusing on descriptive norms, and Nævestad et al (2022) find this, focusing on freedom values. Both relationships are also found in our study. Moreover, Ngueutsa and Kouabenan (2017), Teye-Kwadjo (2019) and McIlroy et al (2020) find a relationship between fatalistic beliefs and unsafe road safety behaviours, but do not examine relationships between behaviours and accident involvement. Our study indicates such a relationship. We have not been able to examine the relationship between valuation of pedestrians and road user behaviour, indicating a need for future research.
5.4. Influencing road safety culture
The third aim of the study was to discuss factors influencing the different elements of national RSC, while the fourth aim was to discuss how elements of RSC can be influenced to improve road safety in the African and in the European context. In Table 5, we provide an overview of RSC elements, mechanisms between RSC elements and road safety behaviours, factors influencing the RSC elements and how these elements of RSC can be influenced (see Appendix A5 for a detailed account of factors influencing the RSC elements). In most cases, the suggested factors are speculation, based on indications in the data, indicating issues for future research. A general challenge, is that there seems to be very few scientifically validated approaches to influencing RSC elements, suggesting a need for future research.
| RSC elements | Mechanisms-RSC and behaviour | Factors influencing RSC? | How can it be influenced? |
|---|---|---|---|
| Descriptive norms violations (Five-item scale) Results: -Influences road safety violations. |
Subtle social pressure to do as others do on the road | Created in interaction, influenced by: road infrastructure, enforcement, training, composition of road users, economy, degree of urban planning, existence of a well- functioning public transport system etc. | Materialistic approach: Interaction, road infrastructure, enforcement, training, composition of road users, economy, degree of urban planning, existence of a well-functioning public transport system. Idealistic approach: Information campaigns and education. |
| Fatalistic beliefs (Six-item scale) Results: -Influences road safety violations. |
“My actions do not matter, as my fate is predestined” “God decides when we die” |
Integrated and deep-seated part of religious views and related to religion. | Priests, imams and other religious representatives, or educators can target specific attitudes related to road safety. It is important to increase peoples’ perceived internal control |
| Freedom attitudes (Two-item scale) Results: -Influences road safety violations. |
“It is my right to behave as I want” (“I will not tolerate measures restricting my freedom”) |
Integrated and deep-seated part of ideological and political views. | Politicians and political parties can target specific attitudes related to road safety. Political leaders should frame regulations (e.g., speed limits, seatbelt enforcement) not as restrictions, but as protections for the community. |
| Valuation of motorized transport (one item) Results: -Have not examined relationship with violations. |
“Pedestrians should not be in the way for cars” We may assume that high valuation of motorized transport is related to less respect for pedestrians in traffic. (And Infrastructure not adapted to pedestrians) |
Cultural ideas related to signs of societal progress, wealth and individual status. | Provide information and education to both stakeholders (politicians, city planners etc.) and citizens stressing that walking is a separate mode of transport, with benefits for health, environment and safety. Infrastructure changes, urban planning. |
Influencing road safety violations and descriptive norms. Our data indicates that road safety violations in the studied countries are influenced by the level of enforcement, road infrastructure, training, economy, the composition of road users and interaction among road users in traffic. This is in line with factors identified in previous research (cf. Bjørnskau, 2014; Elvik et al., 2009; Luria et al., 2014; Nævestad et al., 2019; Özkan et al., 2006). Based on this, the following measures could contribute to influencing the level of road safety violations: a) Increasing and improving enforcement, b) Implementing safe system infrastructure, c) Improving road user training, d) Improving family economy. In the fieldwork data, we note the daily observations of families with small children on motorbikes, often without helmets. A likely explanation for this is family economy; i.e. that many families have a motorbike as their main mode of transport (and not a car). Thus, improving economy might reduce risk taking.
Influencing fatalistic beliefs. Focusing on fatalistic beliefs among road users in Morocco, which is a Muslim country, Boua et al (2024), write that places of worship (i.e. mosques), especially during Friday preaching, can be favourable places to tackle fatalistic beliefs. Boua et al (2024) has a special focus on Friday sermons, as this holds a predominant place in the social life in Morocco and are also sent directly in public media (TV, Radio). The Friday prayer is one of the main occasions where the faithful are told that belief in fate is one of the main bases of faith, and that everything that happens is meant to happen and that the results are ultimately predestined. Boua et al (2024) suggest that it is possible for preachers to nuance this picture without questioning the fundamental idea of predestination. This can be done if preachers say that it is possible to influence certain events in life (e.g. traffic accidents) to teach them that traffic accidents are not inevitable events, but events that are influenced by our behaviour in traffic. Although the studied African countries have predominantly Christian populations, we believe that this approach, focusing on religious leaders in these countries also seem promising. Boua et al (2024) also suggest a scheme where these groups are presented with an accident to be analysed, to identify possible causes and to propose prevention measures. This might increase road users’ perception of internal control (Ngueutsa & Kouabenan, 2017).
Influencing attitudes focusing on freedom to take risk (and paternalism). As with the case of fatalistic attitudes, the most relevant countermeasure seems to be to provide information about the scientific causes of road accidents and effective countermeasures. This might show that excessive road user freedom leads to more fatalities. Moreover, this information should be provided by figures with a high societal standing. This might be an issue for politicians and political parties, as attitudes related to freedom and paternalism are ideological and political. Attempts to influence individuals’ political beliefs about risk-taking and paternalism can be difficult, as they may be perceived as intrusive efforts to limit personal freedom - thus triggering the very scepticism they seek to overcome
Influencing attitudes related to the valuation of walking and pedestrians. The social status of car ownership might be hard to change, as it is related to people’s economy: if everybody has a car, car ownership does probably not give the same status. Nevertheless, relevant measures to improve the sociocultural position of pedestrians in the African countries would be to provide information and education to both stakeholders (politicians, city planners etc.) and citizens stressing that walking is a separate mode of transport, with benefits for health, environment and safety. Information and education should be combined with efforts to develop a pedestrian friendly infrastructure and urban planning (e.g. safe school roads, urban infrastructure). The latter is probably easier than to try to change underlying beliefs about progress and the general sociocultural status of walking.
5.5. Do we need to change the society to change the road safety culture?
Our study indicates that the RSC elements that we have examined are related to different domains in society, e.g. basic religious beliefs, the level of urban planning and public transport, integrated and deep-seated part of ideological and political views, cultural ideas related to signs of societal progress, wealth and individual status. These factors relate to underlying societal influences that may be hard to transform, and which extend far beyond the traditional toolbox of road safety practitioners. Additionally, the fundamental character of the influences indicates that changing RSC may take time.
We may therefore ask whether it is possible to change RSC without changing society, so to speak? Expanding further on that, we may discuss whether RSC is merely a symptom of more underlying factors (e.g. infrastructure, economy, religion), or whether RSC is an independent factor in itself. The answer to this question is important, as it has practical implications. Does culture change when underlying (material/structural factors) influencing factors change, or can we change shared ideas and beliefs without changing society?
5.6. Methodological weaknesses and strengths
1) Comprehensive survey safety data are rarely available. There are as far as we know, no studies comparing RSC among both car drivers and pedestrians in both European and African countries. Additionally, comprehensive survey safety data are rarely available from African countries (UNECA, 2015).
2) We rely on both qualitative and quantitative data. We use fieldwork data to assess whether the observed survey differences, e.g. in road safety violations, are as expected based on our experiences in the different countries. Moreover, we can also use these data to assess whether there are unmeasured aspects of RSC that we should have focused on. Together with interview data, fieldwork data has also been used to develop survey questions.
3) Representativeness of the samples. The African sample is skewed toward younger and male respondents, whereas the European sample includes a larger proportion of older adults and a more balanced gender distribution. These differences reflect broader demographic patterns and possible disparities in recruiting strategies, especially among older women in the African context. These differences should be taken into account when interpreting cross-regional comparisons, as age and gender are likely to influence how people answer. However, the observed age differences between the African and European samples reflect underlying demographic trends. According to UN estimates (2024), the median age in the African countries included in the study ranges from 17 to 21 years, while it is around 40 years in the European countries (United Nations 2024). Thus, the younger age structure in the African sample aligns with broader population patterns and should not necessarily be interpreted as a sampling bias. Nevertheless, we acknowledge that the limited representation of older adults in the African sample may affect comparability of age-related findings across regions.
4) Self-Reported Data. The study is based on self-reported data, which could be influenced by respondents’ memory, truthfulness, and social or psychological biases that may influence reporting. As noted by Nævestad et al. (2017), comparing cross-cultural samples is challenging, as different national samples may be influenced by different baselines, and as expectations may vary between national samples. The levels of experience with surveys and trust in anonymity may vary between national samples. It is difficult to conclude about the importance of this.
5) Positively worded questions are excluded. We originally included some positively worded questions among the survey questions measuring descriptive norms and road user behaviour. These concerned e.g. stopping or slowing down for pedestrians. The challenge with these questions was that they are positively worded, and they followed negatively worded questions in the survey. Thus, several respondents commented that they had not realized the opposite wording before after they had finished the survey, and that they had “answered wrong”, or the opposite of what they intended on the positively worded questions. They recommended us to discard their answers on these questions. Looking at the results, we saw that they were contrary to what we expected, and contrary to comparative negatively worded questions in the survey.
6) Our focus is on continental RSC. The overarching objective of the study is to identify the elements of RSC where we see the biggest differences between the African and the European countries, and examine to what extent we can use the concept of RSC to shed light on different road accident risk levels in the European and the African countries. While the focus on continents captures more general differences, this grouping masks within-region heterogeneity, and limits nuanced analysis of country-specific factors. Differences between Ghana, Tanzania and Zambia are glossed over in the current analytical framework. The same applies to differences between the European countries. Future research should compare the specific African and European countries internally, to look for similarities and differences.
5.7. Topics for future research
5.7.1. Corruption as part of RSC
Interviewees in the African countries pointed to enforcement as an important factor influencing RSC, and to corruption as a potential factor impeding the efficiency of enforcement (cf. Appendix A5). Future studies of RSC should also include beliefs and practices related to corruption, as these are likely to be related to the level of road violations. Enforcement is one of the most effective ways of reducing road user violations and accidents, but the effectiveness of enforcement is impeded by corruption. Future studies including LMICs should examine this as an aspect of RSC, measuring it e.g. as descriptive norms, i.e. whether respondents expect violating road users to attempt to pay the police at the scene to avoid severe sanctions. Following the logic in Table 5, we can assume that the mechanism between corruption as an RSC element and road user violations is “I can commit violations in traffic, because if I am caught by the police, I might pay the police to avoid larger fines or imprisonment”. RSC influencing factors are e.g. low salaries of police officers, poverty, inequality, limited enforcement resources. Relevant ways to influence, or reduce it may be e.g. to strengthen institutions and accountability through increasing transparency in enforcement, or independent oversight bodies to investigate misconduct, or reduce incentives for bribery, e.g. through “fair salaries” for police and civil servants etc. This is an important issue for future research.
5.7.2. Examining relationships between elements of RSC
As far as we know, there are no previous studies testing different conceptualizations of national RSC across continents and transport modes. Conducting such studies is useful as a way of developing new knowledge in a relatively young research field like RSC research. Thus, the study has been explorative, testing different conceptualisations. An important question for future research is to develop a conceptual model to explain relationships between the different elements.
5.7.3. Can we use RSC to explain differences in national road safety records?
The number of killed road users per capita is seven times higher in the African countries compared with the European countries. Based on this, we would expect to see far higher differences between the levels of road user violations reported by the road users themselves and the level of violations that they attribute to other car drivers in their country (descriptive norms).
Why don’t we see bigger differences between road safety violations and descriptive norms in African and European countries, when the differences between the countries’ road fatality rates are so big? One possible explanation can be that other and unmeasured types of behaviour are more important than those we have measured, and that measuring these would reveal higher differences (cf. section 5.5.3). another possible explanation why we don’t see bigger differences in the road safety violations and descriptive norms items between European and African respondents, could be that other cultural and behavioural factors are more important for accident risk. Finally, another possible explanation is that the differences in road fatalities between African and European countries to a greater extent are due to other factors than road user violations (e.g. vehicles, road infrastructure). Factors related to roads, infrastructure and vehicles are clearly important, and we have not assessed the importance of these factors. Differences in national RSC are clearly just one part of the differences which may shed light on different safety records in the studied European and African countries.
5.7.4. Have we “missed the target” with our DBQ-based items?
Based on qualitative fieldwork data, we have described types of road safety violations and RSC which seem to be important in the studied African countries, and which we have been unable to measure quantitatively with our European DBQ tools, which to a considerable extent presupposes a more well developed and well-regulated road infrastructure and road system. This indicates an important area for future research. In our field work, we saw several instances of people sitting on top of truck loads at high speeds, families of four on motorcycles, often without helmets, pedestrians walking or sitting on the side of the road in the dark, without reflection when high speed cars were passing by.
With this backdrop from the qualitative fieldwork, it is tempting to ask whether we have managed to measure this traffic culture quantitatively, with all its different types of risk road safety violations. The answer is clearly no. Our survey questions measuring road safety violations focus on classical risk behaviours like speeding, seat belt use, driving under the influence etc. Given the diverse types of risky road user behaviour we saw in our fieldwork, we might suggest that the DBQ questions can be perceived as Eurocentric, presupposing a certain level of Safe system implementation, and a certain basis level of RSC. On the other hand, the DBQ items that we have included are universal risky road violations. Nevertheless, we perceive that there are elements of RSC and behaviour that we have been unable to measure quantitatively with our European DBQ -based tools. As noted, future studies should measure corruption as a part of RSC.
In the field work, we perceived that something is different (less regulated) and riskier (higher incidence of (extreme) risk taking) in the African countries compared with the European countries. From the point of view of the fieldwork, the main difference between the RSC in the studied European and African countries is related to the types of risk taking that are very unusual from a European perspective. Future surveys should also measure these aspects of road user violations and RSC. We believe that the identification of relevant cultural elements that can be used to measure national RSC is only in a starting phase. The importance of additional elements and relationships are still to be identified and tested.
6. Conclusion
Our study shows that specific cultural elements are related to road user behaviours and accident involvement. We suggest the following recommendations for each element, focusing on the context in the studied African countries:
Fatalistic beliefs: Because fatalism reduces personal responsibility, interventions should work through trusted religious leaders (priests, imams, pastors) who can nuance messages about fate. Sermons and community discussions can stress that crashes are preventable and influenced by human choices.
Valuation of motorized transport over walking: The low status of walking endangers pedestrians and skews investments. Policymakers and planners should prioritize e.g. sidewalks, crossings, and safe routes to school, while public campaigns can reframe walking as modern, healthy, and socially respected.
Freedom to take risk: Freedom attitudes may make it harder to introduce safety measures. Political leaders should frame regulations (e.g., speed limits, seatbelt enforcement) not as restrictions, but as protections for the community, e.g. through evidence from Safe System countries.
Descriptive norms: Road users’ violations are related to their perceptions of other road users’ violations. Enforcement must be visible, consistent, and publicized to deter violations. It is also crucial to battle corruption, and perceptions that it is possible to pay to avoid legal sanctions for violations.
CRediT contribution statement
Tor-Olav Nævestad: Conceptualization, Formal analysis, Funding acquisition, Investigation, Methodology, Project administration, Writing—original draft, Writing—review & editing. Sonja Forward: Conceptualization, Formal analysis, Funding acquisition, Investigation, Methodology. Enoch F. Sam: Conceptualization, Formal analysis, Funding acquisition, Investigation, Methodology, Project administration, Writing—original draft. Jaqueline Masaki: Conceptualization, Formal analysis, Funding acquisition, Investigation, Methodology, Project administration, Writing—original draft. Daniel Mwamba: Investigation, Methodology, Writing—original draft. Thomas Miyoba: Investigation, Methodology, Writing—original draft. Filbert Francis: Investigation, Methodology, Writing—original draft. Anthony Fiangor: Investigation, Methodology, Writing—original draft. Jenny Blom: Investigation, Methodology, Writing—original draft. Ingeborg Storesund Hesjevoll: Investigation, Methodology, Writing—original draft. Aliaksei Laureshyn: Funding acquisition, Investigation, Methodology, Project administration, Writing—original draft.
Declaration of competing interests
The authors report no competing interests.
Funding
The present study is part of the EU-funded AfroSAFE project (Grant agreement ID: 101069500). The primary objective of the AfroSAFE project is to make a significant progress in propagation of the Safe System modus operandi within the road safety work context in African countries.
Acknowledgements
We are very thankful to all the people who have contributed to the data collection in the participating countries, and all the respondents who have helped us by answering our survey. The present paper presents data from a larger study, which is presented in a EU-deliverable: Nævestad et al (2024): “Deliverable 5.2: Mapping of Road Safety Culture”.
Declaration of generative AI use in writing
During the preparation of this work the authors used Chat GPT to check and improve language and highlight parts of the text that involved repetition and/or too detailed information, and which could be removed, or moved to the appendix. The language check involved checking grammatical errors and overly long or complex sentences or paragraphs. This was used to shorten the paper. The output was reviewed and revised by the authors who take full responsibility for the content of the publication.
Ethics statement
The methods for data collection in the present project have been approved by Norwegian Agency for Shared Services in Education and Research (SIKT)which assists researchers with research ethics of data gathering, data analysis, and issues of methodology.
Editorial information
Handling editor: Mette Møller, Technical University of Denmark, Denmark
Reviewers: Ravi Shankar, National Institute of Technology Warangal, India; Nicholas John Ward, Leidos, the United States of America; Wouter Van den Berghe, Tilkon Research & Consulting, Belgium
Appendixes
A1. Recruitment of respondents
The survey data in the three African countries was collected through personal interviews in Lusaka, Accra and Dar es Salaam. Accessing respondents through web surveys was not feasible in these countries, as only a few people have e-mails and internet access. Furthermore, the availability of e-mails and access to internet is likely higher for people in favourable economic positions and/or with high levels of education. To obtain representative samples of pedestrians and car drivers, teams of interviewers therefore went out in traffic to recruit respondents to participate in personal survey interviews. In some cases, respondents who were in a hurry were given the link to the survey, so they could answer the survey in their home. To maintain representativity, interviewers ensured to recruit respondents in different areas of the cities and at different times. We assumed that this would make them avoid recruiting only particular segments of road users.
The Norwegian respondents were recruited from a subset of a random population sample, who resided in the Capital Oslo, and who have agreed to participate in surveys from the Institute of Transport Economics. The Swedish and Dutch respondents were recruited from samples of respondents from Stockholm and Amsterdam, using nationally representative panels of respondents from the company Norstat. Norstat is a leading European data collector for market research, which offer access to over 4 million respondents across 19 countries. Surveys were collected using the official languages in all countries, i.e. English in Ghana and Zambia, Swahili in Tanzania, Dutch, Swedish and Norwegian. Professional translators were used, and translations were tested and validated by native speakers, who are traffic researchers. In an attempt to increase response rates, Norwegian respondents were informed that they could participate in a draw for a present card of 3000 NOK (260 Euro), if they wanted to. The Norstat respondents in Sweden and Netherlands are in panels, and get points for participating in surveys.
Respondents in the survey were filtered in two steps. First, the present study only includes results for respondents whose nationality matches the country of data collection. The reason is that we focus on questions related to national RSC. Previous studies have indicated that respondents who are immigrants in their country might rate different factors higher than domestic respondents, e.g. due to deference to authority and their immigrant status (Guldenmund et al., 2013). Second, we have filtered out 353 respondents who answered the survey in less than 2,5 minutes, which is approximately the time it takes to read the questions (e.g. 300 milliseconds per word) (Zhang & Conrad, 2014); these respondents are assumed to not have read the questions and answers sufficiently.
A2. Survey themes
Demographic variables. All respondents were asked questions about age, gender, nationality and education. Car drivers were also asked questions about experience as a driver, kilometres driven with private vehicle in the last two years, car type, where they usually drive etc. For pedestrians we asked how often they walk as a means of transport to reach destinations (e.g. from their home to work, to the shop etc), for how many minutes they usually walk on a typical day where they walk as a means of transport, and what types of roads that they usually walk on.
Road safety behaviours. Car drivers. The study includes 12 questions on road safety violations for car drivers (cf. Appendix A3). Some of these were taken from the DBQ and based on the results of previous research (Wallen Nævestad et al., 2019; Warner et al., 2011). Behaviour questions were also tested in an African context in the pilot study of bus drivers in Norway and Ghana (Nævestad et al., 2025). We also included some additional behaviour questions based on our focus group interviews with African stakeholders. These were e.g. about not stopping for pedestrians, and overtaking vehicles when the driver does not have a clear view of oncoming traffic. Factor analyses of the 12 items for private car drivers from all the six countries indicated two factors: one with 10 items about different types of violations and risk taking, with the factors related to aggressive violations and lacking seat belt use with the highest factor loadings. The second factor in the factor analysis included the two items about speeding (in and outside residential areas). We made a sum score index based on the first ten items (min:10, Max:70). (Cronbach’s α= .831), and a sum score index for the two questions about speeding (Cronbach’s α= .523) (min:2, Max:14). The low alpha value might be related to the fact that there are only two items in the scale.
Road safety behaviours. Pedestrians. The survey included four questions about aggressive pedestrian behaviours (cf. Appendix 1). These questions are based on the PBQ, and have been found to predict accident involvement (McIlroy et al., 2020). The four questions were combined into a sum score index (min:4, Max:20) (Cronbach’s α=.720). The survey also included two questions about positive pedestrian behaviours (thanking drivers who let pedestrians pass), but we do not use these due to issues with the items that were reversed.
The DBQ and the PBQ response options were changed from relative to absolute alternatives (e.g. Question: “For every ten trips, how often do you …?”, Alternative answers: 1) “Never”, 2) “Once or twice”, 3) “Three or four times”, 4) “Five or six times”, 5)“Seven or eight times”, 6) “More than eight times but not always”, 7) “Always”). Answer alternatives were changed, as previous research indicates that different demographic groups tend to interpret questions and formulations differently (i.e. what does “often” mean?) (Bjørnskau & Sagberg, 2005). The interpretation of e.g. “often” and “very often” is likely related to what the respondent believes to be common, which according to previous research differs among the groups we compare. Therefore, we use absolute answer alternatives on these questions.
National RSC measured as descriptive norms. We measure national RSC as descriptive norms (Cialdini et al., 1990), reflecting drivers’ perceptions of what other drivers in our country do. These include questions on expectations to other road users, and were common among respondents in both the survey to car drivers and pedestrians. We include two measures of descriptive norms (cf. Appendix A3). The first sum score index includes five questions, which were chosen as these questions were common both in the car driver sample and the pedestrian sample (min:5, Max:25). (Cronbach’s Alpha: .798). We also present results for another question on descriptive norms question refers to speeding on residential roads (min:2, Max:14). This is shown separately, as previous research and factor analyses, show different tendencies for speeding violations vs. other road violations in African and European countries (cf. Torfs et al., 2021). The questions were introduced like this: “When walking on roads in my country, I expect the following behaviour from other drivers:” For car drivers, “walking” was replaced with “driving”.
National RSC measured as fatalistic beliefs. The second element of RSC that we focus on is fatalistic beliefs related to road safety. The survey includes six statements about fatalistic beliefs (cf. Appendix A3). These questions are based on and build further on questions from a study presented by Emanuel Kofi Adanu, in the 2023 ICTCT AfroSAFE conference in Winneba in June 2023. The five questions were combined into a sum score index (min:6, Max:30). (Cronbach’s Alpha: .828). The answer alternatives ranged between 1 (Totally disagree) and 5 (Totally agree).
National RSC measured as attitudes related to freedom to take risk in traffic. The survey included two questions measuring attitudes related to individual freedom to take risk in traffic (cf. Appendix 3). The two questions were combined into a sum score index (min:2, Max:10). (Cronbach’s Alpha: .539). We keep this index, in spite of the low internal consistency, as we have used this index in previous studies (e.g. Nævestad et al., 2022), and as it only consists of two items (where Cronbach’s Alpha measurements may be seen as less relevant). Five answer alternatives ranged between 1 (Totally disagree) and 5 (Totally agree).
National RSC measured as the valuation of motorized transport vs. walking. The survey included two questions measuring the valuation of motorized transport vs. walking (cf. Appendix A3). Responses were given on a 5-point scale from Totally disagree (1) to Totally agree (5).
Safety outcomes. For car drivers, accident involvement while driving in the last two years was assessed using four answer alternatives: 1) no, 2) yes involving property damage, 3) yes, involving personal injuries, 4) yes, involving fatal injuries. Responses were combined into two values: 1) No accident involvement, 2) Yes, some accident involvement (with property damage or person injuries of any severity).
A3. Survey questions, means and standard deviations
| Indexes and items | Country | ||||
|---|---|---|---|---|---|
| European | African | ||||
| M | SD. | M | SD. | p | |
| Road safety violations car drivers (10 item scale) | 13.1 | 3.9 | 20.9 | 10.5 | < .001 |
| Become angered by a certain type of driver and indicate your hostility by whatever means you can | 1.8 | 1.0 | 2.6 | 1.9 | < .001 |
| Sound your horn to indicate your annoyance to another road user | 1.4 | 0.7 | 3.4 | 2.1 | < .001 |
| Pull out of a junction so far that the driver with right of way has to stop and let you out | 1.2 | 0.7 | 1.8 | 1.4 | < .001 |
| Drive when you suspect you might be over the legal blood alcohol limit | 1.1 | 0.4 | 1.5 | 1.1 | < .001 |
| Drive without using a seat belt | 1.1 | 0.6 | 2.4 | 1.9 | < .001 |
| Race away from traffic lights so you can get in front of the driver next to you | 1.5 | 0.9 | 1.6 | 1.2 | < .001 |
| Become angered by another driver and give chase with the intention of giving him/her a piece of your mind | 1.1 | 0.4 | 2.2 | 2.0 | < .001 |
| Overtake a slow driver on the inappropriate side | 1.5 | 1.0 | 2.0 | 1.8 | < .001 |
| Don't stop for pedestrians at pedestrian crossings | 1.4 | 1.3 | 1.8 | 1.4 | < .001 |
| Overtake a vehicle when you do not have a clear view of the oncoming traffic (e.g. before bends, hill tops) | 1.1 | 0.4 | 1.5 | 1.2 | < .001 |
| Road safety violations car drivers (2-item speeding scale) | 4.8 | 2.8 | 3.9 | 2.7 | < .001 |
| Disregard the speed limit on residential roads | 2.3 | 1.9 | 1.8 | 1.4 | < .001 |
| Disregard the speed limit on motorways | 2.6 | 1.7 | 2.1 | 1.7 | < .001 |
| Pedestrian violations index (4 items) | 5.1 | 1.9 | 6.2 | 3.5 | < .001 |
| I get angry with another road user (pedestrian, driver etc.), and I yell at them | 1.5 | 0.8 | 1.7 | 1.2 | < .001 |
| I get angry with another road user (pedestrian, driver etc.), and I make a hand gesture | 1.4 | 0.7 | 1.7 | 1.3 | < .001 |
| I get angry with a driver and hit their vehicle | 1.1 | 0.4 | 1.5 | 1.2 | < .001 |
| I cross very slowly to annoy a driver | 1.2 | 0.6 | 1.4 | 1.1 | < .001 |
| Descriptive norms index – violations (5 items) | |||||
| That they become angered by a certain type of driver and indicate their hostility by whatever means they can | 1.7 | 0.9 | 2.0 | 1.3 | < .001 |
| That they sound their horn to indicate their annoyance to another road user | 1.7 | 0.9 | 2.7 | 1.4 | < .001 |
| That they overtake a slow driver on the inappropriate side | 1.8 | 1.0 | 1.8 | 1.2 | n.s |
| That they drive when they suspect they might be over the legal blood alcohol limit | 1.4 | 0.8 | 1.5 | 0.9 | 0.090 |
| That they drive without using a seatbelt | 1.3 | 0.7 | 2.2 | 1.4 | < .001 |
| Descriptive norms – speeding (1 item) | |||||
| That they disregard the speed limit on residential roads | 2.2 | 1.1 | 1.8 | 1.2 | < .001 |
| Fatalistic beliefs index (6 items) | 8.1 | 3.6 | 17.8 | 5.5 | < .001 |
| I believe that some people die in road crashes as punishment for some bad deeds | 1.4 | 0.9 | 2.8 | 1.7 | < .001 |
| I believe that spiritual intervention, such as prayers, can prevent road crashes | 1.3 | 0.8 | 3.6 | 1.6 | < .001 |
| I pray before embarking on a journey | 1.3 | 0.9 | 4.2 | 1.1 | < .001 |
| I believe that road crashes are the will of God | 1.2 | 0.6 | 2.5 | 1.6 | < .001 |
| Human beings cannot do anything to prevent people from dying in traffic | 1.4 | 0.9 | 2.0 | 1.4 | < .001 |
| People cannot prevent their own death (e.g. in road crashes), they die when it is their time to die | 1.6 | 1.1 | 2.7 | 1.7 | < .001 |
| Valuation of freedom to take risk in traffic index (2 items) | 3.4 | 1.9 | 4.0 | 2.3 | < .001 |
| Drivers should be able to do whatever they want in traffic, as long as they do not expose others to risk | 1.7 | 1.1 | 1.8 | 1.4 | < .001 |
| A skilled driver can take more risks than others | 1.7 | 1.1 | 2.1 | 1.5 | < .001 |
| Valuation of motorized transport over walking and pedestrians | |||||
| People who drive a car to their job is respected more than people who walk to their job | 2.0 | 1.1 | 3.9 | 1.4 | < .001 |
| The road system in my country is made for cars and not for pedestrians | 3.0 | 1.2 | 3.1 | 1.6 | .093 |
A4. Additional details about respondent demographics
Table A4.1 shows the distribution of the respondents in different age groups. European respondents are generally older than the African respondents. When we look at the car drivers, we see that there are three times more respondents in the age group over 55 years old in the European sample, and more respondents between 26 and 45 years old in the African sample. When we look at the pedestrians, we see that there are ten times more respondents in the age group over 55 years old in the European sample, and three times more respondents under 26 years old in the African sample.
| Group | <26 yrs | 26-35 yrs | 36-45 yrs | 46-55 yrs | >55 yrs | TOTAL |
|---|---|---|---|---|---|---|
| Car Africa | 11% | 34% | 30% | 18% | 7% | 789 |
| Car Europe | 7% | 21% | 17% | 21% | 33% | 1121 |
| Pedestrian Africa | 31% | 38% | 19% | 9% | 3% | 753 |
| Pedestrian Europe | 8% | 21% | 18% | 22% | 32% | 1109 |
| TOTAL | 13% | 27% | 20% | 18% | 21% | 3772 |
Table A4.2 shows the highest educational level obtained by the respondents in the different groups. Respondents were asked: “What is your highest education?”[2]. There are relatively similar levels of education among the different groups, although there are higher shares of respondents in the lowest education level among the African pedestrians. Moreover, the education level among the pedestrians in Europe is higher than for the African pedestrians.
| Primary school | High school | University 3-4 yrs | University 5 yrs | TOTAL | |
|---|---|---|---|---|---|
| Car Africa | 7% | 25% | 23% | 45% | 789 |
| Car Europe | 1% | 22% | 37% | 40% | 1121 |
| Pedestrian Africa | 12% | 36% | 19% | 32% | 753 |
| Pedestrian Europe | 2% | 23% | 36% | 39% | 1109 |
| TOTAL | 5% | 26% | 30% | 39% | 3772 |
A5. Factors influencing the elements of road safety culture
A5.1. Factors influencing descriptive norms.
The level of enforcement. During the focus groups several examples of behavior that violates traffic rules where mentioned: speeding, running red lights, driving without seat belt or helmet, wrongful overtaking, overloading, using the phone while driving, driving in the dark without lights on, failure to comply with the duty to give way and abuse of alcohol. In addition to these behaviors, a typical behavior described by several participants was a lack of respect for other motorists often attributed to being in a rush and having a need to catch up with time. It was mentioned that this often may lead to dangerous overtaking and risk taking in traffic. In general, the enforcement of the traffic police was viewed as insufficient:
“We need to put more effort in terms of legislation as well as enforcement to ensure that the behavior of the drivers is safe enough to prevent accidents.”
Interviewees attributed lacking enforcement partly to lack of resources in the police. Additionally, corruption was mentioned as a hindrance for effective enforcement of traffic rules. Examples were mentioned of traffic police abusing enforcement measures, like police check points, to raise money for themselves, or examples with police being bought off to drop cases.
Road infrastructure. As with the fieldwork data, the interview data indicates less developed safe system solutions in the road infrastructure in the African countries. Lack of roundabouts, less red-light regulation and lack of road markings was mentioned during the focus groups. In addition, undivided roads, poor lighting, and single carriageways were mentioned when discussion contributing factors to road accidents.
Urban planning, road capacity and congestion. Heavy congestion and poor road capacity were mentioned as obstacles for traffic. The lack of road capacity was linked to insufficient or low urban planning. Interviewees mentioned the challenge of increasing car ownership in the population, which has not been followed by increased road capacity:
“a lot of people with access to money have decided to invest in their own vehicles… we […] have unregulated overpopulation or subscription of low-capacity vehicles competing for limited road space to drive on because our roads in the country are not expanding.”
Encroachment was mentioned as a factor contribution to congestion. It was emphasized that motorized road users typically have a sense of urgency and a need to “rush ahead”, that creates dangerous situations with wrongful overtaking and speeding. Especially motorcyclist where describes as “impatient” due to time pressure.
The composition of road users. It was mentioned in the interviews that the African countries have a high share of motorcyclists, which makes the traffic picture more chaotic, with more conflicts between road users.
Formal driver training. Workshop participants stated that there is lack of knowledge of traffic rules by all road users, also vulnerable road users. It is also an issue that road users do not consider the traffic rules as adhering to them.
A5.2. Factors influencing fatalistic beliefs
Although fatalistic beliefs were only briefly mentioned in focus group interviews, they emerged more clearly during fieldwork and informal discussions in several African countries. These accounts suggest that such beliefs influence how accidents are interpreted and how individuals seek protection in traffic. At a road safety conference in an African country, participants described traditional beliefs in which the souls of crash victims remain at the accident site until released through rituals, such as offering a goat. Without such rituals, these souls are believed to cause further accidents. One widely known case involved a high level social figure who returned to a fatal crash site to perform such a ritual. Fatalistic and superstitious beliefs also affect everyday travel behavior. Some bus drivers carry protective amulets, and passengers often choose seats accordingly, particularly favoring the seat behind the driver, believed to be safest due to the driver’s spiritual protections. These examples suggest that culturally rooted beliefs, though not always explicitly expressed, may significantly influence road user behavior.
A5.3. Factors influencing freedom to take risk attitudes
This issue was only to a low extent covered in the focus group interviews. During fieldworks and interviews related to these in the African countries, we learned of many examples of politicians who wanted to make changes to roads or infrastructure, but who were impeded from doing this by the voting public. This could happen directly, e.g. as large groups of voters organized and campaigned against suggested changes and reforms. Sometimes large groups of drivers, or car owner unions grouped against the government to protest to new rules, (including rules aiming to improve road safety). This could indicate that road safety measures to a considerable extent is impeded by the populations’ attitudes focusing on freedom to take risk and skepticism towards paternalistic measures in the African countries. An example of this which was mentioned was politicians’ efforts to remove hawkers from the roads, as high numbers of pedestrian salespeople on high-speed roads might lead to accidents. We also learned of an example where a national government in an African country had tried to implement a measure to improve safety in professional transport, which was revoked due to popular demand from driver unions. In the fieldworks and interviews related to these, it was stressed that politicians “always think about the next election”, and that they therefore might be afraid to implement unpopular measures.
A5.4. Factors influencing the valuation of motorized transport vs. walking.
Several participants in the focus group interviews in the studied African countries stressed that car driving is valued higher than walking, and that walking as a separate mode of transport is not sufficiently recognized by society. Several participants stressed that this is reflected in the road infrastructure, which is not sufficiently safe for, or adapted to vulnerable road users, because of a lack of sidewalks, crosswalks and pedestrian crossings. There are often no protective barriers or railings to protect pedestrian and cyclist from vehicular traffic. It was also mentioned that the lower valuation of pedestrians also is related to, and reflected in larger framework conditions, like urban planning and development of public transport systems. It was mentioned that poor public transport systems weaken the mobility of vulnerable road users, and that a lack of a viable organized public transport system contributes to more car driving and more congestion on the roads. There is potential of working with public transport systems to “promote safe and active mobility and safe space for all those that want to use the road”. Several participants described that a lot of people have lost their trust in public transport and that they, if possible, prefer to buy their own vehicles. For some, driving their own car is viewed as safer than traveling by public transport. Each year, several buses are involved in fatal crashes.
The numbers are based on estimates from WHO (2024). The estimates from WHO are different from the official numbers of fatal accidents reported by national authorities, especially in the African countries. In Tanzania, the WHO estimated number of road fatalities is seven times higher than the official number reported by national authorities. ↩︎
The answer alternatives were slightly different in the European and the African samples for education, due to a perceived need for national adaptation. Answer alternative 3 in the African sample was “Professional school / Technological university”. The fourth alternative in the African sample was “University (tertiary)”. Thus, the category university is not fully comparable across national contexts. ↩︎