Predicting injury severity in vehicle-to-pedestrian collisions: evidence from Madhya Pradesh state, India
Abstract
The present research examines characteristics of vehicle-to-pedestrian collisions and assesses the factors affecting such crashes in Madhya Pradesh using accident record data from Madhya Pradesh Road Development Corporation and Accident Response System, encompassing 6104 accident entries across 16 variables. To address data heterogeneity, Latent Class Clustering was employed, and a Random Forest Algorithm was used for predictive modelling to accurately classify injury severity based on various predictors. The latent clustering identified three distinct classes: Class 1 (27.7%) associated with fewer severe injuries, attributed to effective traffic controls; Class 2 (8.7%), characterized by reduced injury rates, linked to well-organized traffic systems; and Class 3 (63.5%), which showed a higher incidence of severe injuries, primarily due to narrow, poorly designed, or infrastructure-deficient roads and excessive speeding. The Random Forest Classifier effectively used predictors such as age, gender, violation type, traffic control, and vehicle type, achieving 97.2% precision and 89.2% recall, and an overall accuracy of 88.8%. The Decision Tree model further highlighted the relative importance of each variable in predicting injury severity. The model’s performance was benchmarked against baseline classifiers including logistic regression, Support Vector Machine, and Decision Tree, confirming the superior accuracy and robustness of the Random Forest approach. This study emphasizes the need for proactive road safety measures and provides a robust analytical framework for injury severity classification, supporting the development of targeted interventions to improve pedestrian safety in India.
1. Introduction
Pedestrian safety in urban areas is a critical issue worldwide, especially in developing countries like India, where road traffic accidents are the leading cause of death and injury (MoRTH, 2020). Vehicle-to-pedestrian crashes are a major concern, and in the case of Madhya Pradesh, pedestrian fatalities have increased significantly over the last decade. In 2020, pedestrians accounted for around 18% of all road-related fatalities in India (MoRTH, 2020), which underscores the need for targeted interventions. According to the WHO (2023), although low-and middle-income countries account for only about 60% of the world’s vehicles, they bear a disproportionately high burden-accounting for 92% of global road traffic fatalities. Moreover, over half of all road traffic deaths involve vulnerable road users, including pedestrians, motorcyclists, and cyclists.
The present study focuses on identifying high-risk areas, times, and demographic groups of vehicle-to-pedestrian crashes in Madhya Pradesh. It employs Latent Class Analysis (LCA) and machine learning techniques- specifically the Random Forest Algorithm-on crash data collected between 2019 to 2023. These advanced statistical methods allow for a deeper exploration of the heterogeneous nature of pedestrian crashes and enable the modelling of complex relationships among crash-related variables. The primary objectives of this study are to (a) uncover heterogeneity in crash data by identifying statistically distinct subgroups (latent classes), and (b) analyze the factors influencing injury severity using machine learning techniques.
The variables examined include pedestrian characteristics (age, gender, injury severity), crash-related aspects (location, time, weather), and environmental elements (road conditions, lighting, setting). Based on these analyses, the study aims to provide evidence-based recommendations for improving pedestrian safety and reducing the frequency and severity of crashes in the state.
Findings from the study are expected to contribute to effective policies and interventions that reduce pedestrian injuries and fatalities, not only in Madhya Pradesh but also in other parts of India. Additionally, the study adds to the growing body of literature on pedestrian safety by applying a novel combination of Latent Class Analysis (LCA) and Random Forest modelling to explore injury severity outcomes.
Unlike conventional models that assume crash data is homogenous, this approach captures unobserved heterogeneity by identifying latent crash profiles and linking them to behavioural and environmental factors. Importantly, the study utilizes real-world crash data from Madhya Pradesh, offering valuable insights into pedestrian safety within the context of mixed-traffic environments and developing country settings, where challenges such as three-wheeler dominance, narrow rural roads, and infrastructure deficits are prevalent. The results offer a data-driven foundation for class-specific road safety interventions, making the findings directly applicable to transportation planning and policy formulation in resource-constrained settings. The major specific contributions of the present study are:
The study employs a hybrid methodological framework combining Latent Class Analysis (LCA) with a Random Forest Classifier. This dual approach enables us to both uncover hidden patterns in pedestrians’ crash data and accurately predict injury severity-addressing heterogeneity that traditional models often overlook.
The research is based on crash data from Madhya Pradesh, India, which is characterized by mixed traffic conditions, the involvement of three-wheelers, and variable infrastructure quality. These features are typical of many low-and middle-income countries but are underrepresented in global traffic safety literature.
By identifying three distinct latent classes of crashes, the study provides a targeted framework for intervention. Each class is associated with specific road types, vehicle categories, and driver behaviours, offering clear guidance for tailored safety improvements.
The findings are directly translated into class-specific policy and engineering recommendations, making the study not only theoretically valuable but also highly actionable for practitioners and policymakers.
2. Literature review
Numerous studies have examined the analysis of pedestrian crashes. These studies have centred on exploring the features of pedestrian accidents, pinpointing the risk elements associated with injury severity levels, and forecasting pedestrian crashes using various models. Previous research has revealed that an array of factors, such as behavioural, roadway, and environmental elements, could influence the frequency and seriousness of pedestrian crashes.
For example, Sun et al. (2019) utilized a Latent Class Cluster (LCC) model to segment pedestrian crashes in Louisiana from 200 6 to 2015, followed by Multinomial Logit (MNL) models to identify key determinants of crash severity. Zhu et al. (2023) examined pedestrian and bicyclist crash patterns using latent class clustering and random first algorithms, highlighting socioeconomic disparities in driver-victim interactions. Similarly, Samerei & Aghabayk (2024) proposed a hybrid framework that combines interpretable machine learning models with random parameter logit models to evaluate factors contributing to chain-reaction crash risk-an approach particularly relevant to countries like India where crash tends to be complex and heterogeneous. In the context of low-and middle-income countries, Bullard et al. (2024) applied latent class clustering to pedestrian-vehicle crash data from Ghana, successfully identifying vulnerable pedestrian subgroups. The study serves as a valuable methodological reference for developing countries pursuing data-driven road safety interventions. Additionally, Salehian et al. (2023) used latent class clustering and ordered probit models to compare rural pedestrian crashes at intersections and non-intersections using latent class clustering and ordered probit models.
Vulnerable Road Users (VRUs), such as pedestrians and bicyclists, face higher injury risks than drivers due to less protection. Implicit VRUs from certain demographic and economic backgrounds are more likely to be involved in crashes or experience severe outcomes. Zhu et al. (2023) applied Latent Class Clustering Analysis (LCA) to classify pedestrian and bicyclist crashes based on socioeconomic characteristics of drivers and victims. They used Random Forest algorithms and Partial Dependence Plots to model and interpret the contributing factors influencing crash outcomes. The study revealed lower-income, non-white drivers often crash with lower-income, non-white victims, while higher-income, white drivers tend to crash with higher-income, white victims. These findings suggest distinct socioeconomic patterns in pedestrian and bicyclist collisions. Although cyclists are classified as vulnerable road users, cycling is increasingly promoted due to its environmental sustainability. In India, bicycles play a crucial role in providing affordable mobility, particularly for the urban poor. Despite their importance, cyclists also face a high risk of injuries and fatalities on the roads. Previous research has identified several factors that influence the severity of pedestrian-vehicle crashes (Chen et al., 2017, Li et al., 2016, Ragland et al., 2013, Reynolds et al., 2009). However, much of this research has been conducted in high-income countries and may not fully apply to the Indian context, where road conditions, traffic patterns, and cultural factors may differ significantly (Sivasankaran et al, 2020). Another study identifies factors contributing to crash hotspots with annual uptrends in North Carolina (2007-2018) using spatiotemporal analysis techniques, specifically the Getis-Ord Gi index and Mann-Kendall trend test. It focuses on pedestrian crash heterogeneity to improve outcomes at hotspots (Song Li et al., 2021). The research combines latent class clustering with random parameter logit approaches, addressing unobserved heterogeneity and identifying specific factors for each class. The study provides a framework for identifying accident-prone areas by examining spatiotemporal trends and crash-contributing factors, aiding in pinpointing and mitigating crash hotspots. Traffic crashes, particularly in developing countries like Iran, are a growing global concern with millions of fatalities and injuries annually. Samerei et al. (2024) developed a framework combining interpretable machine learning and random parameter logit models to analyze factors influencing this transition. The study employs a hybrid approach integrating statistical modelling (SM), machine learning (ML), and latent class clustering (LCC). The study emphasizes identifying factors leading to Chain-Reaction Crashes (CRCs), recommending dynamic speed limits and improved road safety measures. This methodology, validated over a 5-year dataset from suburban freeways in Iran, is adaptable for analyzing variable influences in other fields, with future research exploring integrated techniques and larger datasets.
Pedestrians are highly vulnerable road users. In the UK, around 1700 road fatalities occur annually, with pedestrians accounting for approximately 20% of these deaths (Salehian et al., 2023). The study by Salehian et al. focuses on pedestrian safety on rural UK roads between 2015 and 2019, distinguishing between crashes at intersections and non-intersections to identify contributing factors and develop targeted interventions. Rural pedestrian crashes have received less attention compared to urban areas, despite higher fatality rates in rural regions due to factors like higher driving speeds and fewer pedestrian amenities. Various factors were found to have distinct effects on the severity of pedestrian injuries at intersections and non-intersections in rural UK areas. Parameters such as pedestrian location, day of the week, road type, and driver characteristics significantly influenced pedestrian crash severity. Pedestrians aged over 65 years and under 15 years, drivers under 25 years, male drivers and pedestrians, darkness, heavy vehicles, and high-speed limits were significant factors in both intersection and non-intersection pedestrian crashes. They emphasized disaggregating data to enhance road safety and protect vulnerable road users, proposing interventions such as improving lighting, pedestrian infrastructure, and speed limit reductions in high-risk areas.
Pedestrians are highly vulnerable in traffic incidents, with over 2000 pedestrian-vehicle crashes reported annually in North Carolina, causing significant social and economic impacts. Various factors like alcohol influence, head injuries, demographics, roadway characteristics, and environmental factors contribute to pedestrian safety issues (Chang et al., 2019). Heterogeneity in crash data complicates the accurate identification of factors affecting injury severity, potentially leading to biased estimations. Pedestrian and cyclist fatalities represent a major share of road traffic deaths in low-and middle-income countries (LMICs). In Ghana, the prevalence of pedestrian crashes highlights the urgent need for targeted interventions. While prior research has examined pedestrian perceptions and injury severity, limited attention has been given to identifying distinct pedestrian subgroups involved in crashes. Addressing this gap, Bullard et al. (2024) employed Latent Class Analysis (LCA) to categorize pedestrian crash profiles and analyze associated injury severities, with the goal of informing data-driven safety strategies. Thus, research on vehicle-to-pedestrian crashes in Madhya Pradesh is limited, particularly in leveraging advanced analytical frameworks to uncover insights. Existing studies often overlook the spatial and temporal dimensions of such crashes, which are critical for effective accident response systems. Moreover, there is a lack of systematic exploration of heterogeneous crash characteristics using methods like Latent Class Analysis. While some research identifies crash factors, few studies employ robust machine learning techniques such as Random Forest Models to prioritize and rank these factors effectively. This gap highlights the need for an integrated approach combining advanced statistical and AI methods to improve pedestrian safety interventions.
3. Methodology
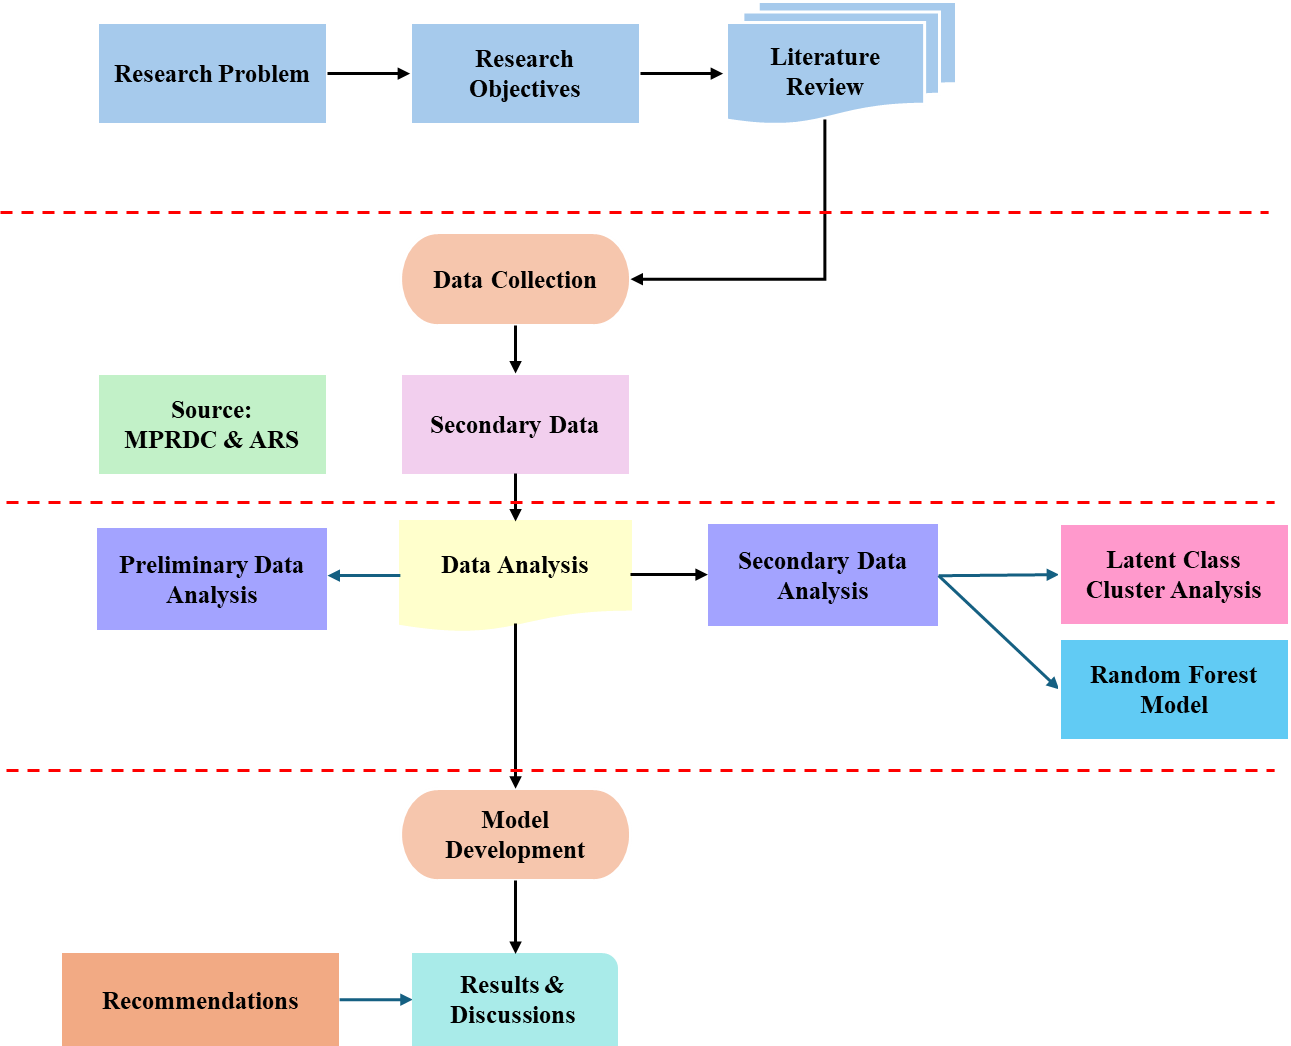
The study investigates vehicle-to-pedestrian collisions in Madhya Pradesh using a dataset comprising 6104 accident records collected from the Madhya Pradesh Road Development Corporation (MPRDC) and the Accident Response System. The dataset includes 16 variables, such as age, gender, vehicle type, violation type, and traffic control features. The methodological framework involves five key steps, as illustrated in Figure 1. First, data pre-processing was conducted to handle missing values, identify and treat outliers, and select relevant predictors. Second, Latent Class Analysis (LCA) was employed to segment the dataset into statistically meaningful subgroups based on shared crash characteristics, thereby addressing heterogeneity in crash patterns. Third, a Random Forest Classifier was applied to predict injury severity and assess the relative importance of key variables. To ensure robustness, the dataset was divided into training and testing subsets, and k-fold cross-validation was used to enhance generalizability and model reliability. Finally, the results were analysed to identify critical determinants of pedestrian injury severity, providing an evidence base for targeted interventions in infrastructure design and traffic management.
3.1 Data collection
The most crucial aspect of any research project is the collection and extraction of data. The process of extracting data was both time-consuming and demanding. Data collection for the vehicle-to-pedestrian study was conducted. The accident data for this study was collected from the Madhya Pradesh Road Development Corporation (MPRDC) and comprises approximately 6000 entries. The dataset includes detailed information on various variables related to road accidents, such as the age of the individuals involved, age of the vehicles, type of vehicles, gender of the individuals, time of the day when the accident occurred, type of violation, surface condition at the time of the accident, type of injury sustained, and other relevant details. The data collection process involved accessing MPRDC's records and databases, which provided comprehensive information on road accidents in the region. The dataset was collected over a specified period to ensure a representative sample and comprehensive coverage of accident incidents. This dataset is crucial for understanding the factors contributing to road accidents in Madhya Pradesh and forms the basis for the subsequent analysis using latent class analysis to identify patterns and trends within the data.
While the dataset obtained from the Madhya Pradesh Road Development Corporation (MPRDC) and the Accident Response System offers valuable insights into vehicle-to-pedestrian crashes, it is important to note that reporting coverage may be more robust along national highways, state highways, and major district roads. This may lead to potential underreporting or omission of crashes in dense urban neighbourhoods or remote rural areas where formal reporting systems are limited. As such, the dataset might exhibit some geographic bias toward better-connected road networks.
3.2 Variable selection
Crash data for this study is obtained from Madhya Pradesh Road Development Corporation and Accident Response System database, limiting the scope of pedestrian accidents between 2019 to 2023. To prevent redundancy variables like pedestrian city, state, and zip code are dropped for clarity. The study focused on the factors that influence the severity of vehicle-to-pedestrian collisions, including pedestrian characteristics such as age, gender, availability of footpath, traffic violations, number of injuries and severity, crash specifics like time, location, surface condition, vehicle type, and environmental factors such as season, weather, lighting, and rural/urban setting.
To assess geographic variation, location-related attributes were extracted to categorize crash sites as urban, suburban, or rural based on administrative tagging and road function classification. Preliminary analysis indicates that approximately 41.2% of recorded crashes occurred in rural regions, 38% in urban zones, and the remaining 20.3% in suburban corridors. This provides a reasonable distribution across different settlement typologies in the state, although the likelihood for reporting bias in lower density or informal areas is acknowledged. Table 1 summarizes the distribution of pedestrian crash outcomes by key demographic; behavioural, vehicular, and roadway-related variables. Percentages under each injury severity category represent the proportion of crashes within that subgroup resulting in no injury, minor injury, or grievous injury.
| Variables | Total crashes | No injury | Minor injured | Grievously injured |
|---|---|---|---|---|
| Driver Age | ||||
| Under 20 | 0.90% | 3.70% | 11.11% | 77.77% |
| 21-30 | 29.40% | 0.45% | 40.65% | 55.15% |
| 31-40 | 46% | 0.94% | 38.00% | 57% |
| 41-50 | 19.40% | 1.71% | 36.25% | 59.29% |
| 51-60 | 3.60% | 0 | 26.23% | 71.95% |
| Over 60 | 2.03% | 0 | 0 | 100% |
| Driver gender | ||||
| Male | 99.63% | 0.93% | 4.01% | 95.03% |
| Female | 0.36% | 0 | 0 | 100% |
| Illegal behaviour | ||||
| No violation | 32.00% | 1.14% | 5.93% | 92.93% |
| Jumping redlight | 0.66% | 0.00% | 44.00% | 66.00% |
| Over speeding | 61% | 0.60% | 38.65% | 57.59% |
| Drunken drive | 1.66% | 0.00% | 37.25% | 62.75% |
| Use of mobile phones | 4.68% | 0.42% | 42.58% | 53.30% |
| Vehicle Type | ||||
| Motorised two-wheeler | 54.10% | 1.23% | 35.29% | 58.37% |
| Car/Jeep/Van | 27.06% | 0.86% | 34.58% | 61.98% |
| Truck/bus | 18.83% | 0.17% | 2.83% | 97% |
| Road type | ||||
| Major district road | 22.90% | 2.77% | 7.42% | 89.51% |
| State highway | 13.20% | 1.76% | 3.53% | 94.69% |
| National highway | 69.90% | 0.12% | 29.96% | 67.04% |
| Lanes | ||||
| 2 lanes or less | 73.90% | 1.03% | 42.25% | 52.44% |
| More than 2 lanes | 26.10% | 0.63% | 39.57% | 56.61% |
| Road features | ||||
| Curved road | 15.20% | 1.97% | 43.69% | 44.48% |
| Straight road | 84.80% | 0.07% | 53.10% | 46.99% |
| Road junctions | ||||
| Staggered junction | 6.36% | 0 | 41.31% | 58.69% |
| Y junction | 5% | 0 | 25.66% | 73.01% |
| T junction | 2.36% | 0 | 44% | 56% |
| Round about junction | 52.53% | 0.76% | 36.89% | 58.67% |
| Four-armed junction | 33.70% | 1.58% | 41.25% | 51.44% |
| Speed limit | ||||
| 40-60 | 15.56% | 1.49% | 36.25% | 58.84% |
| 60-80 | 82.46% | 0.84% | 42.01% | 53.03% |
| >80 | 1.96% | 0 | 35.08% | 59.84% |
3.3 Data analysis
Several steps are carried out in the data analysis stage to ensure the reliability and usability of the dataset. The data was checked for accuracy and consistency to confirm its reliability. This involved identifying and correcting errors or inconsistencies in the dataset. Once verified, the data was converted into numerical format by encoding categorical variables. For instance, the time-of-day variable was encoded as: "morning" = 1, "afternoon" = 2, "evening"=3, and "night" = 4. This standardization step facilitated seamless processing in statistical software.
After encoding, the data was imported into IBM SPSS Statistics 27 for descriptive analysis and into Jamovi 2.3.28 software for latent class clustering. SPSS was used to test the internal consistency and reliability of the dataset, ensuring the validity of the conclusions drawn. Once verified and coded, the dataset was analysed in Jamovi using Latent Class Analysis (LCA). Jamovi is a user-friendly statistical software that facilitates latent class identification and sub-group discovery from within a set based on observed variables' pattern. The whole process facilitates uncovering patterns or underlying structures that otherwise may lie hidden within data, shedding insight into processes or mechanisms underlying them. LCA was chosen because it is a model-based probabilistic approach particularly well-suited for identifying latent (unobserved) subpopulations in heterogeneous data based on observed categorical or mixed-type variables. Unlike K-means, which assumes clusters are spherical and equidistant in feature space, LCA does not require such geometric assumptions and can model complex, non-linear relationships among variables. Additionally, LCA provides fit indices (e.g., AIC, BIC) to determine the optimal number of classes, enhancing model interpretability and statistical robustness. Given that pedestrian crash data involves a mixture of categorical and ordinal variables (e.g., road type, time of crash, vehicle type, severity level), and is affected by underlying unobserved heterogeneity (e.g. behavioural or environmental factors not directly measures), LCA offers a more appropriate and interpretable clustering framework. This is consistent with best practices followed in recent traffic safety literature (e.g. Sun et al., 2019; Zhu et al., 2023).
The algorithms to implement Random Forest have also been achieved using software packages like Python. These machine learning techniques are further used to analyze the data and find the important predictors or variables that are responsible for the outcome of interest. Overall, the data analysis phase is a series of steps to ensure reliability and validity of the data and to find the hidden patterns and relationships in the dataset. With the judicious use of statistical analysis and machine learning techniques, the factors influencing road accidents can be identified, and eventually strategies to enhance road safety can be evolved.
4. Analysis and results
4.1 General
Analyzing the data proved to be a formidable task, requiring careful attention to detail and a thorough understanding of the dataset. The reliability of the collected data was paramount, as any inaccuracies could jeopardize the integrity of the entire analysis. Ensuring the data's reliability involves meticulous validation processes and rigorous checks to identify and rectify any errors or inconsistencies. Furthermore, the complexity of the data added another layer of difficulty to the analysis process. The dataset encompassed a wide range of variables, each requiring careful consideration and interpretation. This complexity underscored the importance of a systematic and structured approach to data analysis. Despite these challenges, a meticulous and methodical approach to data analysis ensured that the process was conducted smoothly and efficiently. By prioritizing the reliability of the data and employing a systematic analytical approach, the study was able to derive meaningful and actionable insights from the dataset, contributing to a robust and comprehensive research outcome.
4.2 Latent Class Analysis
Latent Class Analysis (LCA) is a statistical method used to identify underlying subgroups or "classes" within a population based on their responses to a set of observed categorical variables. This method is widely used in various fields, including psychology, sociology, and marketing, to uncover hidden patterns in data. In the context of this discussion, the process of conducting LCA using the Jamovi software involves several steps. Firstly, the data must be prepared by coding it into a numeric format. This step is crucial as LCA requires categorical data to be represented numerically for analysis. Once the data is coded, the next step is to import it into Jamovi software. This is typically done using an Excel file, which contains the coded data. Upon importing the data, the variables need to be configured based on their nature. Variables can be nominal, ordinal, or continuous, and this information helps the software understand the nature of the data and how it should be analyzed.
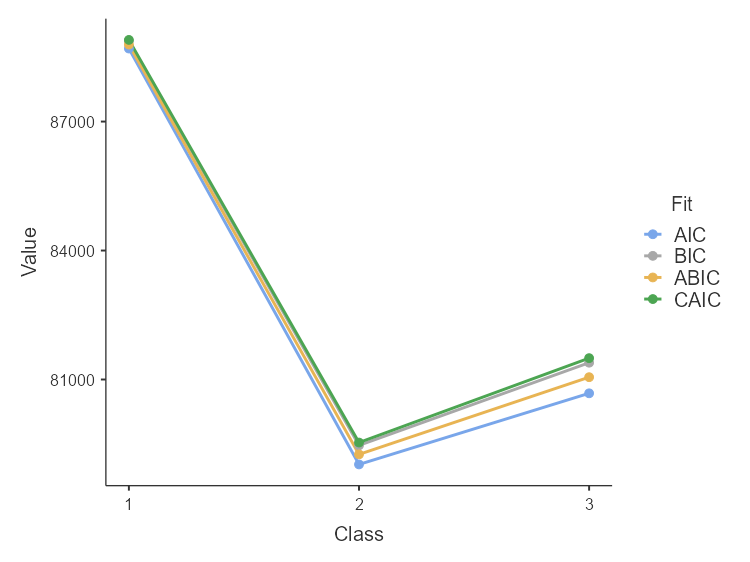
The provided elbow plot (Figure 2) for latent class analysis (LCA) determines the optimal number of classes using several fit indices: AIC, BIC, ABIC, and CAIC. The plot shows a significant decline in fit index values when moving from one class to two classes, indicating a considerable improvement in model fit. This sharp drop suggests that a two-class model captures much of the data’s heterogeneity. As the number of classes increases from two to three, the fit indices—AIC, BIC, ABIC, and CAIC—either slightly decrease or remain relatively stable, indicating further improvement, though less dramatic (Table 2). This suggests that a three-class solution provides a better fit without overcomplicating the model. Thus, considering the balance between model fit and complexity, the optimal number of classes is determined to be three. This helps in effectively capturing the underlying structure of the data while maintaining a parsimonious model.
| Class | AIC | BIC | ABIC | CAIC | Log-likelihood | χ² | G² |
|---|---|---|---|---|---|---|---|
| 1 | 88699 | 88874 | 88791 | 88900 | -44323 | 1.04e+6 | 24414 |
| 2 | 79024 | 79468 | 79258 | 79534 | -39446 | 196443 | 17040 |
| 3 | 80679 | 81391 | 81054 | 81497 | -40233 | 318747 | 18373 |
4.3 Latent Class results
Figure 3 presents the conditional probabilities of key categorical variables across the three latent classes identified through Latent Class Analyses. The X-axis includes multiple relevant crash-related variables – such as vehicle type, road type, and number of lanes, surface conditions, speed limit, road features, road junctions, and time of day, injury type, traffic violations, and traffic conflict-each broken down by category.
Class 1: Class 1 is characterized by a higher probability of minor injuries among its members. The population of this class is 27.7%. Around 60.1% of this class group have minor injuries. This group is generally less hazardous due to effective traffic control measures in place. Traffic control in these areas is typically managed using traffic signals or stop signs, particularly at staggered and four-armed junctions. These controls help reduce the severity of accidents, resulting in fewer severe injuries and a predominance of minor injuries. Members of this class benefit from systematic and structured traffic management, which contributes to a safer environment and minimizes the risk of more serious injuries.
Class 2: Class 2 is distinguished by well-managed traffic control, which helps to provide a more secure driving environment. The population of this class is 8.7%. Effective traffic safety measures are seen in the 32.8% of events in this class that ended without any injuries. Three wheelers acted for 37.7% of all vehicles involved in crashes within this latent class, indicating that pedestrian collisions involving three-wheelers were a prominent feature of this group. Four wheelers were also involved in 19.5% of crashes. In order to ensure that a sizable percentage of crashes do not result in injuries, structured traffic control measures—likely to include appropriate signage, lane management, and enforcement of traffic rules—help to lower the overall severity of accidents.
Class 3: The population of this class is 63.5%. Class 3 exhibits a heightened likelihood of severe accidents, with 59.31% of incidents resulting in grievous injuries. The predominant portion of collisions within this category occurs in regions featuring less than two lanes, indicative of narrow or restricted road conditions contributing to such occurrences. A notable 94.24% of accidents within this class happen due to the loss of vehicle control, emphasizing challenges associated with vehicle maneuverability and stability. Moreover, 90.9% of incidents in this class are attributed to over speeding, accentuating the pivotal role of excessive velocity in escalating accident severity. This class typifies high-risk situations characterized by inadequate road infrastructure and lax speed regulation, culminating in severe outcomes (Figure 3).
Table 3 presents the conditional probabilities of key categorical variables across the three latent classes identified through Latent Class Analysis. These values indicate the likelihood that a crash with a given characteristic (e.g. vehicle type, road type, violation) falls into each latent class. For example, Class1 is more associated with two-wheeler vehicles (705) and straight roads (855), while Class 2 shows higher probabilities for truck/bus involvement (355) and better road surface conditions (555). Class 3 is affected by grievous injuries (59%), vehicle –pedestrian conflicts (55%), and higher presence of district roads (40%) and curved road features (20%). This table compliments Figure 3 by providing a detailed numerical summary, enabling precise comparisons across the latent classes and helping interpret the unique crash profiles each class represents. Table 4 presents the distribution of vehicle-to-pedestrian crash records across the three latent classes identified through Latent Class analysis (LCA). Cluster 1 accounts for 27.63% of the dataset, comprising 1687 crashes, suggesting a moderate share of incidents with potentially distinct characteristics such as controlled environments or specific vehicle types. Cluster 2, the smallest segment, represents 8.89% of the total crashes (543 record), indicating a relatively rare crash profile that may be associated with; low-risk scenarios or well-managed infrastructure. In contrast, Cluster 3 dominates the dataset, making up 63.49% of all cases with 3876 crashes. This class likely encompasses the most hazardous crash conditions, possibly linked to poor infrastructure, higher speeds, or other risk-intensive factors. The segmentation highlights the heterogeneity of crash context and provides the foundation of class-specific safety analysis and intervention.

| Variable | Category | Class 1 | Class 2 | Class 3 |
|---|---|---|---|---|
| Vehicle Type | Two-wheeler | 0.7 | 0.35 | 0.22 |
| Car/Jeep/Van | 0.18 | 0.3 | 0.34 | |
| Truck/Bus | 0.12 | 0.35 | 0.44 | |
| Lane | 2 or fewer | 0.74 | 0.69 | 0.76 |
| More than 2 | 0.26 | 0.31 | 0.24 | |
| Surface condition | Good | 0.61 | 0.55 | 0.48 |
| Poor | 0.39 | 0.45 | 0.52 | |
| Road type | National Highway | 0.5 | 0.65 | 0.42 |
| State Highway | 0.35 | 0.17 | 0.18 | |
| District Road | 0.15 | 0.18 | 0.4 | |
| Speed limit (km/h) | 40–60 | 0.16 | 0.15 | 0.14 |
| 60–80 | 0.8 | 0.82 | 0.83 | |
| >80 | 0.04 | 0.03 | 0.03 | |
| Road features | Straight | 0.85 | 0.87 | 0.8 |
| Curved | 0.15 | 0.13 | 0.2 | |
| Road junctions | Staggered | 0.05 | 0.06 | 0.08 |
| T | 0.03 | 0.02 | 0.04 | |
| Y | 0.02 | 0.03 | 0.05 | |
| Four-armed | 0.4 | 0.4 | 0.4 | |
| Roundabout | 0.5 | 0.49 | 0.43 | |
| Time of day | Day | 0.65 | 0.75 | 0.6 |
| Night | 0.35 | 0.25 | 0.4 | |
| Injury type | No Injury | 0.04 | 0.12 | 0.03 |
| Minor Injury | 0.27 | 0.31 | 0.37 | |
| Grievous Injury | 0.69 | 0.57 | 0.59 | |
| Traffic violation | No Violation | 0.32 | 0.33 | 0.27 |
| Overspeeding | 0.6 | 0.52 | 0.61 | |
| Other Violation | 0.08 | 0.15 | 0.12 | |
| Traffic conflict | Vehicle-Vehicle | 0.85 | 0.88 | 0.75 |
| Vehicle-Pedestrian | 0.15 | 0.12 | 0.25 |
| Class | Proportion of whole data set | Number of crashes |
|---|---|---|
| Cluster 1 | 27.63% | 1687 |
| Cluster 2 | 8.89% | 543 |
| Cluster 3 | 63.49% | 3876 |
4.4 Random Forest algorithm
The random forest algorithm is a powerful ensemble learning technique used for classification and regression tasks. Developed by Leo Breiman and Adele Cutler, it combines the predictions of multiple decision trees to improve accuracy and control overfitting. Breiman introduced the Random Forest (RF) classifier, which is composed of a large ensemble of individual, uncorrelated decision trees working together to make predictions. These trees are generated using a bootstrap aggregation (bagging) method, where subsets of the training data are created with replacement. About two-thirds of the samples, known as in-bag samples, are used to train the trees, while the remaining one-third, known as out-of-bag samples, are used in an internal cross-validation (CV) procedure. This CV process helps the algorithm estimate the out-of-bag error and develop a reliable RF model. Unlike some other decision tree algorithms, there is no pruning involved. Additionally, RF employs randomness by considering a random subset of features for each split. By constructing many trees, the algorithm produces a model with high variance and low bias. Once the RF is built, it predicts the class of a new observation by averaging the class votes from all the decision trees, selecting the class with the highest number of votes. The dataset used in this analysis comprises 6104 observations and 16 variables. These features include both numerical and categorical variables such as age, gender, type of injury, road type, speed limit, parts of the day, number of persons injured, lanes, surface condition, road features, type of vehicle, etc. Prior to modelling, the data underwent preprocessing steps, including missing value imputation, encoding categorical variables, and normalization of numerical features. In the process of data collection and preparation, various input features are gathered to construct a comprehensive understanding of the factors influencing the outcome. These features encompass a wide array of variables including Parts of the Day, Number of Persons Injured, Number of Vehicles Involved, number of lanes, the prevailing Surface Condition of the road, the classification of the Road Type, Speed Limit, Road Features, Road Junctions, the type of Traffic Control, Vehicle Types involved, the Age of Vehicles, Gender of individuals involved, and Type of Traffic Violation, Age. Following the comprehensive collection of these input features, the target variable, 'type of injury', is identified as the output feature. This variable serves as the focal point of predictive modelling, representing the nature and severity of injuries sustained in vehicular incidents. Subsequently, to facilitate effective model training and evaluation, the dataset is partitioned into two distinct subsets: a training set and a testing set. This partition ensures that the model can learn from a portion of the data and be evaluated on unseen data, thus enabling a robust assessment of its performance. The training subset comprises 75% of the data, providing an ample amount for model learning, while the testing subset encompasses the remaining 25%, allowing for rigorous evaluation and validation of the trained model's predictive capabilities.
To optimize the performance of the Random Forest Classifier, a Grid Search method was employed for hyper parameter tuning. The grid search systematically explored combinations of key parameters such as “n_estimators (100 to 300)”, “max_depth (5 to 25)”, “min_samples_split, (2, 5, 10)”, and “max_features (‘sqrt’, ‘log2’, or a fixed number)”. The model was trained and validated using a 5-fold cross-validation strategy on the training set. This approach allowed the model to be trained on different data subsets and validated on unseen portions iteratively, enhancing generalizability and reducing over-fitting. The final model was selected based on average F1-score and classification accuracy across folds, and its performance was then evaluated on the independent test set. These steps ensured the model’s robustness and the reliability of the reported classification metrics (accuracy: 88%, precision: 97.2%, recall: 89.2%).
Performance of the model can be evaluated from the confusion matrix. To thoroughly assess the model's performance, a 3x3 confusion matrix was employed. This matrix is instrumental in categorizing the outcomes of predictions across three distinct classes. It provides a detailed breakdown of true positives, false positives, and false negatives for each class, enabling a clear understanding of the model’s accuracy, precision, recall, and overall classification effectiveness. By examining this matrix, we gain valuable insights into the model's strengths and weaknesses, guiding further refinement and optimization of our classification approach. The confusion matrix obtained from the Random Forest Classifier, representing the classification performance on our dataset, is as follows: Here Variable A is grievously injured, B is Minor Injury, C is No injury.
The matrix is structured such that each row represents the instances in an actual class, and every column represents the instances in a predicted class (Table 5). The diagonal elements of the matrix represent correct classifications, and the off-diagonal elements represent misclassifications. Interpretation: Class A (Positive): Out of 847 instances of Class A, 823 were correctly classified as Class A (True Positives), 23 were misclassified as Class B (False Negatives), and 1 was misclassified as Class C (False Negatives). Class B Negative Out of 603 instances of Class B, 503 are correctly classified as Class B (True Negatives), and 100 are misclassified as Class A (False Positives), and there are no misclassifications of Class C. Class C (Negative): Among 76 instances of Class 3, 28 were correctly classified as Class 3 (True Negatives), 7 were misclassified as Class 1 (False Positives), and 41 were misclassified as Class 2 (False Positives). Precision: Precision is the degree of correctness of the positive predictions made by the classifier. It is defined as the ratio of true positives to the sum of true positives and false positives.
Precision measures the accuracy of positive predictions made by the classifier. It is calculated as the ratio of true positives to the sum of true positives and false positives. For our classifier, precision is approximately 97.2%.
Recall (Sensitivity): Recall measures the proportion of actual positives that were correctly identified by the classifier. It is calculated as the ratio of true positives to the sum of true positives and false negatives.
Recall measures the proportion of actual positives that were correctly identified by the classifier. It is calculated as the ratio of true positives to the sum of true positives and false negatives. The recall for our classifier is approximately 89.2%.
F1 Score: The F1 score is the harmonic mean of precision and recall, providing a balance between the two metrics. It is calculated as:
The F1 score is the harmonic mean of precision and recall, providing a balance between the two metrics. It accounts for both false positives and false negatives. The F1 score for our classifier is approximately 93.1%.
Accuracy: The total number of correct predictions (sum of the diagonal elements) is 823+503+28=1354
The total number of instances in the dataset is the sum of all elements in the confusion matrix, which is 823+23+1+100+503+0+7+41+28=1524
Therefore, the accuracy of the Random Forest Classifier is calculated as:
This indicates that the classifier achieves an accuracy of approximately 88.8%, implying that it correctly classifies 88.8% of all instances in the dataset.
Moreover, Figure 4 shows how crucial each independent parameter is in establishing possible results depending on different variables. It provides a clear visual representation of the ways in which many factors affect the severity of injuries. The variables that have the most influence in vehicle-to-pedestrian crashes include age, vehicle age, road features, and the number of wounded individuals, as illustrated in Figure 4. On the other hand, in this case, gender and surface condition are thought to be less significant determinants. This graphic emphasizes the variables' hierarchical importance and the crucial part they play in determining how situations of this kind turn out. Figure 6 offers a thorough summary that facilitates comprehension of the complex nature of vehicle crashes involving pedestrians and provides information that can guide preventative and mitigating measures.
| Predicted condition | ||||
|---|---|---|---|---|
| A | B | C | ||
| Actual condition | A | 823 | 23 | 1 |
| B | 100 | 503 | 0 | |
| C | 7 | 41 | 28 | |
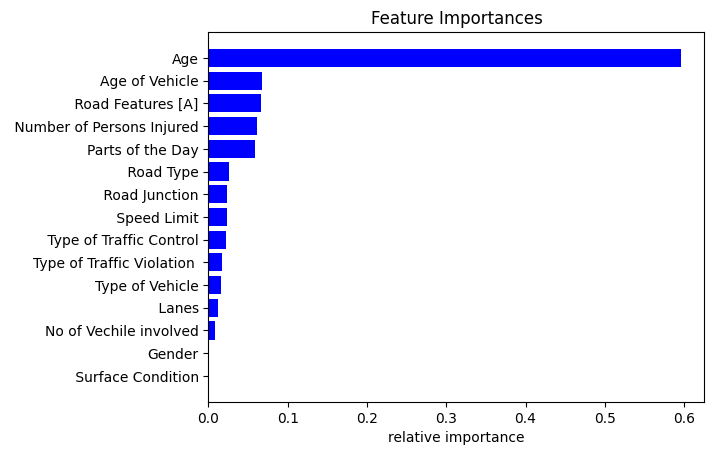
The variables that have the most influence in vehicle-to-pedestrian crashes include age, vehicle age, road features, and the number of wounded individuals, as illustrated in Figure 4. On the other hand, in this case, gender and surface condition are thought to be less significant determinants. This graphic emphasizes the variables' hierarchical importance and the crucial part they play in determining how situations of this kind turn out.
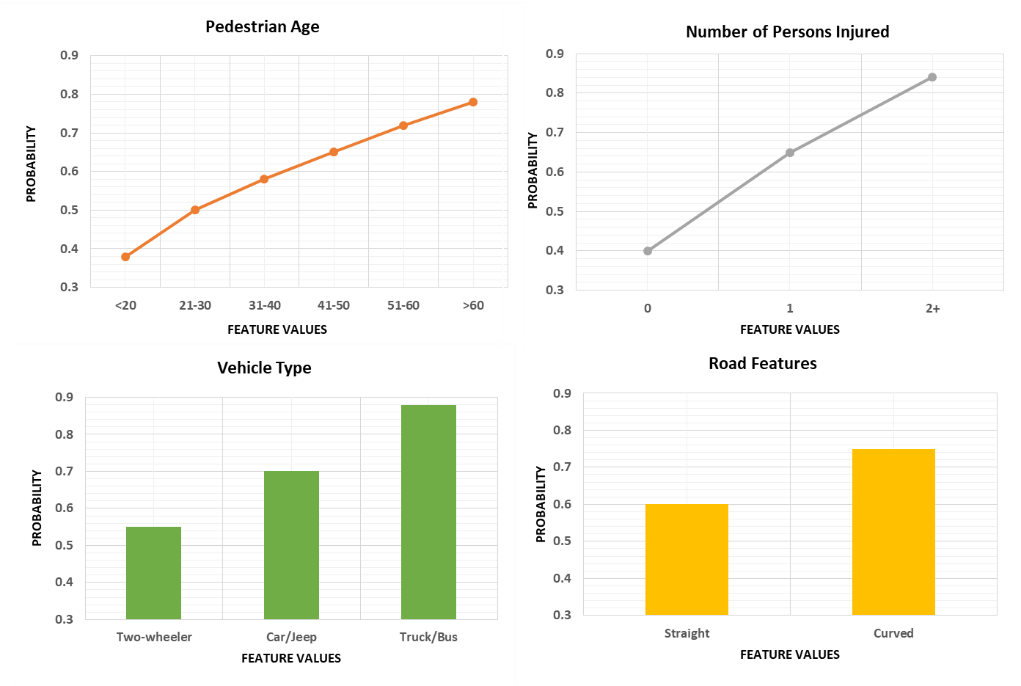
In addition to the standard feature importance rankings, Partial Dependence Plots (PDPs) were generated for the top variables-such as pedestrian age, vehicle types, and road features – to examine their marginal effect on injury severity predictions (Figure 5). For instance, PDPs showed that the probability of grievous injury increases significantly for pedestrians over 60 years of age and on narrow or curved roads. Similarly, crashes involving heavy vehicles like trucks and buses consistently showed a higher probability of severe injury outcomes. In contrast, two-wheelers and three-wheelers were associated with lower probabilities, typically below 60%. Cars and jeeps presented intermediate risk levels. Roads with curves or poor geometric alignment showed higher predicted injury severity, with PDPs indicating a 15-20% increase in the likelihood of grievous injury compared to straight roads; these findings reinforced the critical role of roadway geometry in pedestrian safety. The model also demonstrated that the likelihood of predicting grievous injury increased sharply when more than one person was injured in the crash, suggesting that multi-causality events are generally more severe.
While SHAP (Shapley Additive Explanations) offers detailed, instance-level insights by quantifying each feature’s contribution to a specific prediction, applying SHAP at scale was limited in this study due to the size and structure of the dataset. SHAP can be utilized in future extensions of the work to enhance interpretability and support policy recommendations at both the aggregate and case-specific levels.
To validate the robustness of the Random Forest Model, the study extended to include a comparative modelling with three other classification algorithms: Multinomial Logistics Regression (MLR), Support Vector Machine (SVM) with RBF kernel, and a standalone Decision Tree classifier. These models were selected as common baselines to evaluate performance across diverse algorithmic families-statistical, margin-based, and tree-based methods. Each model was trained on the same dataset and optimized using grid search. Performance was evaluated using a 5-fold stratified cross validation approach to ensure generalizability and fairness in comparison. The outcomes of this comparative analysis are presented in next section.
4.5 Model comparison
To evaluate the suitability of the Random Forest Classifier, a comparative analysis using three baseline models such as Multinomial Logistic Regression (MLR), Support Vector Machine (SVM) and Decision Tree classifier. Each model was trained on the same pre-proceeding dataset with 6104 entries and 16 features. The dataset was split into 75% training and 25% testing, and a 5-fold cross-validation strategy was adopted for validation. The hyper parameters were tuned using grid search to ensure fair comparison.
Table 6 presents the performance comparison of models where Random Forest achieved the highest classification performance across all metrics, followed by the Decision Tree and SVM models. Logistics Regression, although interpretable, performed the least well, likely due to its assumption of linear boundaries. These results affirm the robustness of Random Forest handling non-linear, high-dimensional crash data, justifying its selection for the primary predictive task in this study.
| Model | Accuracy (%) | Precision (%) | Recall(5) | F1Score (%) |
|---|---|---|---|---|
| Logistic Regression | 74.6 | 75.1 | 70.8 | 72.9 |
| Support Vector Machine | 79.2 | 80.3 | 76.5 | 78.3 |
| Decision Tree | 81.5 | 83.0 | 78.1 | 80.5 |
| Random Forest | 88.8 | 97.2 | 89.2 | 93.1 |
5. Discussions
This study used Latent Class Analysis (LCA) to uncover hidden patterns in pedestrian-involved crashes and employed a Random Forest classifier to predict injury severity based on roadway, environmental, and behavioral variables. The results support and extend findings from research in pedestrian safety, crash risk analysis, and data-driven segmentation techniques.
For instance, Class 1, with effective traffic control measures, shows lower injury likelihood, while Class 3 highlights the importance of addressing road infrastructure and speed regulation. Combining LCA with random forest enhances predictive modelling, enabling accurate injury severity classification based on various predictors. This approach underscores the significance of proactive road safety measures, from traffic management to targeted interventions. Further research is crucial for refining our understanding and developing effective strategies to prevent and mitigate the impact of vehicle-to-pedestrian crashes on public safety. The latent class analysis unveils distinct trends concerning the severity of traffic accidents and their underlying determinants. Within Class 1, comprising 27.7% of incidents, there is a lower likelihood of severe injuries, owing to the implementation of effective traffic control measures. These findings are consistent with Salehian et al., (2023), who observed that controlled intersections such as roundabouts and four-armed junctions tend to reduce crash severity through better traffic flow regulation while Class1 still shows a high proportion of grievous injuries (69%), the elevated minor injury rate suggests that structured traffic control and lower vehicle mass (e.g. two-wheelers) may help mitigate injury severity, as also noted by Eluru et al., (2008).
In Class 2, representing 8.7% of cases, well-organized traffic controls contribute to reduced injury rates and a higher proportion of incidents resulting in no injuries. These results align with the findings of Samerei et al., (2024), who reported that road surface quality and adequate lighting are positively associated with lower pedestrian injury severity. The higher no-injury probability suggests that well-managed environments, even with heavy vehicle presence, may buffer injury outcomes-supporting studies by Chen and Fan (2019), who highlighted the protective role of urban design and enforcement.
Class 3, constituting 63.5%, is characterized by poor road geometry (narrow lanes, curved roads), overspending (90.05), and loss of vehicle control (94.2%0. This class shows the highest likelihood of grievous injuries (59%) and the greatest share of vehicle pedestrian conflicts (25%). These findings are consistent with previous research emphasizing the role of speeding and insufficient road infrastructure in increasing crash severity (Jamal et al., 2021; Rankavat & Tiwari, 2015). The prevalence of conflicts in Class 3 also supports the argument by Muslim & Makoshi (2022) that interaction between vulnerable users and high –speed vehicles in unconstrained environments significantly escalates risk.
The Random Forest classifier identified vehicle type, road features, number of lanes, and surface condition as strong predictors of injury severity. This agrees with Rifat et al., (2024), who used machine learning models to highlight the nonlinear influence of roadway context and vehicle size on injury risk. The high model accuracy (88.8%) and consistent ranking of feature importance provide strong support for the predictive power of ensemble learning in injury outcome modelling.
Together these suggest that different crash profiles require context-specific safety strategies. Class 1 environments may benefit from improved pedestrian crossings and speed calming for two-wheelers, while Class 2 supports maintaining and expanding structures road systems. Class 3, being the model hazardous, highlights the urgent need for infrastructure upgrades, automated speed enforcement, and protection systems in high-risk zones.
6. Conclusions and recommendations
The study makes an important contribution to the traffic safety research by integrating statistical clustering and machine learning prediction to develop a deeper understating of pedestrian injury outcomes. The study investigated the severity of vehicle-to-pedestrian crashes using Latent Class Analysis (LCA) and a Random Forest classifier, levering detailed accident data from Madhya Pradesh. LCA was chosen over other clustering techniques like K-means or hierarchical clustering due to suitability for handling mixed-type variables and unobserved class membership, which are common in crash datasets. The analysis revealed three distinct crash profiles:
Class 1 involved two-wheeler-related crashes in controlled environments such as straight roads and four-armed junctions, with a relatively higher proportion of minor injuries. Class 2 was characterized by better-managed road conditions (e.g. good surfaces, national highway) and featured a higher proportion of no-injury events, often involving three-wheelers and four-wheelers. Class 3 represented the most hazardous conditions, with poor infrastructure, narrow lanes, high over speeding rates, and the highest likelihood of grievous injuries and vehicle-pedestrian conflicts.
The Random Forest model demonstrated strong predictive accuracy (88.8%), with key predictors including vehicle type, number of lanes, road type, surface condition, and time of day. This performance was made possible through hyperparameter tuning using grid Search and 1 5-fold cross-validation strategy, ensuring robustness and generalizability. These results confirm that both environmental factors and driver’s behaviour significantly influence crash outcomes. Furthermore, to validate the chosen modelling approach, a comparative analysis was conducted using Multinomial logistic regression, Support Vector Machine, and decision tree classifiers. The Random Forest model outperformed these alternatives across all evaluation metrics, reaffirming its suitability for predicting injury severity in heterogeneous crash datasets. This comparative evidence strengthens the credibility of our modelling results and highlights the utility of ensemble methods in traffic safety analysis. To improve interpretability, Partial Dependence Plots (PDPs) were also generated, which clarified how individuals’ variables influence injury severity outcomes. For example, the risk of grievous injury was found to increase notably with pedestrian age and road curvature.
Class 1 involved two-wheeler-related crashes in relatively controlled environments-such as straight roads and four-armed junctions-with a higher proportion of minor injuries. Class 2 was characterized by well-managed road conditions (e.g. good surface quality, national highways), including a higher proportion of non-injury events, frequently involving three-wheelers and four-wheelers. Class 3 represents the most hazardous environments, marked by poor infrastructure, narrow lanes, high over speeding rates, and the highest probability of grievous injuries and vehicle-pedestrian conflicts.
Based on the insights from class-specific risk profiles, the study proposes the following targeted interventions:
For Class 3 (high-risk zones), narrow roads can be widened and resurface deteriorated pavements, install speed-calming measures such as rumble strips and raised pedestrian crossings, enforce speed limits through automated monitoring in zones with frequent over speeding and poor visibility.
For Class 1(moderate-risk, signalized areas), intersection safety with improved signage, pedestrian refugee islands, and low-speed design, especially in two-wheeler-dominated corridors, implement targeted awareness campaigns for two-wheeler drivers on pedestrian safety and signal compliance. While for Class 2(low-risk, well-managed areas), good surface conditions, lane markings, lighting and ensure continued enforcement of traffic rules are maintained to prevent complacency in safety standards.
While this study offers important insights into pedestrian injury severity using Latent Class Analysis and Random Forest modelling, several limitations should be acknowledged. The dataset was primarily sourced from the Madhya Pradesh Road Development Corporation and relies heavily on police reports and surveillance-based documentation. This introduces the possibility of reporting bias, especially underreporting less severe or non-fatal crashes, and may result in inconsistencies in injury classification. Furthermore, the data coverage is likely biased toward well-monitored roads such as highways and arterial corridors, while interior rural and urban streets may be underrepresented, limiting geographic generalizability of the findings. Another key limitation is the absence of real-time environmental and traffic data, including factors such as weather conditions, traffic volume, lighting, and road visibility, which are known to significantly affect crash dynamics. These contextual variables could improve the model’s predictive power but were unavailable in the current dataset. Although interpretability was enhanced using Partial Dependent Plots (PDPs), more advanced techniques such as SHAP (Shapley Additive Explanations) were not employed due to computational limitations but represented a promising direction for future work. To address these limitations, future research should aim to integrate real-time data sources from smart traffic sensors, meteorological APIs, and GPS-enabled vehicles. Alternative datasets such as hospital records, municipal crash logs, and emergency service data could also help mitigate reporting and spatial biases. In additions, applying casual inference techniques-such as propensity score matching, instrumental variables models, or structural causal frameworks-would allow researchers to explore not just correlations, but casual relationships between crash factors frameworks –would allow researchers to explore not just correlations, but causal relations between crashes factors, and injury outcomes. The incorporation of emerging technologies like AI-based video analytics and vehicle-to-everything (V2X) systems could further enhance reactive modelling and enable real –time safety innervations. Finally, collaborations between researchers, policymakers, traffic engineers, and enforcement authorities will be essential to translate these analytical insights into comprehensive, evidence-based pedestrian safety strategies.
CRediT contribution statement
Chinmay Gayan: Conceptualization, Funding acquisition, Methodology, Writing—original draft, Writing—review & editing. G. R. Bivina: Methodology, Supervision, Validation, Writing—review & editing. Yogeshwar V. Navandar: Supervision, Validation, Writing—review & editing.
Acknowledgement
The authors would like to thank the Ministry of Education, India for supporting this work in the form of stipend provided to the first author.
Data availability
The data are available on request to the authors.
Declaration of competing interests
The authors report no competing interests.
Ethics statement
The study utilizes anonymized secondary data from the Madhya Pradesh Road Development Corporation, Accident Response System, provided in compliance with their data-sharing policies. As the data is de-identified and no human participants were directly involved, ethical approval was not required.
Funding
This research was supported through a stipend awarded to the first author by the Ministry of Education, India. No additional external funding was utilized for this study.
Declaration of generative AI use in writing
The authors declare that no generative AI was used in this work.
Editorial information
Handling editor: Haneen Farah, Delft University of Technology, Netherlands.
Reviewers: Chuanyun Fu, Harbin Institute of Technology, China; Emmanuel Adanu, The University of Alabama, United States of America.
Submitted: 20 January 2025; Accepted: 16 November 2025; Published: 12 December 2025.