Effects of Heavy Trucks on Cyclists During Overtaking Manoeuvres: A Controlled Study
Abstract
Since December 2023, so-called High-Capacity Transport vehicles (up to 34.5 m length) are allowed on parts of the Swedish network of primarily divided roads. Investigations are ongoing under which premises longer HCT vehicles can be allowed on undivided rural roads, where cyclists and other active travellers may be present. On rural roads, overtaking manoeuvres are a frequently occurring encounter between cyclists and motorists. The fear related to dangerous overtakes is a major deterrent to rural cycling, and the aerodynamic load generated especially by large vehicles may pose a danger in that it could affect cyclist stability. To systematically investigate the effects of lateral distance, overtaking vehicle speed and truck length on cyclists stability and perception of discomfort, a controlled study was conducted in a laboratory setting. In a 700 m long tent, 23 experienced road cyclists rode on free rollers while being overtaken by a 16.5 m and a 32.5 m long truck combination at 50 and 80 km/h, with lateral distances of 1 m, 1.5 m and 2 m. Additionally, a reference overtake was run, reflecting a full lane change at reduced speed (16.5 m truck, 50 km/h, 3.5 m). Lateral distance had the largest impact on aerodynamic load and discomfort ratings, followed by speed. The length of the truck only had a minor effect. The cyclists’ lateral position on the rollers was not affected by any of the three factors, but increased slightly from before to during to after the overtaking manoeuvre, regardless of the condition. Based on these findings, a full lane change is recommended when overtaking cyclists. To which extent a speed adaptation is appropriate as compensatory measure needs to be investigated further.
1. Introduction
High-Capacity Transport (HCT) vehicles are road transport vehicles exceeding the weights and/or dimensions of conventional heavy goods vehicles. HCT vehicles are expected to increase transport and energy efficiency and thereby decrease costs as well as carbon dioxide emissions (OECD, 2009). Thus, given the same amount of transported goods, the number of trucks on the roads would be reduced (Sandin, 2016). This would likely also imply that the absolute number of encounters with cyclists is reduced, at the cost of the trucks being longer on average, which may affect the cyclists’ safety and comfort during an overtaking manoeuvre.
An international overview indicates that crash rates for HCT vehicles are lower than for conventional heavy-goods vehicles (Bálint et al., 2014). In Australia HCT vehicles have been allowed on higher capacity roads, comprising divided and undivided highways and arterial roads, for the last four decades. A comprehensive study showed that crash rates for HCT vehicles in Australia are significantly lower than for conventional equivalent trucks (Hassall, 2014).
The roadmap for Sweden builds on a gradual introduction of HCT vehicles to the road network, to follow and evaluate their effect on road safety (Sjögren & Kyster-Hansen, 2016). In Sweden, longer HCT vehicles, that is, trucks with a maximum length of 34.5 m as compared to the previous maximum length of 25.25 m, were introduced on December 1st, 2023. In a first step, they were given access to around 4500 km of the Swedish road network. These roads have physical median barriers. Additionally, a network of access roads of up to 10 km in length per section was identified, with a total length of around 1400 km. These roads are also used by active road users like cyclists and pedestrians. The posted speed limit dictates the minimum width of the road required for HCT vehicles to be allowed on them (Table 1).
The width of the truck (2.55 m) and a temperature-controlled trailer (2.60 m) and the cyclist (ca. 0.5-0.7 m), combined with an assumption of a lateral placement of the cyclist at around 0.5-0.8 m from the right edge leads to an estimated maximum possible lateral passing distance, assuming that the truck driver keeps around 0.5-0.8 m to the left edge of the road (Table 1). Given a bicycle length of 1.6 m, the time the truck and the cyclist spend parallel with each other with at least some overlap is shown in Table 1 for two cyclist and five truck speeds.
| Posted speed limit | Minimum road width | Estimated maximum lateral overtaking distance | Time parallel at posted speed | |
| cyclist 20 km/h | cyclist 30 km/h | |||
| 80 km/h | 8.5 m | Ca. 4 m | 2.2 s | 2.6 s |
| 70 km/h and 60 km/h |
8.0 m | Ca. 3.5 m | 2.6 s 3.2 s |
3.2 s 4.3 s |
| 50 km/h and 40 km/h |
7.0 m | Ca. 3 m (slightly smaller margins assumed) | 4.3 s 6.5 s |
6.5 s 13.0 s |
1.1. Overtaking of cyclists on rural roads
On rural roads, overtaking manoeuvres (from now on called “overtakes” for the sake of brevity) are the second most frequently occurring encounter between cyclists and motorised vehicles after oncoming encounters. Given the speeds that are common for motorised vehicles on rural roads, the kinetic energy in the case of an impact is high and therefore dangerous for the cyclist (Stigson et al., 2020). For collisions that end fatally for the cyclist, Swedish data show that being struck from behind by a motor vehicle is more frequent in rural than in urban areas (Kullgren et al., 2019). In Sweden, there are no specific regulations stipulating how to overtake cyclists, except for the general regulation that the overtaking vehicle needs to keep a “comfortable lateral distance” to the vehicle being overtaken, without any further clarification of the term “comfortable”.
A large volume of research models the mean lateral passing distance during overtakes as a function of infrastructure, vehicle and cyclist related factors (for summaries, see e. g. Kircher et al., 2022; Nolan et al., 2021; Rasch, 2023; Rubie et al., 2020). The mean lateral passing distance is shown to be influenced by the infrastructure, for example through lane and shoulder width, number of lanes and centre line presence. Larger vehicles tend to leave a smaller distance, potentially due to their physical width in relation to available space (Chapman & Noyce, 2014). The collective data also show that close overtakes are frequent occurrences. However, the definition of a close overtake varies between studies, as does the operationalisation of the distance between the cyclist and the overtaking vehicle, such that comparisons between studies have to be made with caution. Here, in line with Gromke and Ruck (2021), the term “clearance” is used when referring to the free space between the overtaking vehicle and the bicycle and cyclist (e. g. the edge of the handlebars or body), and “distance” is used when referring to the measurement from the lateral position of the bicycle wheels to the edge of the overtaking vehicle. Distance is also used when referring to literature where no specific definition is given.
Nolan et al. (2021) computed the likelihood of experiencing at least one overtake with a clearance of below one metre depending on the number of overtakes. For cycling trips with up to 50 overtakes, this probability is around 45 per cent, and for trips with more than 100 overtakes, the probability increases to above 95 per cent. This means that a cyclist planning a longer ride or a ride on busy roads can almost certainly reckon with encountering such an unpleasant event, which indicates the magnitude of the problem.
Questionnaire studies show that the fear of unpleasant overtakes plays a major role in people’s willingness to cycle (Heesch et al., 2011). A small lateral passing distance is one of several contributing factors to that fear. This was also shown by empirical data where cyclists marked overtakes that they experienced as unpleasant (Beck et al., 2021). The lateral clearance of those manoeuvres was smaller on average than for not marked overtakes, though not all narrow overtakes were marked as uncomfortable, and overtakes with a comparatively wide clearance could be marked as uncomfortable. This indicates that clearance is not the only factor affecting the cyclists’ perception. A research group in Spain found that cyclists’ risk rating of overtakes is related to distance, speed and type of the overtaking vehicle, where overtakes with heavy vehicles are perceived as riskier (Llorca et al., 2017). Also, overtakes that were not preceded by a speed reduction were experienced as less pleasant, and cyclists in a group felt more exposed when in the rear of the group (López et al., 2020).
The size of the vehicle front, the speed, the lateral distance and the type and shape of the bicycle and cyclist influence the aerodynamic effect that the overtaken cyclist will experience (Gromke & Ruck, 2021; Llorca et al., 2017). The Federal Highway Administration estimated a maximum side load on cyclists of 17 N to prevent dangerous aerodynamic forces (FHWA, 1979). As discussed by Gromke and Ruck (2021) and Lubitz and Rubie (2018), no empirical source for this value is provided, and it is not clear whether the maximum or mean load during a passing manoeuvre is meant. Lubitz and Rubie (2018) conducted a study to establish the relationship between lateral distance, speed and the resulting aerodynamic force on a stationary cyclist dummy, cautiously concluding that the diagram provided by the FHWA (1979) is a reasonable approximation. They argue, though, that cyclists can compensate for lateral load if it is applied slowly enough, such that the fluctuation of the force is at least as important as the absolute value.
This was taken up by Gromke and Ruck (2021) in a similar study. They discuss especially the so-called “flipover effect” stemming from the lateral load first pushing the cyclist outwards, which is then followed by pull/suction inwards, which is characteristic for a passing manoeuvre. For the same overtaking vehicle, they found the flipover load to increase and the duration of the flipover phase to decrease with a higher speed, a smaller lateral distance and a larger lateral surface area of the cyclist and bicycle. The ratio between the outward and inward force, called the flipover load rate, was suggested as an indicator for cyclist safety, as handling a larger flipover load stretching over a longer time may be equivalent to handling a smaller load over a shorter period of time.
1.2. Research questions
The research question was to understand how lateral distance, speed and truck length affect the overtaken cyclist physically and psychologically. Specifically, the hypotheses were that:
-
A higher passing speed requires a larger clearance for the overtake to be perceived similarly: Controlled test track replication of results obtained in the field by Llorca et al., 2017.
-
The length of the truck affects how the overtake is perceived by the cyclist.
-
The aerodynamic load on the cyclist affects the stability of bicycle handling: Employing realistic cycling dynamics as expansion of Gromke & Ruck, 2021, who used dummies on bicycles with a stiff-mounted fork.
2. Method
The study was approved by the Swedish Ethical Review Authority (Dnr 2022-06608-01). It took place in the so-called Dry Zone of the test centre AstaZero close to Borås, Sweden[1]. The indoors test facility, a tent of 700 m length, provided shelter from ambient wind and precipitation.
2.1. Design
For the overtakes a within-group design was used with an orthogonal variation of the factors lateral distance (1 m, 1.5 m, 2 m), overtaking speed (50 km/h, 80 km/h) and vehicle length (16.5 m, 32 m). Vehicle length was varied blockwise, speed and distance were balanced within each block. Before these twelve experimental overtakes, each participant was subjected to a reference overtake with the 16.5-m-truck (henceforth “short”) at 50 km/h at a distance of 3.5 m, which corresponds to a full lane change on a road of at least 8 m width.
2.2. Apparatus
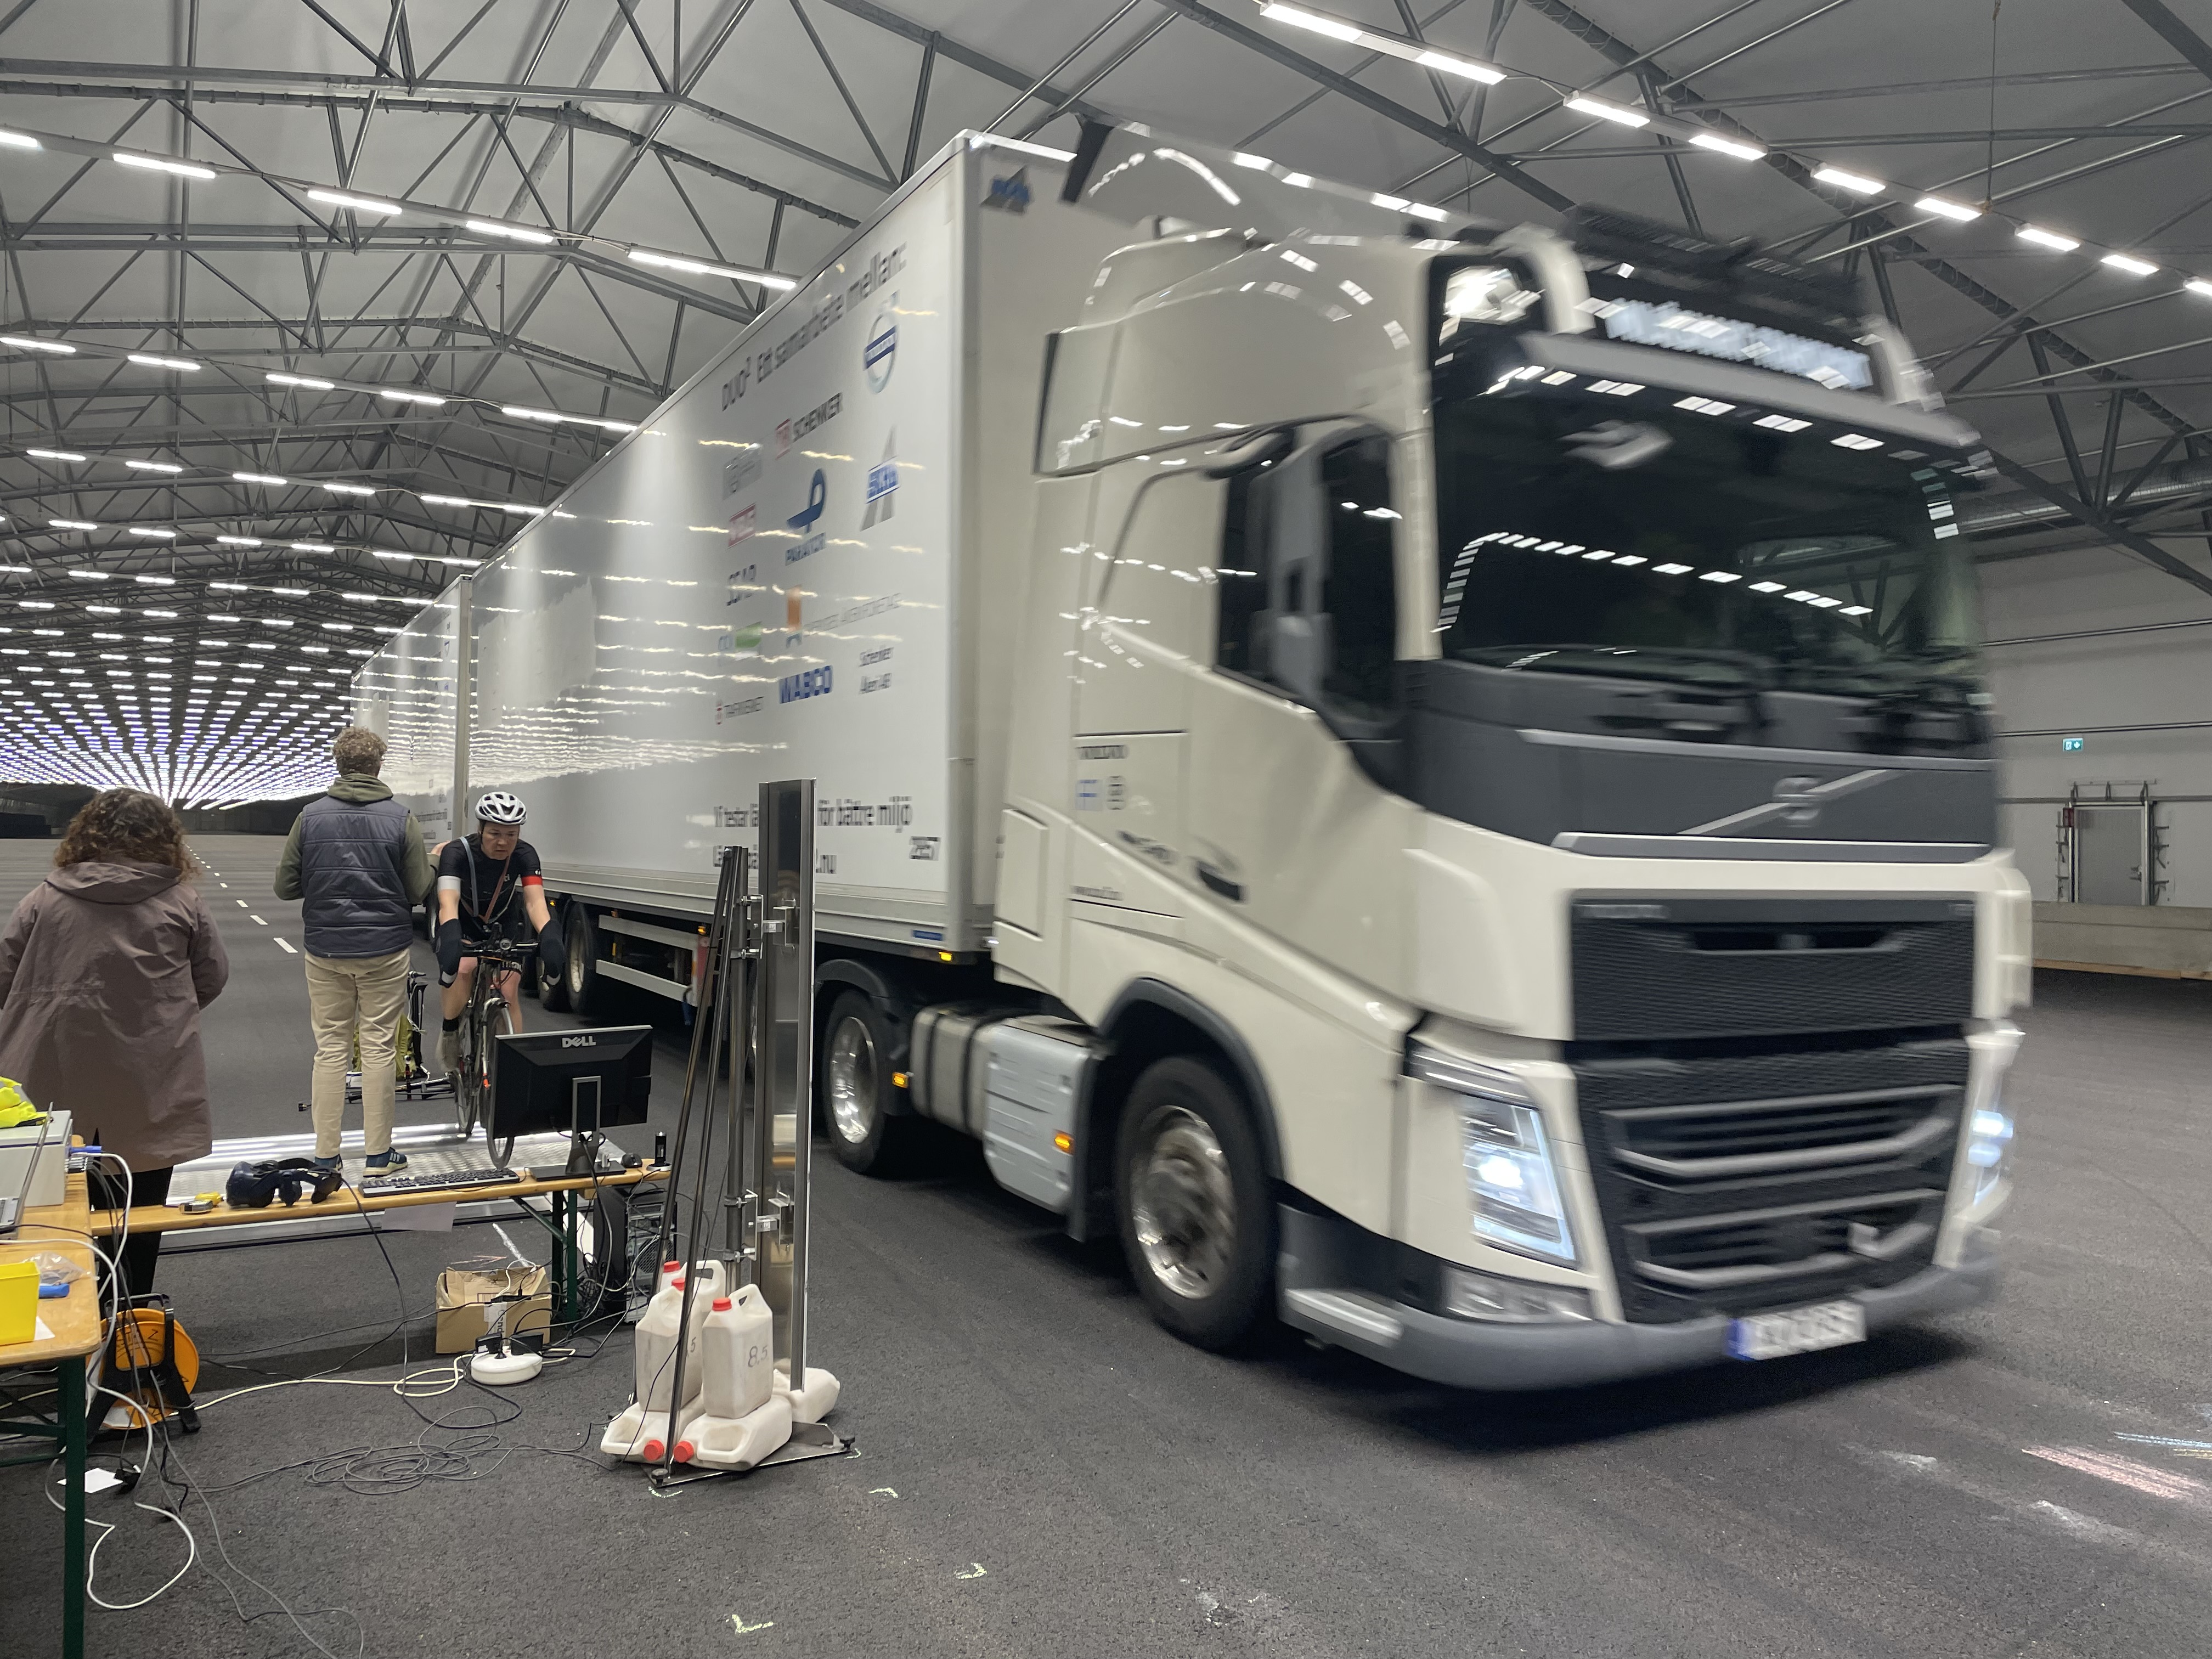
The research platform was set up such that the truck could accelerate to 80 km/h and continue at that speed for approximately 50-100 m before reaching the platform, and then decelerate smoothly and turn around before reaching the far end of the tent (Figure 1).
2.2.1. Free rollers
The participants cycled on a custom-built version of free rollers, which were 2 m wide and had a diameter of 20 cm. Their construction corresponded to standard training rollers, and they were adjustable to accommodate standard wheelbases for road bikes. The front roller was connected to the forward rear roller via a chain that was adjustable in length. The resistance of the rollers was not measured and depended partially on the tension in the chain. The larger roller diameter and the width of the rollers made riding on them easier than on standard training rollers. The rollers used here are otherwise part of the VTI cycling simulator, which has been used in several studies, usually with a mixed-reality setup (e. g. Kircher, Lindman, van Eldijk, et al., 2024). Typically, participants feel comfortable cycling on the rollers after a few minutes of practice, also when they do not have a training background.
2.2.2. Equipment on and around bike
Three action cameras (Sony FDR-X3000) were positioned around the platform. One filmed the bicycle up to the chest of the rider from the front, one from the back, and one filmed the complete setup from the right side. A measurement box (constructed in-house at VTI, see Kircher, Lindman, Sliacan, et al., 2024) was attached to the seatpost of the bicycle. It logged the lateral distance between the bicycle and the truck via ultrasound at 22 Hz. An event button consisting of a microswitch connected to the box via a cable was operated by the experimenter. The button was pressed during each overtake to mark it in the data.
2.2.3. Aerodynamic load
The air pressure was measured with equipment built in-house, consisting of a 1.6 m high aluminium plate with an area of 0.64 m2 mounted on two force sensors, standing on steel legs. The whole structure was weighed down with several sand canisters to minimize unwanted plate oscillations. The force sensors were two S2M high-precision S-type load cells with an accuracy class of 0.02 and a rated force of 100 N. The force sensors’ output was logged at a frequency of 1000 Hz via Catman data acquisition software (HBK, Chicago, USA) and recalculated to pressure by adding up the forces and dividing by the plate area. The aerodynamic forces were measured for each participant, as distances and speeds could vary slightly between the trials also within the same condition.
2.2.4. Trucks
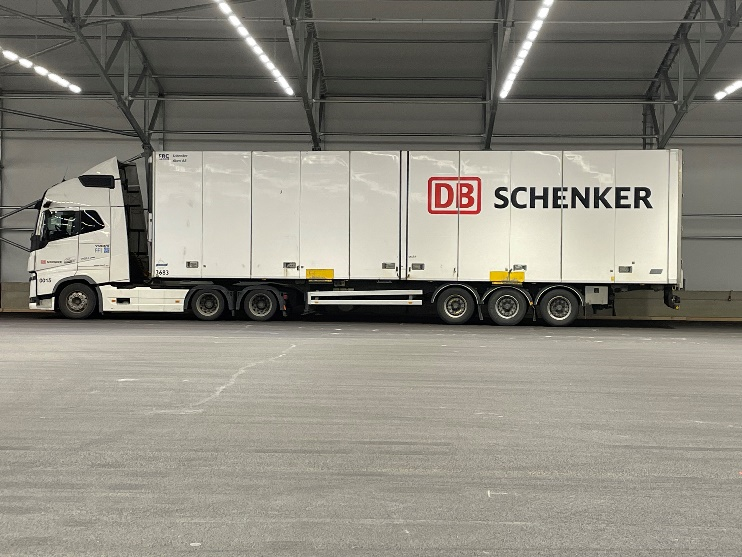
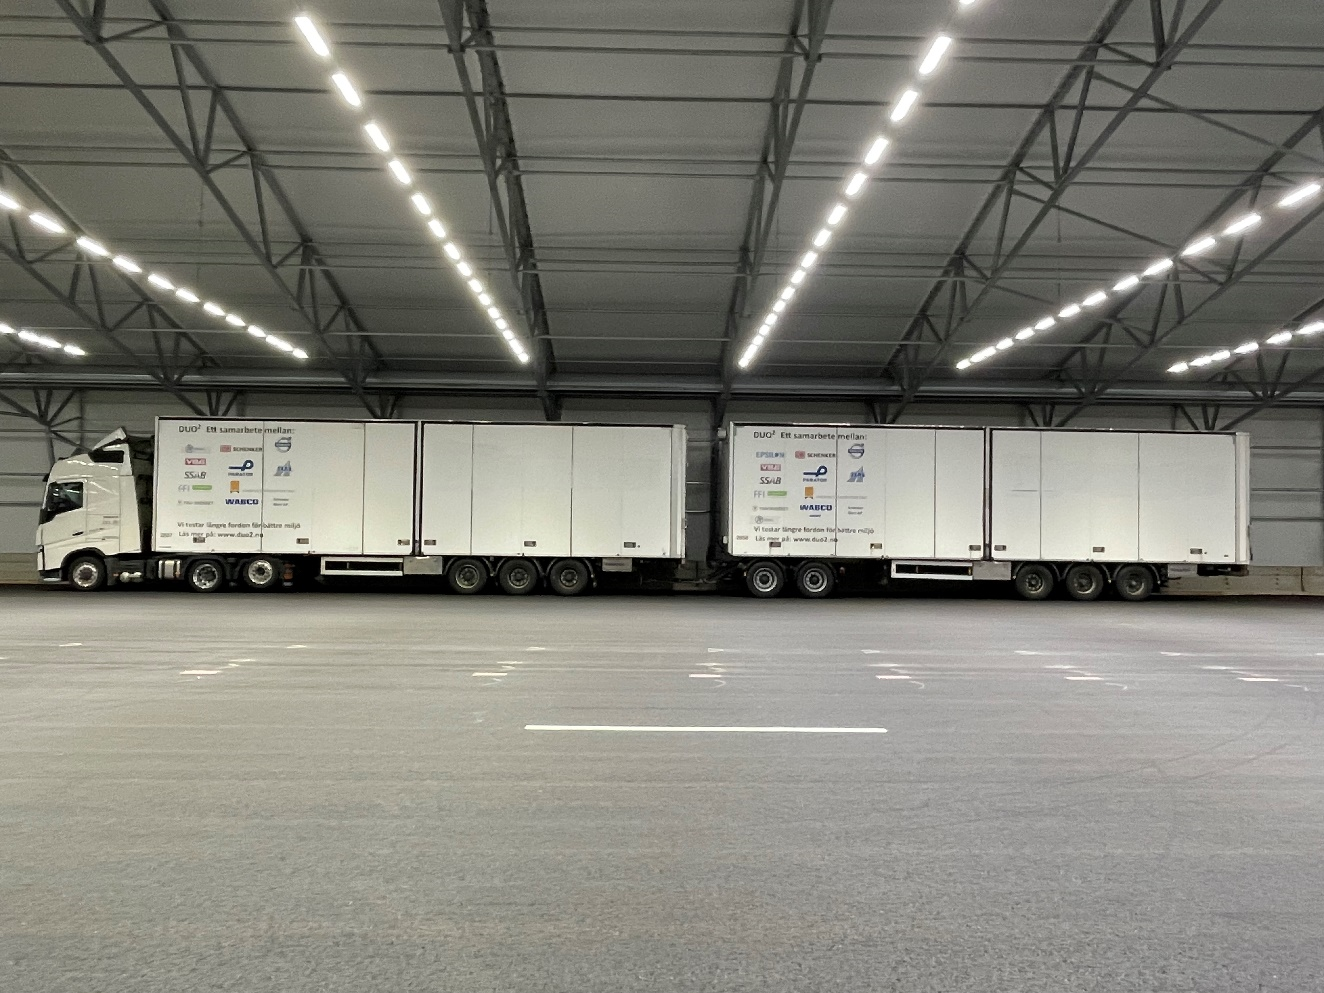
Two vehicle combinations with different lengths were used to investigate the effect of vehicle length. The 16.5 m tractor-semitrailer is shown in Figure 2 and the longer 32.5 m A-double (tractor-semitrailer-dolly-semitrailer) in Figure 3.
The lateral distances were marked with chalk symbols in the location of the driver’s position, such that the right side of the truck would assume the correct distance from the centre position of where the cyclist was asked to ride. The clearance, that is, the free space between the truck and the cyclist, was therefore the lateral distance minus half the width of the cyclist plus the positive or negative lateral deviation of the truck and cyclist from their respective target positions. The wing mirror was above the cyclist’s head (see Figure 1) and was not part of the clearance measure.
2.2.5. Discomfort scale and subjective evaluation
The participants were instructed to rate each overtaking on a scale where the value “0” represented the reference overtake and the value “10” represented the worst imaginable overtake. Usage of decimals was allowed, and the participants could employ negative values, should they perceive any of the overtakes as more comfortable than the reference. Participants were asked to describe in their own words how they arrived at the discomfort rating. These comments were written down by the experimenter.
2.2.6. Questionnaire
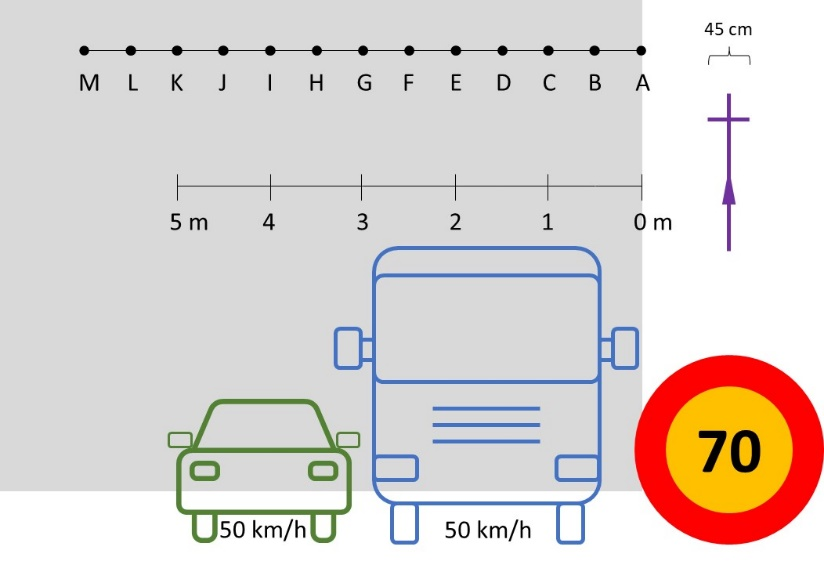
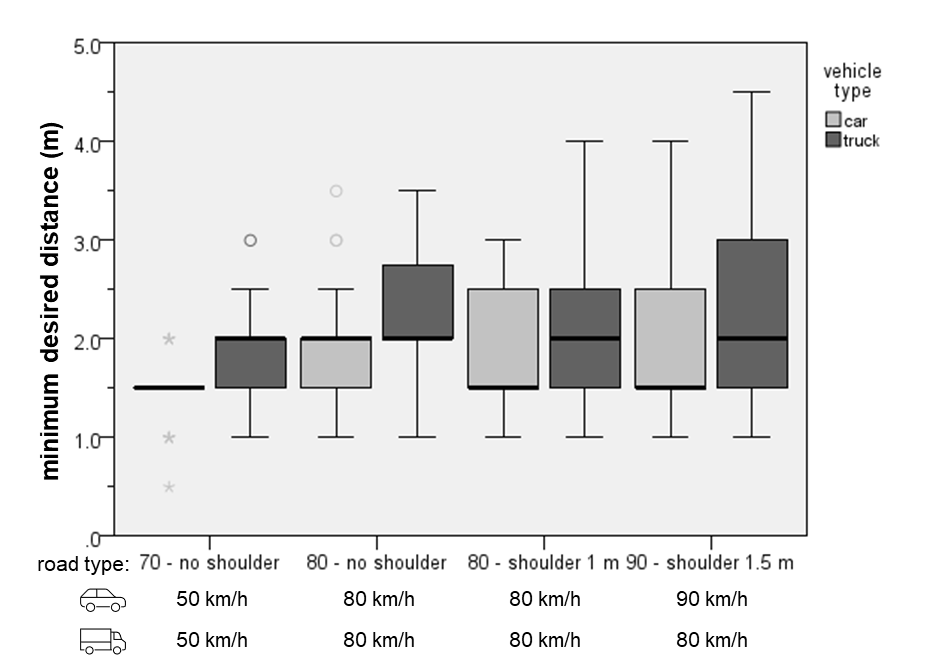
In the end of the study a questionnaire was administered containing questions including how realistic the experienced situation felt, and about the participants’ perception of overtaking in a broader context. The questionnaire also investigated where, depending on the type of road, one would position oneself laterally while cycling, whether one would change one’s lateral position with a car or truck approaching from behind, and at which lateral position one would like the car or truck to pass (Figure 4 and Table 2). Posted speed limits, the existence and width of a road shoulder, and the speed of the overtaking vehicle were varied and represented typical situations on Swedish roads. Lateral positions were indicated in steps of 0.5 m, indicating the centre of the bicycle and the outer edge of the right wheel of the vehicle. Cars were included to investigate potential differences between vehicle types.
| posted speed limit | 70 km/h | 80 km/h | 80 km/h | 90 km/h |
| shoulder width | - | - | 1 m | 1.5 m |
| overtaking vehicle speed | car: 50 km/h truck: 50 km/h |
car: 80 km/h truck: 80 km/h |
car: 80 km/h truck: 80 km/h |
car: 90 km/h truck: 80 km/h |
2.3. Participants
Twenty-three (6 females) experienced road cyclists participated in the study (mean age 42.8 ± 10.4 years). They were recruited through a questionnaire that was spread in relevant Facebook-groups and via other social media channels. 330 people started filling in the questionnaire, 234 of those completed it. The other 96 respondents either dropped out or did not meet an inclusion criterion and were therefore not eligible to continue. Inclusion criteria were road cycling experience of at least one year and being able to bring one’s own road or CX/gravel bike. Ten participants reported previous experience with riding on free rollers, three of those had much experience. Eligible participants received detailed information about the test accompanied by a link for booking a slot on a first-come-first-served basis.
The choice to recruit experienced cyclists was made on the grounds that they should be able to relate the experience on the test track to real world cycling, and that they should feel confident in the test track situation. The aim was not to treat their judgement as representative of all cyclists, but rather as benchmark for a best case, assuming that less experienced cyclists would require larger margins (Jones & Carlson, 2003).
2.4. Procedure
Upon arrival at the test facilities, the participant received detailed information about the procedures and then signed an informed consent form. For the trial the participant wore cycling clothes and a helmet and used their own bicycle. The participant practiced riding on the free rollers until comfortable. This took up to approximately five minutes.
During the trial, the participant wore a breast harness that was held by an experimenter who stood on the right side of the participant, facing the direction of the approaching truck (Figure 1). Another experimenter was in continuous telephone contact with the truck driver and conducted the short interviews with the participant after each overtake.
After starting the log equipment, the participant cycled on the rollers within 40-60 cm from the left edge of the rollers at a speed of around 25 km/h, described as “comfortable long-distance speed”. When the participant kept a stable position and speed, the reference overtake was conducted. The participant was informed that this manoeuvre corresponded to the value “0” on the discomfort-scale, and that all following overtakes should be compared with this manoeuvre.
The twelve following overtakes were conducted in a similar fashion. The interviewer informed the truck driver when the participant was ready. The overtake was conducted, with the experimenter holding the harness. When the truck had passed, the interviewer asked the participant to give a rating on the discomfort scale and to motivate the rating. The participant could then choose to take a break or to continue cycling. When the last overtake was completed, the participant stopped cycling and logging was stopped. Finally, the participant filled the concluding questionnaire.
2.5. Analysis
2.5.1. Aerodynamic load
The lateral air pressure on the cyclist including the outward push and the following pull were analysed for each overtake. The combined effect, that is the flipover load, was also computed. The flipover duration was not analysed due to noise in the signals caused by oscillations in the measurement plates after the vehicle passage.
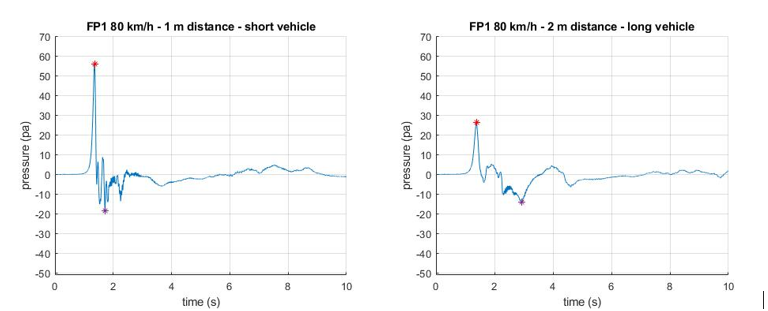
Measuring the maximum lateral force (pushing load) was straightforward. However, due to plate oscillations after the start of overtake, measurement of the minimum pressure (maximum pull) required selection of a relevant time interval: The maximum pull was set as the minimum value of the pressure signal from the start of overtake to half a second after the overtake was over. Two examples of the logged air pressure and the identified maximum and minimum lateral air pressure points are provided in Figure 5.
Air resistance tests with the two truck types had previously been measured on an outdoors test track (Cider et al., 2021). The air resistance for the short combination had a drag coefficient of Cd = 0.72 and for the long combination the coefficient was Cd = 0.8, that is, eleven per cent higher.
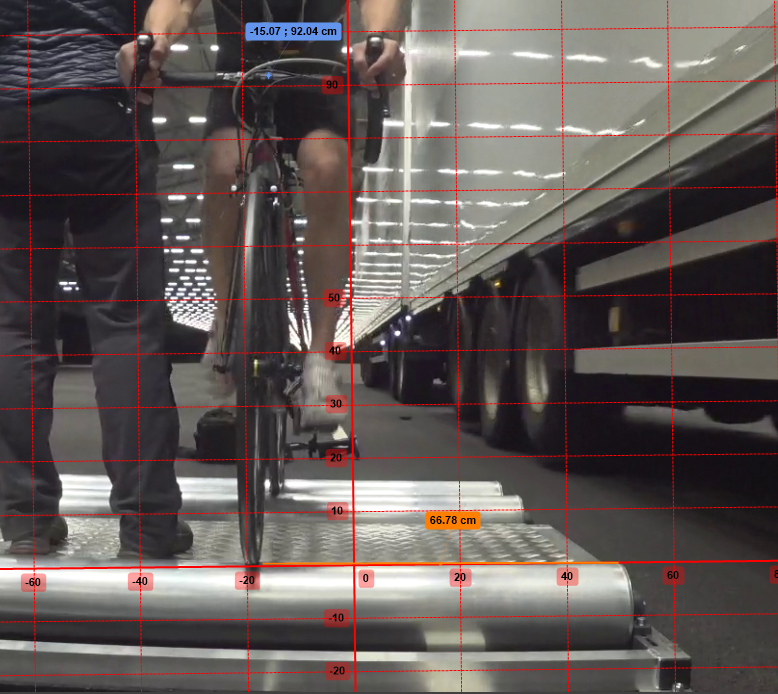
2.5.2. Lateral position of bicycle front wheel
The lateral position of the front wheel of the bicycle was logged by video tracking with the programme Kinovea (kinovea.org; Figure 6). A co-ordinate system was overlayed and the distance from the edge of the roller to the sidewall of the front wheel was tracked with 30 fps (the video framerate). For improved contrast, the edge instead of the centre of the wheel was tracked. Thus, the reported lateral position equals the distance from the left side of the front wheel to the edge of the rollers.
Analyses of the bicycle movements were centred around the overtake. The frame where the front of the truck reached the rear of the bicycle was set as “frame 0”. For comparability of the variables, equally long sections (5 s, that is, 150 frames) were extracted as follows:
-
“before”: frames -250 to -100
-
“during”: frames -50 to 100
-
“after”: frames 150 to 300
The aerodynamic forces from the overtake had dissipated by the end of the “during”-phase for all conditions.
3. Results
Measurements showed that the actual lateral overtaking distances fell within a range of ±6 cm of the target distances.
3.1. Aerodynamic load
Based on Gromke and Ruck (2021), the lateral area of the cyclists was assumed to be 0.79 square metres. This value was used to approximate the force experienced by the cyclists. As shown in Figure 7, the 17-N-boundary proposed by the FHWA (1979) was exceeded at 50 km/h for the 1-m-distance for both vehicle lengths and for all distances at 80 km/h for the outward push, and for 1 m distance and 80 km/h also for the pull phase.
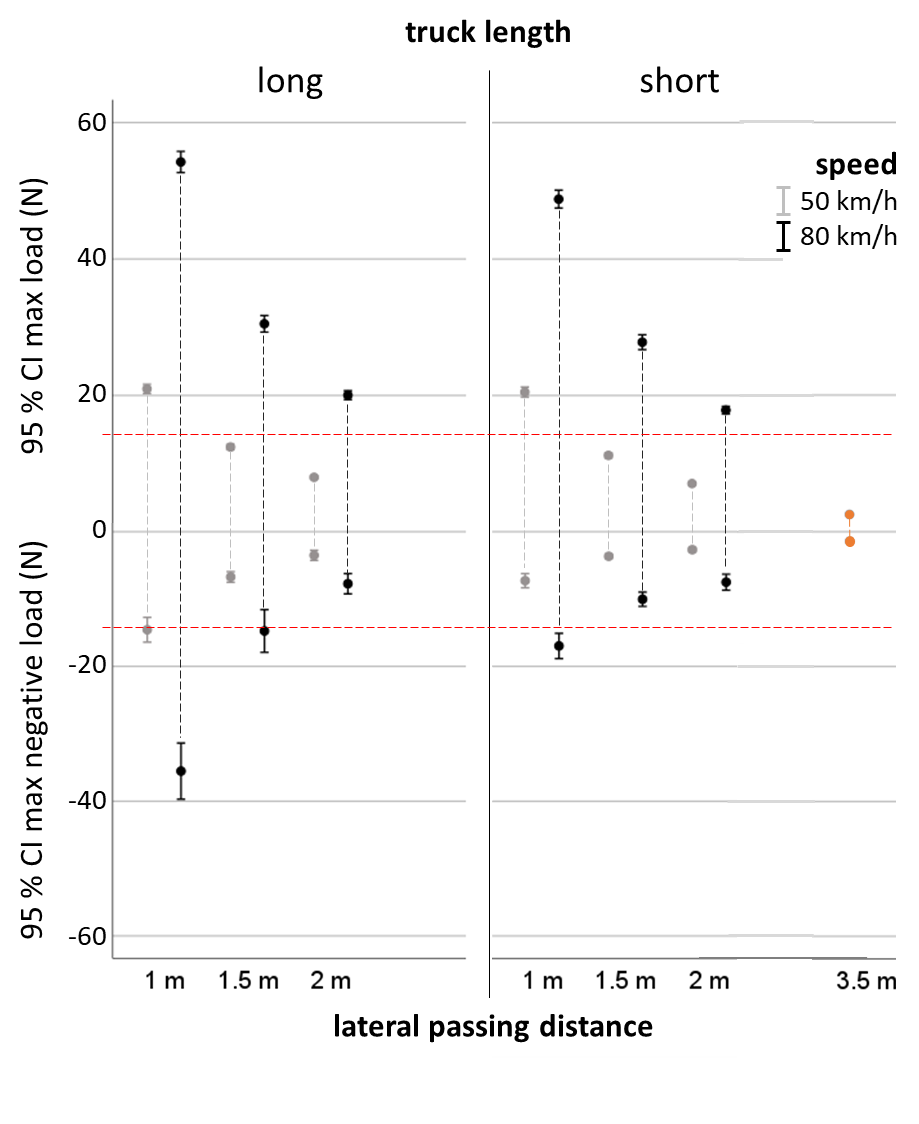
Univariate analyses of variance were performed to compare the peak push force, the peak pull force and the largest flipover load, depending on the factors distance, speed and vehicle length (excluding the reference trial). All three factors affected the three variables significantly (Table 3), with stronger effects for smaller distances, at higher speeds and for the longer truck, suggesting curvilinear relationships (Figure 7).
| max push (N) | max pull (N) | delta load (N) | |||||
| df (x, 260) | F = | p | F = | p = | F = | p | |
| speed | 1 | 6780.5 | < .001 | 302.0 | < .001 | 2116.7 | < .001 |
| distance | 2 | 3171.5 | < .001 | 235.7 | < .001 | 1177.8 | < .001 |
| length | 1 | 80.3 | < .001 | 124.3 | < .001 | 160.6 | < .001 |
| speed*distance | 2 | 571.3 | < .001 | 39.7 | < .001 | 206.9 | < .001 |
| speed*length | 1 | 28.6 | < .001 | 15.7 | < .001 | 28.5 | < .001 |
| distance*length | 2 | 3.0 | = .051 | 51.4 | < .001 | 43.6 | < .001 |
| speed*distance*length | 2 | 6.3 | = .002 | 12.5 | < .001 | 15.1 | < .001 |
An approximate doubling of the length of the truck increased the peak push load with around ten per cent, whereas the pull increased with 30-100 per cent (more for smaller distances). Increasing the speed from 50 km/h to 80 km/h, that is, with factor 1.6, led to an increase of the aerodynamic loads with factor 2.1 to 2.8. Halving the distance from two metres to one metre increased the aerodynamic load with factor 2.7 to 4.0, with higher values for the pull effect.
The peak push load for the least impactful experimental overtake, the short truck passing at 50 km/h with 2 m distance, was 2.8 times as high as that of the reference overtake. The most impactful overtake done by the long truck at 80 km/h with 1 m distance resulted in a peak push load 22 times as high as for the reference condition.
3.2. Bicycle position
For lateral position and lateral velocity of the front wheel, univariate comparisons with repeated measures (before, during, after the overtake) were made using SPSS 29.0 (2023, Armonk, NY: IBM Corp). The mean and the standard deviation of the lateral position (SDLP) were investigated as indicators of the targeted position as well as the ability to hold it accurately.
The participants had been asked to ride at 50 ± 10 cm from the edge of the rollers. In the reference condition, their mean lateral position was 43.8 ± 3.9 cm before, 43.1 ± 4.3 cm during and 43.0 ± 4.7 cm after the overtake (n. s., Greenhouse-Geisser F(1.5, 33.1) = 1.54, p = .229). The SDLP was significantly larger (4.1 cm) in the after-condition than in the before- and during-condition (both 3.1 cm; Greenhouse-Geisser F(1.6, 36.1) = 4.38, p = .026).
For the twelve experimental conditions, the mean (Greenhouse-Geisser F(1.5, 416.2) = 30.15, p < .001) and the SDLP (F(1.8, 480.1) = 55.56, p < .001) varied with the passing phase, where the mean was also influenced by the lateral passing distance (F(3.1, 416.2) = 4.2, p = .005). The average lateral position for an overtake with 2 m lateral distance was 46.8 cm and for the other two it was 4 cm larger, always with the largest distance for the during-phase. The SDLP increased from before (2.4 ± .9 cm) to during (2.8 ± 1.0 cm) to after (3.2 ± 1.2) the overtake, but was not affected by lateral overtaking distance, speed or vehicle length.
3.3. Subjective data
3.3.1. Discomfort ratings
Of all 276 experimental overtakes, one received the value “0” (on the scale from 0: same as reference overtake to 10: worst imaginable overtake) from one person, and one received the value “1” from another person. In both cases this was the condition 50km/h-2m-short. Thus, the experimental overtakes were generally rated as less comfortable than the reference condition. The 80km/h-1m-long-condition received the highest discomfort values, with an average of 8.9 and a minimum rating of 3.5.
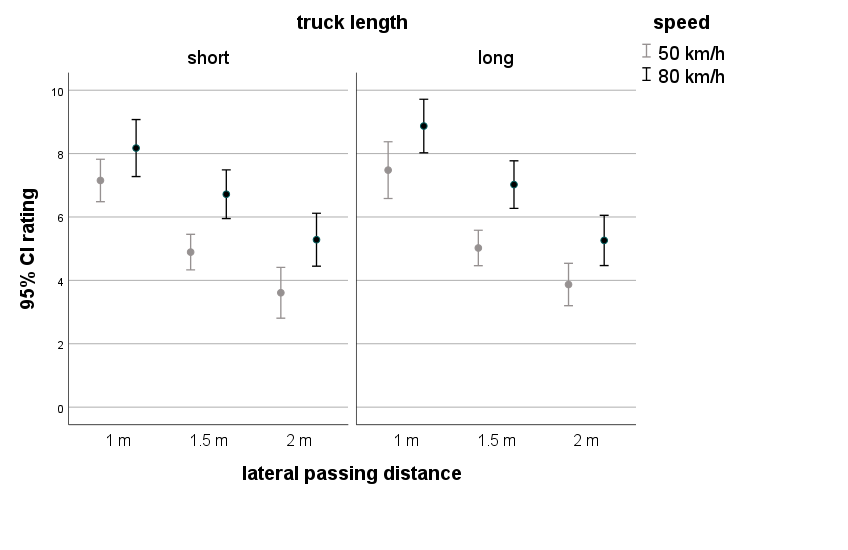
An analysis of variance with the factors speed, distance and vehicle length was performed on the subjective ratings. No interaction effects were found. Significant main effects exist for speed (F(1, 264) = 53.4, p < .001) and distance (F(2, 264) = 87.2, p < .001), but not for vehicle length (F(1, 264) = 1.78, p = .184). Higher speeds and smaller distances led to higher discomfort ratings, and Bonferroni-corrected post-hoc analyses showed that the ratings for all distance levels differed significantly from each other. As can be seen in Figure 8, a rating for a certain distance level at 50 km/h corresponds approximately to the rating for 80 km/h with the distance increased by 0.5 m.
3.3.2. Verbal reports
The notes from the participants’ verbal motivations for the discomfort rating were sorted by condition and fed into ChatGPT condition by condition with the prompt to produce a synthesised text in English. The output was compared with the original statements in Swedish to check for discrepancies. In one case an obvious misinterpretation was noted, based on the abridged form of the annotations. The synthesised texts were then used as base for the following comparative summary.
The participants’ verbal statements reflected the numeric discomfort ratings. Lateral distance was consistently described as being the most impactful factor. While a lower speed was generally appreciated, a lateral distance of one metre was reported to leave no room for error regardless of speed. In addition to the physical closeness, the aerodynamic forces were described as an aggravating factor with the potential to throw the cyclist off balance.
Especially for the 1m-conditions at 80 km/h, several cyclists expressed anger, discomfort, frustration and fear, stating that a corresponding manoeuvre in real traffic would have been a “near-death experience”. A lateral distance of 1.5 metres led to less unanimous judgements, with some cyclists feeling distinctly more comfortable than at one metre, especially with an overtaking speed of 50 km/h, whereas other cyclists still expressed that the truck was too close. A lateral distance of two metres was perceived as more comfortable, even though the aerodynamic forces were still reported as disturbing, especially for the longer truck. Several participants perceived a speed reduction in situations where the overtaking distance had been increased while the speed was kept.
The long truck was consistently described as creating a large, disturbing turbulences that lasted longer and were less predictable than those of the short truck. Especially in the 50km/h-conditions with a small lateral distance, the long truck was described as “never-ending”, or like it consisted of “several trucks in a row”, leading to a feeling of not being able to relax.
Another frequently mentioned factor was the sound of the approaching truck, which was used by the cyclists to judge the imminent overtake. The sound could be perceived as threatening or reassuring, depending on the speed of the truck. Several cyclists pointed out that they pay attention to the engine and tyre noise in real traffic, as these can provide information about the type and behaviour of the overtaking vehicle.
The cyclists expressed that the controlled situation, including the safety harness, the presence of the experimenter, the predictability of the events, and the professionalism of the truck driver led to the overtakes feeling less scary than corresponding manoeuvres would have felt in real traffic.
3.3.3. Desired lateral distance
From the answers about lateral placements in the questionnaire, the desired minimal distance for different roads and vehicle types could be deducted. The overall mean reported preferred minimal distance was 2.3 m for cars and 2.65 m for trucks. As the factors speed limit, shoulder width and overtaking speed were not varied orthogonally, the four different road types were treated as one factor, with vehicle type being the other factor entering the analysis.
Both road type (F(3, 173) = 4.77, p = .003) and vehicle type (F(1, 173) = 12.44, p < .001) had highly significant effects on the mean preferred minimum lateral distance between the bicycle and the vehicle, with no interaction effect (F(3, 173) = 0.039, p = .990). On average, the participants preferred trucks to leave a 0.38 m wider distance than cars. The smallest mean minimum distance was 1.45 m, indicated for cars overtaking at a speed of 50 km/h on a narrow country road with no shoulder. As shown in Figure 9, at least 75 per cent of the participants indicated a preferred minimum distance of 1.5 m, and for an overtaking truck more than half of the participants indicated at least two metres. There was no difference between genders for the reported preferred distance to cars (F(1, 245) = 0.0, p = .983) or trucks (F(1, 245) = 1.8, p = .18).
3.3.4. Overall subjective judgement
In the post-ride questionnaire, participants rated how realistic the setup felt on a scale from 0-10, resulting in a mean of 7.6 (std = 1.6). Additional comments specified that the aerodynamic forces, the sound of the approaching truck and the cycling on the rollers felt realistic. However, the controlled situation was generally described as more reassuring than cycling in real traffic, as there was no crosswind, no debris or road damages, no sand or other particles flying around and no other traffic, either oncoming or following the truck, such that the situation was more predictable in general. Five participants commented that they were not used to cycling on rollers, and that remaining stationary longitudinally reduced the feeling of realism in the situation.
Overall, the overtakes in the test situation were judged as feeling more comfortable than the same manoeuvre would have felt in real traffic (7.5, std 17.9, on a scale from 0: much less comfortable to 10: much more comfortable). The main factors were the controlled situation, the safety precautions, trust in the driver, and no additional unpredictable factors to consider.
Twelve out of the 23 participants stated that their opinion on overtaking did not change due to their participation in the test. Others mentioned that they now understood better how speed and distance affected their perception, with some mentioning speed and others distance being the decisive factor. It was also stated that the setup showed how much the driver can influence the situation for the cyclist.
3.3.5. Requirements for safe and comfortable overtakes
The participants were asked to express how overtakes should be regulated for four-wheeled vehicles, for heavy traffic, and for High-Capacity Transport like the truck in the trial. Ten participants suggested a minimum passing distance of 1.5 metres, even though they indicated larger desired minimum passing distances in the questionnaire. Three participants required at least two metres and five required the overtaking vehicle to either make a full lane change or keep a lateral distance equal to the overtaking vehicle’s width. Apart from that, keeping a “safe” or “reassuring” distance was mentioned, without providing a specific value. Other frequently mentioned requirements were reduced speed, good visibility, no oncoming traffic, and that motorists should wait behind the cyclist at an appropriate longitudinal distance for a suitable opportunity to overtake. Around half of the participants did not mention additional requirements on heavy traffic. The others indicated a need for a larger lateral distance or a reduction in speed. One person specified 500 m of free visibility without oncoming traffic. For High-Capacity Transport an additional speed reduction in conditions with strong wind, larger lateral distances due to the unpredictable turbulences and less predictable heeling movements of the trailer were asked for by around half of the participants, with the others not indicating any additional requirements.
3.4. Links between objective and subjective measurements
The subjective discomfort ratings correlated significantly with the maximum push load (r = .62; p < .001), with the maximum pull (r = -.527; p < .001) and the flipover load (r = .61; p < .001). This is in the same range as the correlation of the discomfort ratings with distance (r = -.59; p < .001) and higher than the correlation of discomfort with speed (r = .33; p < .001) and vehicle length (r = .06; p = .322).
A forward stepwise linear regression on the three aerodynamic load variables and speed, distance and length as potential predictors was performed with the entry criterion of a p-value of < .05. The removal criterion was p > .10. The resulting model contained lateral distance and speed as predictors, with an explained variance of R2 = 0.46.
The discomfort ratings did not correlate with any of the bicycle-related measurements (all r < .20).
4. Discussion
The subjective perception of overtakes is an important indicator, because it impacts whether people are willing to cycle on rural roads or not. Objective measurements can indicate the potential for loss of control or other physical effects. A relationship between subjective ratings and objective measurements would possibly allow a generalisation to other situations where only objective measurements can be made.
The subjective ratings were mainly affected by lateral distance, followed by vehicle speed, whereas the length of the truck was less relevant for the perceived comfort. This goes hand in hand with the measured aerodynamic load on the cyclist, which was affected in a similar way. The high correlation between the discomfort ratings and the aerodynamic load confirms the relationship. The responses to the to-scale questionnaire also indicate that higher vehicle speeds are associated with a larger desired lateral distance. The findings are consistent with Llorca et al. (2017), who found a combined effect of lateral overtaking distance and speed on perceived risk. Their finding that overtakes by trucks are perceived as less pleasant than by passenger cars is reproduced here in the larger desired overtaking distance in the to-scale questionnaire.
Further, the lateral distance of 1.5 metres, which is legally binding in a number of countries (Kircher & Niska, 2023), lies at or below the desired lateral distance for most situations for the great majority of the participants, who were experienced road cyclists. This discrepancy should be investigated further, also with respect to whether the passing distance can be assessed accurately by cyclists. For drivers some evidence exists that this is a difficult task (Black et al., 2020), even though additional studies are warranted. On the 10-step discomfort rating scale used here, the overtakes at 1.5 m distance were rated as 4.9 (short, 50 km/h) to 7.0 (long, 80 km/h) on average. While the reference overtake was defined as corresponding to the value zero, no threshold for a fully comfortable overtake was set. Therefore, based on the rating alone it cannot be said whether the distance of 1.5 metres was perceived as comfortable or not. The verbal reports bear witness that the distance was not unanimously perceived as comfortable.
Gromke and Ruck (2021) as well as Lubitz and Rubie (2018) argue that the significance of the aerodynamic load tolerance limit of 17 Newton set by the FHWA (1979) should not be overrated, not least due to the lack of empirical evidence. Still, it can be noted that in our setup, the aerodynamic load on the cyclist in the direction away from the truck remained under the tolerance limit only for the speed of 50 km/h at a distance of 1.5 m and more. A rough interpolation of the curve in Figure 7 suggests that at a distance of two metres, the threshold would be reached at around 70 km/h and at a distance of 1.5 m, the speed at the threshold is 60 km/h for the long truck. For an overtake at 80 km/h a lateral distance corresponding approximately to a full lane change would be needed to not breach the boundary. At the same time, the different loads did not leave a significant trace in the dynamics of the bicycle, which is discussed in more detail below. Future research should establish an evidence-based threshold for aerodynamic load on cyclists.
The lateral position of the bicycle was not strongly affected by the three factors varied in the study, with the only significant difference in mean lateral position being small. Also the effect on SDLP over the three phases was small. The increase in variance over time may be an indication for the cyclists concentrating and keeping a stable course before and during the overtake, to then relax somewhat in the after-phase. As the SDLP was similarly affected during the reference overtake and the experimental overtakes resulting in a higher aerodynamic load, it appears that the cyclists were not physically thrown off balance in a way that they could not compensate for. However, the absence of ambient wind and a slipstream can have influenced the results.
The SDLP for all three time slots was smaller than the average SDLP found for cycling on a real-world cycle path with conventional Dutch bikes (ca. 16 cm, Westerhuis et al., 2020). Lateral position while cycling on rollers has not yet been validated against riding on the road, even though cycling dynamics have been shown to be comparable (Cain et al., 2016; Dressel & Papadopoulos, 2012). Also, to be instructed to keep a certain lateral position, as was done here, does not correspond to how the lateral position is chosen in real traffic. The preconditions in the study led to a lateral occupation of space that corresponded to around 1.5 times the width of the bicycle. In the real world this space can safely be assumed to be larger, as situational circumstances like the quality of the road surface and ambient wind have an impact (Hatfield et al., 2018). Also, cyclists do not necessarily attempt staying at a fixed lateral position.
The voluntary and involuntary variance in lateral position of cyclists needs to be investigated further in a real traffic situation. In the present study, the cyclists knew that they would be passed by a truck and no other vehicles. In real traffic, other vehicles can follow in the wake of the truck. It remains to be established to which extent the cyclist’s lateral position is affected by the overtake and whether awareness of following traffic plays a role. An additional aspect is that for the drivers of following vehicles, the truck may block the line of sight to the cyclist. In this context, a larger passing distance can inform following drivers of the lateral space needed and provide a better line of sight.
The lack of a relationship between the factors investigated in the study and the measured bicycle dynamics are unexpected and should be examined further in a more realistic setting, also to exclude that it is an effect of riding on rollers. It is possible that the cyclist can counteract the aerodynamic effects by corresponding steering manoeuvres or a tighter grip on the handlebars. It is also possible that the test setup led to additional compensation on the side of the cyclists, such that the results found here might not fully reflect natural conditions. As outlined by Gromke and Ruck (2021), the ability to handle and counteract a load depends on how fast it is applied. In the present setting, the cyclists were well aware of the imminent overtake and could therefore prepare for it. In real traffic, the sound of the approaching vehicle can provide the cyclist with clues, but predictability can be assumed to be lower. Ambient wind coming from the side of traffic could have a significant effect on how well the aerodynamic forces of the overtaking vehicle can be counteracted. This needs further investigation.
4.1. Method
Overall, the cyclists reported that despite the controlled setup a realistic feeling of the overtakes was conveyed. They therefore felt confident in their judgements. They also reported feeling safe in the situation, due to the harness, the presence of the experimenter and the competence of the driver.
4.1.1. Limitations
Due to the controlled setup, the participants were prepared for the overtakes in a different way than in real traffic. This is also reflected in the participants’ statements that the setup felt safer than similar overtakes in real traffic. Cycling on free rollers closely reflects real cycling with respect to vehicle dynamics, except for the lack of forward momentum (Cain et al., 2016; Dressel & Papadopoulos, 2012). However, the visual impression is different, leading to a feeling that it is more difficult to keep one’s balance. This can have affected the participants’ judgement. On the other hand, participants reported feeling comfortable after a short period of training, and none of the participants wanted to abandon due to discomfort on the rollers.
Cycling on rollers may have affected the lateral control. Unpublished preliminary comparisons in a setting without external disturbances did not show any noticeable differences when riding straight on, but no validation has been made for overtaking situations. Therefore, complementary studies in real traffic are recommended.
The study participants were experienced road cyclists and therefore familiar with the situation of being overtaken by large vehicles at high speed. It can be assumed that their bike handling skills are above average and that they have experience in how to deal with aerodynamic forces while riding. Evidence shows that experienced cyclists feel more comfortable in the same rural road situation than less experienced cyclists (Jones & Carlson, 2003; Kircher & Lindman, 2024). This, combined with the fact that people who do not cycle today were found to have qualitatively different perceptions about barriers to cycling (Fishman et al., 2012), is a strong indicator of the present findings being a “best case” threshold.
The safety requirements and the spatial limitations of the test site did not allow a setup where the cyclist moved freely. Also, measurements were easier to conduct with the stationary setup. Due to the static longitudinal position, the relative speed between the cyclists and the truck did not correspond to the real expected relative speed, and the cyclists did not experience any slipstream from their own movement. A potential improvement could have been a fan in front of the cyclist to provide the illusion of a slipstream.
Due to the higher relative speed, the time the truck spent next to the cyclist was shorter than in reality. This can have affected both the subjective judgements and the aerodynamic effects. Considering that the lateral space occupied by the cyclist increased over time during the overtake, the time that is spent next to the body of the truck may be a relevant factor for safety. This means that a speed reduction may not be an appropriate compensation for a reduced clearance, because the cyclist is adjacent to the truck for longer. Thus, a speed reduction cannot be an argument to undercut a certain minimum clearance. Additionally, a reduced speed the truck will spend more time in the oncoming lane, which impacts requirements on sight distance and gaps in oncoming traffic. On the other hand, traffic following the truck will be slowed down, too, which is expected to have a positive effect on safety. This could be especially relevant in situations with several lanes per direction. Studies in real traffic and traffic simulations could shed more light on those questions.
Future research in a real-world setting should include factors that cannot be assessed in a laboratory, like the behaviour of drivers following the truck, how cyclists choose their lateral position depending on the circumstances, etc. It would also be beneficial to assess the driver’s perspective for alignment with the cyclists’ perspective. The goal should be to establish overtaking rules that are experienced as safe and comfortable by cyclists and that can be easily understood and implemented by drivers.
5. Conclusions
Lateral clearance is the most crucial of the investigated factors for the aerodynamic load and for how comfortable an overtake feels for a cyclist. A speed reduction alleviates the load impact and reduces discomfort. Still, even the short truck passing with two metres distance at 50 km/h caused notably more discomfort than the reference manoeuvre. Considering that keeping a lateral distance of two metres when overtaking a cyclist implies in most cases that the truck invades the oncoming lane or the next lane in the same direction, there is no reason for the truck driver to not perform a full lane change. In addition to providing the cyclist with as much room as possible and thereby minimising the negative impact on the cyclist, this would also enable following drivers to see the cyclist earlier and may support them in preparing a safe overtake themselves.
A speed reduction during the overtake has both benefits and drawbacks, as detailed above, and the consequences need to be assessed comprehensively. It is important to incorporate the drivers’ and cyclists’ perceptions, as these are preconditions for drivers to reliably adhere to the rules and for cyclists to feel comfortable on the roads.
Acknowledgements
We would like to thank Anton Kjörck Lindén, Sara Kircher and My Weidel for their invaluable help during the data collection and Prof. Arend Schwab and Prof. Christof Gromke for their competent support in the planning phase.
CRediT contribution
Katja Kircher: Conceptualisation, Data curation, Formal analysis, Methodology, Resources, Writing – original draft. Sogol Kharrazi: Conceptualisation, Data curation, Formal analysis, Writing - original draft, Writing – review & editing. Lennart Cider: Conceptualisation, Data curation, Funding acquisition, Resources, Writing – review & editing. Jesper Sandin: Conceptualisation, Data curation, Funding acquisition, Project administration, Writing – original draft, Writing – review & editing. Lena Larsson: Funding acquisition, Resources, Project administration, Writing - review & editing.
Declaration of competing interests
The authors report no competing interests.
Declaration of generative AI use in writing
During the preparation of this work the authors used ChatGPT 4.0 to summarise and translate the verbal expressions of the participants from Swedish to English. After using this tool, the authors reviewed and edited the content as needed and take full responsibility for the content of the publication.
Ethics statement
The methods for data collection in the present study have been approved by Swedish Ethical Review Authority (Decision 2022-06608-01).
Funding
The research was funded by the Swedish Innovation Agency Vinnova (2019-03103) in addition to in-kind contributions by Volvo Technology.
Editorial information
Handling editor: Stijn Daniels, Transport & Mobility Leuven | KU Leuven, Belgium
Reviewers: Iain Knight, Apollo Vehicle Safety, the United Kingdom; James Sinclair, PassBox, Australia