Winter slip-and-fall accidents in Finland: characteristics and views on their prevention
Abstract
Outdoor falls, such as winter slip-and-fall accidents, represent a substantial pedestrian safety issue in countries with cold and snowy winters like Finland. Such falls are typically not considered traffic accidents nor are they included in traffic safety policy objectives or accident statistics. This survey study aimed to explore experiences of winter slip-and-fall accidents in Finland, estimate their frequency and investigate views regarding their prevention to inform efforts aiming to increase the role of walking. Data was collected with an online survey directed to Finnish residents (n=1,215), which queried the characteristics of slip-and-falls occurring during the winter of 2020–2021, their consequences, and views regarding their prevention. The results suggest that slip-and-falls occur often in Finland, with just over one third of respondents having experienced at least one. Slip-and-falls frequently occurred on yards or pavements and in icy or snowy conditions, and frequently reported contributing factors include unexpected slippery spots on the walking surface, poor winter maintenance and poor footwear traction. Respondents considered improved winter maintenance and using appropriate footwear, such as anti-slip devices, as important ways to prevent falls. The results suggest that the walking during winter in Finland is not safe, and a combination of personal and public measures could result in the most effective strategy to prevent slip-and-falls. The omission of slip-and-fall accidents from traffic safety policy arguably results in a misleading image of pedestrian safety. The results of this study support the inclusion of pedestrian falls as pedestrian single accidents.
1. Introduction
Walking is an environmentally benign form of travel associated with a broad range of health benefits, including reduced risk of chronic diseases and premature mortality (Lee & Buchner, 2008). As such, increasing the role of walking is especially desirable from environmental and public health perspectives due to the need to mitigate the environmental impact of transport and reverse the trend of declining physical activity levels (Alessio et al., 2021; Chapman, 2007; Jaramillo et al., 2022; Watts et al., 2015). Transport accounts for approximately 23% of global greenhouse gas emissions (IEA, 2023), and the total annual costs of global physical inactivity are estimated to be approximately USD 27 billion (WHO, 2022). As part of efforts to increase walking, it is essential to ensure safe walking conditions (Morency et al., 2012). However, the World Health Organisation considers falls, which often occur while walking, as the second greatest cause of unintentional injury after road traffic injuries, with an estimated 37.3 million falls requiring medical attention and approximately 684,000 fatal falls annually (WHO, 2021). Furthermore, EU statistics show that vulnerable road users account for approximately two thirds of all road traffic casualties, of which approximately two thirds are single accidents (Methorst et al., 2016).
Pedestrian single accidents, of which fall accidents are the majority (Methorst et al., 2016, 2017), represent a substantial pedestrian safety issue. This is especially relevant for countries with cold and snowy winters like Finland due to the prevalence of outdoor slip-and-fall accidents. Although the issue has received academic attention since the 1970s (Aldman et al., 1975), pedestrian falls are typically not considered traffic accidents nor are they included in traffic safety policy objectives (Methorst et al., 2016, 2017). Exceptions include the Swedish Traffic Accident Acquisition (STRADA) database and the recent inclusion of pedestrian falls as part of traffic safety targets in Sweden (Amin et al., 2022). Moreover, as noted by Schepers et al. (2017) few recent studies have focused on pedestrian falls. This has led to a knowledge gap on pedestrian slip-and-fall accidents, hindering the implementation of measures and policies targeting aspects of pedestrian safety that are not associated with accidents involving vehicles. This survey study aimed to address this knowledge gap by exploring experiences of slip-and-fall accidents occurring outdoors during winter in Finland, estimating their frequency as well as investigating views regarding their prevention to inform efforts aiming to increase the role of walking. Methorst et al. (2017) recommend including pedestrian falls occurring on public roads as part of the definition of traffic accidents. In this study, we consider a broader scope by focusing on all outdoor pedestrian falls occurring due to slipping, including falls occurring in private outdoor spaces such as the yards and courtyards of homes.
2. Background
2.1. Frequency of slip-and-fall accidents
Slip-and-falls typically occur when a foot slide results in a loss of balance (Grönqvist et al., 2001). They can result in serious injury and even death, leading to substantial annual societal costs (Berntman, 2015; Björnstig et al., 1997; Gyllencreutz et al., 2015; Malin et al., 2022; Methorst et al., 2017; Penttinen et al., 1999; Vuoriainen et al., 2000). Penttinen et al. (1999) estimated that approximately 20,000–100,000 slip-and-fall accidents occur annually in Finland based on a set of previous Finnish estimates. Malin et al. (2022) estimated the figure to be approximately 75,000 based on general accident statistics (the size of the Finnish population is approximately 5.6 million). The estimate of Malin et al. (2022) corresponds to societal costs of approximately EUR 1.4 billion.
Although winter slip-and-falls are estimated to occur frequently, accurate figures are not known in most countries since pedestrian falls are typically omitted from traffic accident statistics. This is due to lack of vehicle involvement, which is generally a prerequisite for inclusion (Methorst et al., 2017). An exception to the above is Sweden, where pedestrian single accidents such as falls have been recorded in the STRADA database. Based on this database, Berntman (2015) estimated that of all reported pedestrian injuries in Sweden during 2009–2013 (n=66,153), approximately 94% were due to either slipping or falling, and approximately 25% were considered severe based on the Risk of Permanent Medical Impairment (RPMI) being at least 1%. Amin et al. (2022) also estimated with the hospital data in the STRADA database that 94% of pedestrian injuries between 2010–2019 were caused by falls (n=117,916). Among these, a similar proportion of approximately 25% had an RPMI of at least 1%, approximately 53% represented moderate injuries (MAIS2+), and approximately 4% represented serious injuries or worse (MAIS3+) during 2010–2019. Other studies also suggest that pedestrian falls account for a large proportion of pedestrian injuries (Elvik & Bjørnskau, 2019; Methorst et al., 2017; Oxley et al., 2018), despite not being included in official traffic accident statistics. Therefore, the omission of pedestrian falls may lead to a misleading image of pedestrian safety, since falls typically occur while travelling, arguably representing a traffic safety blind spot (Gyllencreutz et al., 2015; Li et al., 2006; Methorst et al., 2017; Oxley et al., 2018; Schepers et al., 2017).
Past Finnish survey results show that approximately 30–40% of respondents had slipped and fallen during the winter preceding the surveys (Anttila, 2001; Finnish Road Safety Council, 2021; Penttinen et al., 1999; Rantala & Pöysti, 2015). These surveys investigated whether medical care (seeing a doctor or nurse) was required due to falling, with 6% responding affirmatively in Penttinen et al (1999), 14–15% in Finnish Road Safety Council (2021) and 12% in Pöysti (2014). Approximately 90% of respondents in (Pöysti, 2014) reported having experienced a slip-and-fall at least once during their lifetime, and 29% had seen a nurse or doctor as a result at least once.
2.2. Factors contributing to slip-and-fall accidents
Winter weather conditions are strongly associated with pedestrian falls (Bärwolff et al., 2022; Bärwolff & Gerike, 2024; Berggård & Johansson, 2010; Gyllencreutz et al., 2015), and icy and snowy walking conditions can substantially increase the risk of falling while walking. In their assessment based on hospital data from Oslo, Norway, Elvik and Bjørnskau (2019) estimated that the risk of falling while walking is approximately doubled when the walking surface is icy or snowy compared to a surface with no ice or snow. Furthermore, they assessed the risk of falling as a pedestrian to be approximately 90–110 times greater than being injured as a car occupant. In Sweden, Berggård & Johansson (2010) calculated that the risk of a pedestrian fall on an icy and snowy surface is approximately three times that of walking on uncovered ground. Bärwolff & Gerike (2024) estimated a much higher figure based on a combination of German household travel survey data, weather data and field surveys based on video footage gathered at 13 different locations. They estimated that the risk of falling when walking in snowy or icy conditions to be 7.8 falls per 10,000 kilometres walked, which is approximately 32 times greater than walking in other conditions. The authors also found that those aged 65 and above had a lower risk of falling but were more likely to receive medical treatment due to falling. Additionally, Fossum (2022) found that small unexpected slippery spots that have significantly less friction than the surrounding surface contribute to a large number of winter pedestrian falls. Surface conditions on pavements are not always homogeneous during winter (Fossum, 2022).
Of falls investigated by Berntman (2015), 66% were associated with poor or missing anti-skid treatment, and snowy or icy surface conditions were related to approximately 60% of pedestrian falls. Amin et al. (2022) also found that poor traction due to snow and ice contributed to approximately 56% of pedestrian falls. Similarly, in the Finnish study by Penttinen et al. (1999), walking surface conditions when falls occurred were typically icy, or snowy and icy.
Peak days of slipping injuries have been observed to typically follow periods of temperatures close to zero degrees Celsius, snowfall, or temperature fluctuations around zero degrees Celsius that result in ice formation (Bentley & Haslam, 1998; Hippi & Kangas, 2022). Older Finnish studies also found that the above weather conditions typically preceded peak days (Anttila, 2001; Penttinen et al., 1999). The effects of climate change are expected to increase the frequency of slippery walking conditions in the future, but reduce the overall length of the period when such conditions occur (Hippi & Kangas, 2022).
Results from past surveys in Finland suggest that most slip-and-falls occur while walking on streets, approximately 50% of falls, and yards (such as courtyards and the front and back yards of homes), approximately 30% of falls (Penttinen et al., 1999; Rantala & Pöysti, 2015). Amin et al. (2022) found that in Sweden, pedestrian falls were distributed to walking areas (54%), streets and roads (26%), and shared areas (18%).
In a review of studies on pedestrian falls, Schepers et al. (2017) determined that those who walk more weekly kilometres have a greater probability of experiencing a fall. In one of the cited studies, this relationship was analysed with negative binomial regression (Li et al., 2014). However, as noted in Schepers et al. (2017), the effect did not increase proportionally: Those who reported walking 0.5–1.3 kilometres per week walk approximately 3 times more than those walking 0.1–0.5 kilometres per week, but the incidence rate ratio of falling was only 1.7 times greater. According to Schepers et al. (2017), only a few studies have investigated the relationship between distance walked and fall probability.
The consequences of slip-and-fall accidents are not felt equally across the population. Certain groups are at greater risk of slipping and/or are more likely to experience severe consequences. In general, women are estimated to fall more often than men in absolute figures, and the risk of injury due to falling relative to kilometres walked is also estimated to be significantly greater for women than men (Björnstig et al., 1997; Elvik & Bjørnskau, 2019; Gyllencreutz et al., 2015; Koukka et al., 2001; Penttinen et al., 1999; Vuoriainen et al., 2000). Although the elderly reported the fewest slip-and-falls of any age group in the survey study by Penttinen et al. (1999), the risk of injury due to falling relative to kilometres walked has been shown to increase with age, potentially due to poorer balance, motor functions, and vision (Bärwolff & Gerike, 2024; Bergland et al., 2003; Gao & Abeysekera, 2004; Morency et al., 2012). Elderly women are especially vulnerable in fall accidents, (Björnstig et al., 1997; Ekbrand et al., 2020; Elvik & Bjørnskau, 2019; Luukinen et al., 2000; Pavol et al., 1999; Penttinen et al., 1999; Schepers et al., 2017; Vuoriainen et al., 2000), which may be associated with their greater risk of osteoporosis (Ettinger et al., 1999). The recovery period due to falling is generally long for the elderly, and may substantially increase the difficulty of performing daily tasks (Koukka et al., 2001; Pavol et al., 1999). The elderly may also avoid walking due to fear of falling (Lehmuskoski et al., 2002), reducing their independent mobility and physical activity. The above is a concern especially for countries with aging populations, as the size of the population at greater risk of injury due to falling in the future will increase (Methorst et al., 2017). Walking can provide beneficial levels of physical activity for older adults (Visser et al., 2002), and it is important to maintain their ability to walk year-round.
2.3. Prevention of slip-and-fall accidents
Winter maintenance can help prevent slip-and-fall accidents. Its primary purpose is to increase friction on the walking surface to ensure walkability during winter conditions (Abeysekera & Gao, 2001; Elvik et al., 2009). Snow clearance and removal, salting, sanding and pavement heating are among the most common forms of winter maintenance (Elvik et al., 2009). There are few studies on the effect of winter maintenance on the number of pedestrian fall accidents. The Handbook of Road Safety Measures by Elvik et al. (2009) mentions only two studies that have evaluated the effect of improved winter maintenance on pedestrian falls, based on which the authors estimate that falls reduce by 15% (95% CI: -22%—7%) if pedestrians are exposed 10% less to snowy or icy walking surfaces. Fossum (2022) also calculated that the risk of a pedestrian fall accident is 14 times greater on clean ice and 7 times greater on gritted ice compared to compacted snow, suggesting that gritting pavements can reduce accident risk. Amin et al. (2024) also estimated that in the four Swedish cities included in their study, the probability of avoiding injury when walking on ground source heat pump based heated pavements is approximately 3.8 (95% CI: 2.6–5.5) times that of non-heated pavements, therefore showing a significant effect on injury reduction. Such pavements were considered particularly effective in cities with plenty of ice and snow.
Walking on treated surfaces is associated with a greater sense of safety than walking on untreated snowy or icy surfaces (Gard & Lundborg, 2000), and good winter maintenance was considered important for walking activity among older adults in Norwegian and Swedish survey studies (Krogstad et al., 2015; Wennberg et al., 2009). Past research from Finland and Sweden suggests that the total costs incurred from winter slip-and-fall accidents are substantially greater than the costs associated with winter maintenance (Mattsson, 2017; Myllylä et al., 2006).
Pedestrians can also influence their personal fall risk by for example wearing appropriate footwear (Gao & Abeysekera, 2004). This could include winter shoes, studded shoes or attachable anti-slip devices (Hsu et al., 2016). A footwear subsidy programme, in which attachable anti-slip devices were provided freely to residents above the age of 65 in Gothenburg, Sweden, was estimated to reduce emergency department visits due to pedestrian falls by 45% in its first year, corresponding to approximately 22 prevented injuries (Bonander & Holmberg, 2019). Similar results were obtained by McKiernan (2005), who found that the use of attachable anti-slip devices was associated with a statistically significant relative outdoor slip risk of 0.5 among people aged 65 or older in Minocqua, Wisconsin, and Berggård & Johansson (2010), who found that the risk of falling among those who do not wear anti slip devices is almost three times that of the risk of falling on uncovered ground. Holmberg et al. (2022) estimated a 7.5% greater use rate of anti-slip devices in Swedish municipalities that had programmes for their distribution, suggesting that such programmes can play a meaningful role in preparing for slippery walking conditions. The use of footwear with anti-slip properties is a particularly cost-effective way to prevent slip-and-fall accidents from a societal perspective (Penttinen et al., 1999).
Other measures to prevent slip-and-falls include informational campaigns and pedestrian weather warning systems. Considerable resources are spent on such campaigns in Finland annually (e.g. the “Do not fall” campaign by the Finnish Road Safety Council (2023)), as well as on pedestrian weather warning systems (Hautala & Leviäkangas, 2007; Hippi et al., 2020). However, the effect of informational campaigns on slip-and-fall accidents is unclear. Hautala & Leviäkangas (2007) estimate the effect of weather warning services to prevent approximately 2–3% of slip-and-fall injury accidents each year.
2.4. Falls and willingness to walk
Fear of moving outdoors and fear of falling is related to reduced mobility, especially among older adults (Krogstad et al., 2015; Rantakokko et al., 2009; Zijlstra et al., 2007). Rantakokko et al. (2009) found that “poor street conditions” correlated with such a fear, and that those with a fear of moving outdoors were significantly more likely to develop walking difficulties compared to those without fear. In addition, a study on the correlates of fear of falling among people aged 70 or above found that being 80-years-old or older, having experienced multiple falls as well as poor perceived general health were independently associated with both fear of falling and avoidance of physical activity (Zijlstra et al., 2007). Furthermore, a study by Wijlhuizen et al. (2007) on adults over the age of 65 in Friesland, The Netherlands found that those with a strong fear of falling typically have a low to moderate level of outdoor physical activity. Berggård & Johansson (2010) also found that users of anti-slip devices typically walked more kilometres than those who did not. These findings further underline the importance of maintaining walkable surfaces and preparing for slippery conditions to encourage walking, prevent falls and maintain independent mobility, physical activity and health. Research concerning fear of falling or moving outside has focused on the experiences of older people, with limited research on younger populations.
3. Data and method
Data for this study was collected with an online survey directed to Finnish residents in April 2021. In addition, 20 responses from those over the age of 80 were gathered through phone interviews to ensure suitable representation of older people. The total sample size was 1,215 respondents. The purpose of the survey was to investigate the frequency and characteristics of slip-and-falls, their consequences and explore views regarding their prevention. A survey was used, because no reliable database for pedestrian falls exists in Finland and details concerning falls were required. Respondents were accessed through an online survey panel provided by market research company Taloustutkimus Oy. The older respondents contacted via phone interview were also recruited from the same survey panel.
Of respondents, 45.1% were male and 54.9% were female. The proportion of females is slightly greater than that of people over the age of 17 in the Finnish population (50.8%, OSF, 2024). The age distribution also differs somewhat from the Finnish population. The proportion of 30–40-year-olds is slightly underrepresented, and the proportion of 20–30-year-olds and 60–70-year-olds is slightly overrepresented (OSF, 2024). This may be related to the high frequency of slip-and-falls among young people and the more serious consequences of falls of the elderly. Respondents were categorised into four age groups, which all contain approximately 25% of respondents: 17–32, (n = 324), 33–51, (n = 284), 52–66, (n = 310) and 67–93-year-olds (n = 297).
A somewhat nonrepresentative survey sample was expected, since survey panels typically consist of participants who have agreed to be contacted to fill in surveys and these may result in nonprobability samples which do not accurately represent the target population (Callegaro et al., 2014). However, to account for the disparities in the age and gender distributions between the survey data and the population, sampling weights for respondents were calculated according to differences between the sample and the population (Table 1). Population structure data was obtained from Statistics Finland (OSF, 2024). All following results in the study concern the weighted sample.
| Gender | Age group | Proportion (%) (population) |
Proportion (%) (survey) |
N (unweighted) |
N (weighted) |
Sampling weight |
| Female | 17–32 | 11.1 | 17.2 | 209 | 135 | 0.648 |
| 33–51 | 14.2 | 10.7 | 130 | 173 | 1.330 | |
| 52–66 | 11.4 | 15.0 | 182 | 139 | 0.764 | |
| 67–93 | 13.9 | 12.0 | 146 | 169 | 1.158 | |
| Male | 17–32 | 11.9 | 9.5 | 115 | 144 | 1.256 |
| 33–51 | 15.1 | 12.7 | 154 | 183 | 1.191 | |
| 52–66 | 11.2 | 10.5 | 128 | 137 | 1.068 | |
| 67–93 | 11.0 | 12.4 | 151 | 134 | 0.888 |
The survey (Appendix 1) asked respondents whether they had fallen due to slipping during the winter of 2020–2021, how many times they had fallen, details of the most serious fall they had experienced as well as background information such as age and gender. Details concerning slip-and-falls included the type of walking environment where the fall occurred, condition of the walking surface and factors contributing to the fall and the consequences of the fall. In addition, some questions related to the perceived importance of measures to prevent slip-and-falls, as well as how important winter maintenance was considered in different travel environments, with responses given on five-point Likert scales. For these items, it was also possible to respond “Not sure”. Some of the questions regarding falls and their details are based on past similar surveys (e.g., Anttila, 2001; Penttinen et al., 1999; Rantala & Pöysti, 2015), with some additions based on the literature reviewed in the introduction. A similar survey-based methodology to investigate accidents and conflicts has been used in a previous study related to collisions and near accidents between pedestrians and cyclists (Mesimäki & Luoma, 2021). The winter of 2020–2021 was snowy across the entire country.
3.1. Statistical analysis
As the reviewed literature suggests that women and older people are at risk of more serious consequences from falls than men and younger people, responses to some questions were analysed with Rao-Scott adjusted Chi-Squared tests for independence across age and gender. Moreover, the relationship between self-reported weekly kilometres walked and having experienced a fall was examined with logistic regression while controlling for age group, gender and the use of winter shoes and anti-slip devices. In addition, Likert scale questions were analysed by age group and gender with a factorial ANOVA using type III sums of squares. “Not sure” answers were removed prior to running the ANOVAs. A 95% significance level was used in all analyses. In order to consider sampling weights, all analyses were implemented with the “survey” package for R. Chi-square tests were implemented with the svychisq command. The logistic regression model and ANOVAs were implemented with the svyglm command and the statistical significance of individual variables in the ANOVAs was evaluated with the regTermTest command.
4. Results
4.1. Frequency and characteristics of slip-and-falls
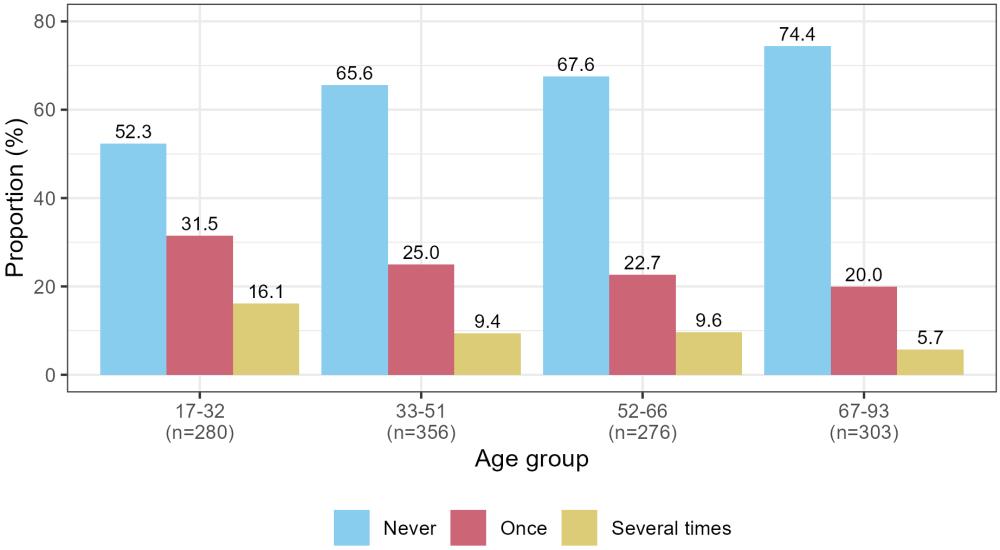
During the winter of 2020–2021, 24.7% of respondents reported having fallen due to slipping once, and 10.1% reported having done so several times. Therefore, 34.8% (n=423) of respondents had fallen due to slipping at least once. Most slip-and-falls were reported in January (30.2%), February (26.0%) and March (20.6%), and the least were reported in October (1.3%), November (3.1%) and December (9.2%).
The youngest respondents had fallen due to slipping most frequently, and the oldest respondents least frequently (F(5.9, 7219.5) = 5.7, p<0.001, Figure 1). A larger proportion of women (35.0%) had reported a slip-and-fall than men (34.6%), but the difference was not statistically significant.
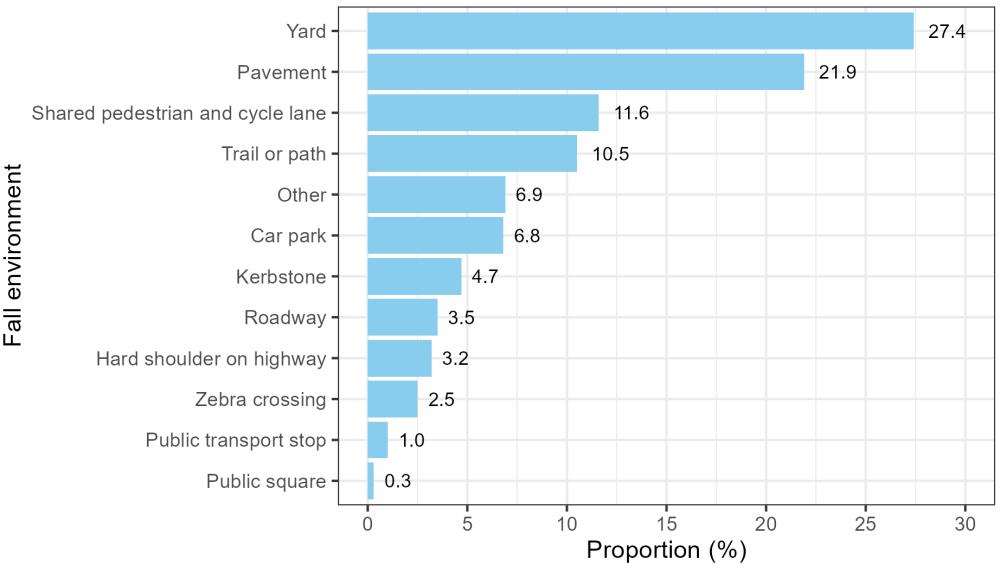
Respondents who reported a slip-and-fall were asked to provide details concerning the most serious fall they had experienced during the winter of 2020–2021. Details from a total of 423 slip-and-falls were obtained. The proportions of different travel environments where these falls occurred are presented in Figure 2. The most common environments were yards (such as courtyards, front and back yards of homes) (27.4%), pavements (21.9%) and combined pedestrian and cycle lanes (11.6%) and trails or paths (10.5%). The least common environments were public squares (0.3%), public transport stops (1.0%) and zebra crossings (2.5%).
The reported condition of walking surfaces when the slip-and-fall occurred are presented in Figure 3. Respondents were able to select multiple options. The walking surface was typically covered in ice (41.1%), ice with a thin layer of snow (40.5%), or hard-packed snow (19.3%). Furthermore, respondents reported that the slippery conditions had come as a surprise to them in almost half (45.8%) of falls. The temperature at time of slipping was usually freezing (54.9%) or freezing but approximately zero degrees (22.9%). Only 7.5% of reported falls occurred in temperatures above zero. Respondents failed to recall weather conditions for 14.8% of falls.
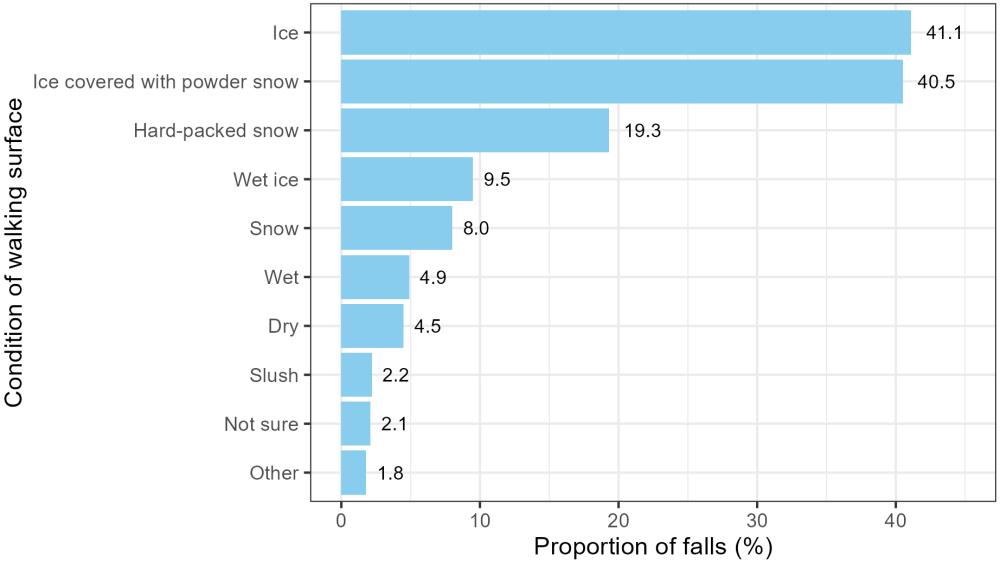
Figure 4 presents the reported consequences of falls. Selecting multiple consequences was possible. Of falls, 59.2% were associated with at least one consequence. The most common consequences were starting to walk more carefully on slippery surfaces (35.4%), starting the use of studded shoes or anti-slip devices (13.9%) and preferring not to walk outside during slippery conditions (9.8%).
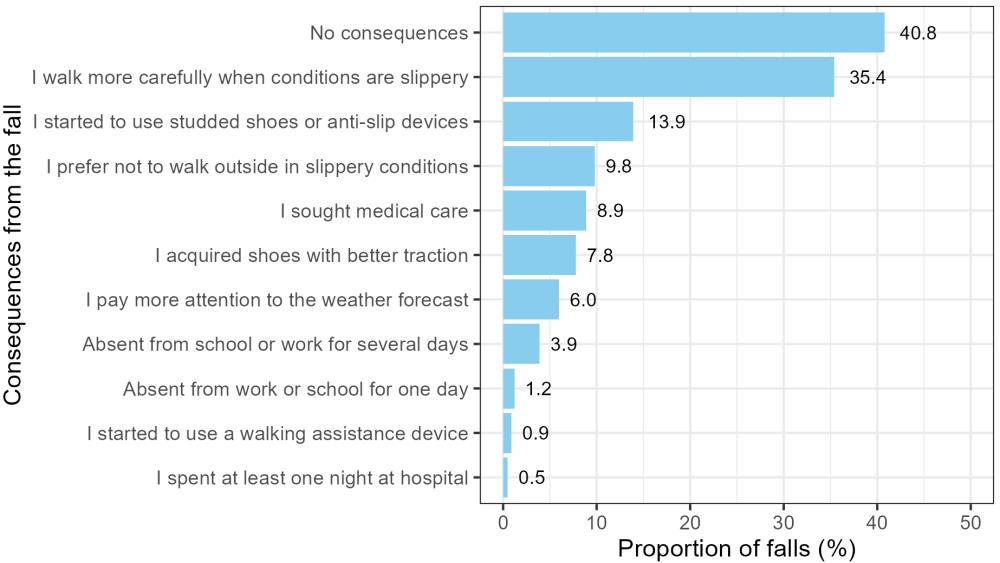
Older age groups reported experiencing a consequence due to falling significantly more often than the youngest respondents (F(3.0, 3602.2) = 13.4, p<0.001), but no significant difference by gender was detected. Of 17–32 and 33–51-year-olds who had fallen, 48.5% and 54.9% reported a consequence, while the corresponding figures for 52–66 and 67–93-year-olds were 72.3% and 69.2%. Furthermore, respondents reported preferring not to walk during slippery conditions due to the fall significantly more often in the two oldest age groups (11.5% and 20.5%) than the two youngest age groups (7.3% and 4.4%) (F(2.9, 1244.8) = 4.8, p=0.003). Additionally, the consequence was reported significantly more often by women who had fallen (14.0%) compared to men who had fallen (4.7%) (F(1, 428) = 9.9, p=0.002). Of falls, 8,9% resulted in seeking professional medical care.
Respondents were asked to estimate how many kilometres they typically walk per week on average during winter (November to March). According to the results, 27.7% reported walking 6–10 kilometres, 23.5% walk 1–5 kilometres, 23.0% walk 11–20 kilometres, 10.8% walk 21–30 kilometres, 9.3% walk more than 30 kilometres and 5.8% walk less than 1 kilometre per week.
The relationship between falling and self-reported estimated weekly kilometres walked was analysed with logistic regression while controlling for age group, gender, and the use of winter shoes and anti-slip devices (Table 2). According to the results, those who reported walking 21–30 kilometres per week and over 30 kilometres per week had significantly larger odds of having experienced a fall relative to those who reported walking fewer weekly kilometres. Specifically, the odds of experiencing a fall is 2.5 times greater for those walking 21–30 km per week and 2.2 times greater for those walking over 30 km per week compared to the reference category of individuals walking less than 1 km per week. However, fall probability does not increase linearly with distance walked. The probability of falling is only significantly different when the amount of walking is approximately at least 20 times greater than in the reference category. Consistent with results from the Chi-Square tests, the results also show that the probability of experiencing a fall decreases with age. Moreover, there was no significant effect for gender or use of winter shoes or anti-slip devices.
| Variable | Odds ratio | 95% confidence interval | ||
| Intercept | 0.56 | 0.29 | 1.10 | |
| Self-reported weekly kilometres walked during winter | Less than 1 km/week (reference, n=70) |
|||
| 1–5 km/week (n=285) |
1.29 | 0.71 | 2.37 | |
| 6–10 km/week (n=337) |
1.35 | 0.75 | 2.44 | |
| 11–20 km/week (n=279) |
1.33 | 0.73 | 2.41 | |
| 21–30 km/week (n=132)* |
2.46 | 1.29 | 4.68 | |
| Over 30 km/week (n=112)* |
2.16 | 1.10 | 4.23 | |
| Age group | 17–32 (reference, n=280) |
|||
| 33–51 (n=356)* |
0.59 | 0.42 | 0.82 | |
| 52–66 (n=276)* |
0.51 | 0.36 | 0.73 | |
| 67–93 (n=303)* |
0.38 | 0.26 | 0.55 | |
| Gender | Male (reference, n=599) |
|||
| Female (n=616) |
1.05 | 0.81 | 1.36 | |
| Use of winter footwear | No use of winter shoes (reference, n=128) |
|||
| Use of winter shoes (n=657) |
1.12 | 0.73 | 1.71 | |
| Use of studded shoes (n=295) |
0.99 | 0.60 | 1.62 | |
| Use of anti-slip devices (n=135) |
1.11 | 0.62 | 1.97 | |
4.2. Personal preparation and factors contributing to slip-and-falls
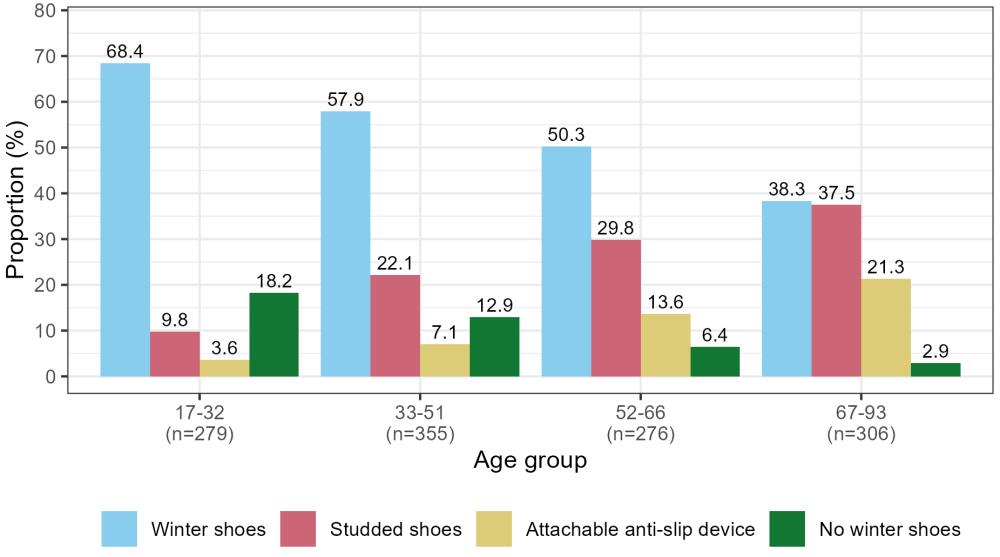
Of respondents, 24.9% reported preparing for slippery walking conditions by wearing studded shoes, and 12.4% reported using winter shoes with anti-slip devices. 45.4% reported using ordinary winter shoes without attachable devices, and 10.1% reported not using any winter shoes. The use of ordinary winter shoes was common in all age groups, but the use of studded shoes or anti-slip devices was most common in older age groups (F(17.5, 21295.9) = 11.3, p<0.001, Figure 5).
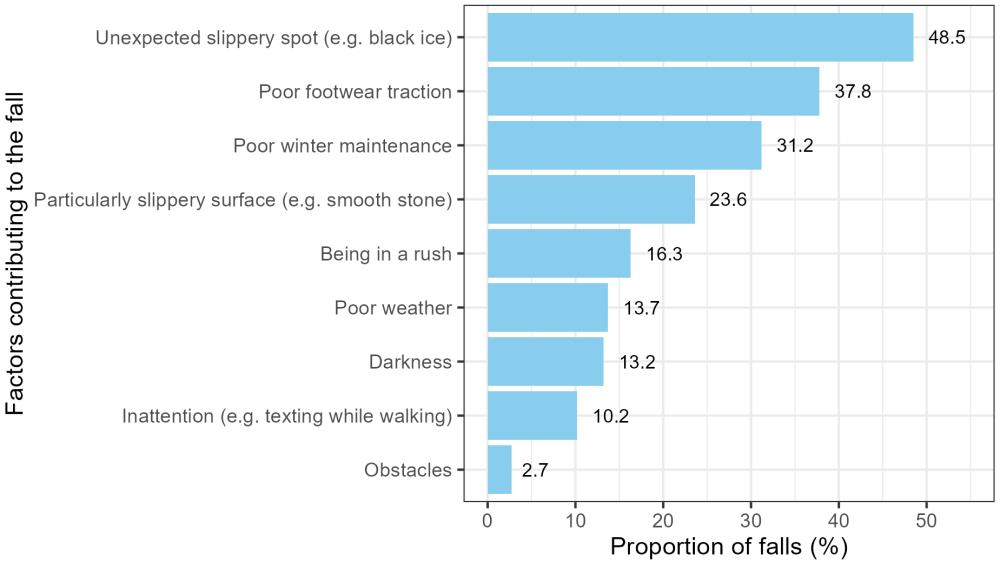
In general, the most common factors contributing to falls were an unexpected slippery spot such as black ice (48.5%), poor traction of footwear (37.8%) and poor winter maintenance (31.2%) (Figure 6). Selecting multiple contributing factors was possible.
Since the use of footwear differed significantly by age group, association with poor footwear traction and age group was tested. Poor footwear traction was reported significantly more often by younger age groups (F(3.0, 1269.2) = 3.0, p=0.03). Of 17–32 and 33–51-year-olds who had fallen, 45.8% and 39.8% reported the factor, while the corresponding figures for 52–66 and 67–93-year-olds were 33.4% and 26.1%.
4.3. Prevention of slip-and-fall accidents
Respondents were asked to rate a set of measures by importance for the prevention of slip-and-fall accidents on a five-point Likert scale ranging from not important at all (1) to very important (5). It was also possible to answer “Not sure”, but these responses were removed before calculating averages. On average, all measures were considered important (above 3.0 on average) (Figure 7). The most highly rated measure was improved winter maintenance on pedestrian infrastructure. Of the five most important measures, three were related to the behaviour of pedestrians themselves and two were related to improved winter maintenance. Informational campaigns for pedestrians and pedestrian weather warning systems were considered least important.
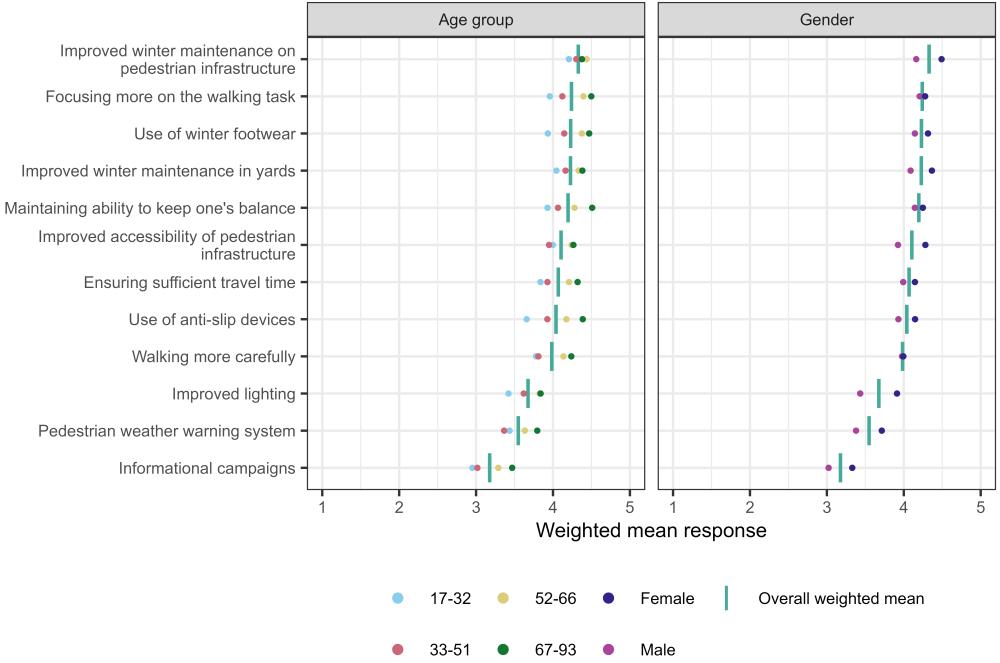
A factorial ANOVA was computed for each statement to assess for differences in ratings across age and gender (See tables in Appendix 2 for detailed results). The number of responses varied by item between 1,133–1,187 due to the exclusion of “not sure” answers. According to the results, age group had a significant effect on all factors and gender had a significant effect on all but “focusing more on the walking task”, “maintaining ability to keep one’s balance” and “walking more carefully”. The results suggest that women and older respondents generally considered most factors to be more important than men and younger respondents.
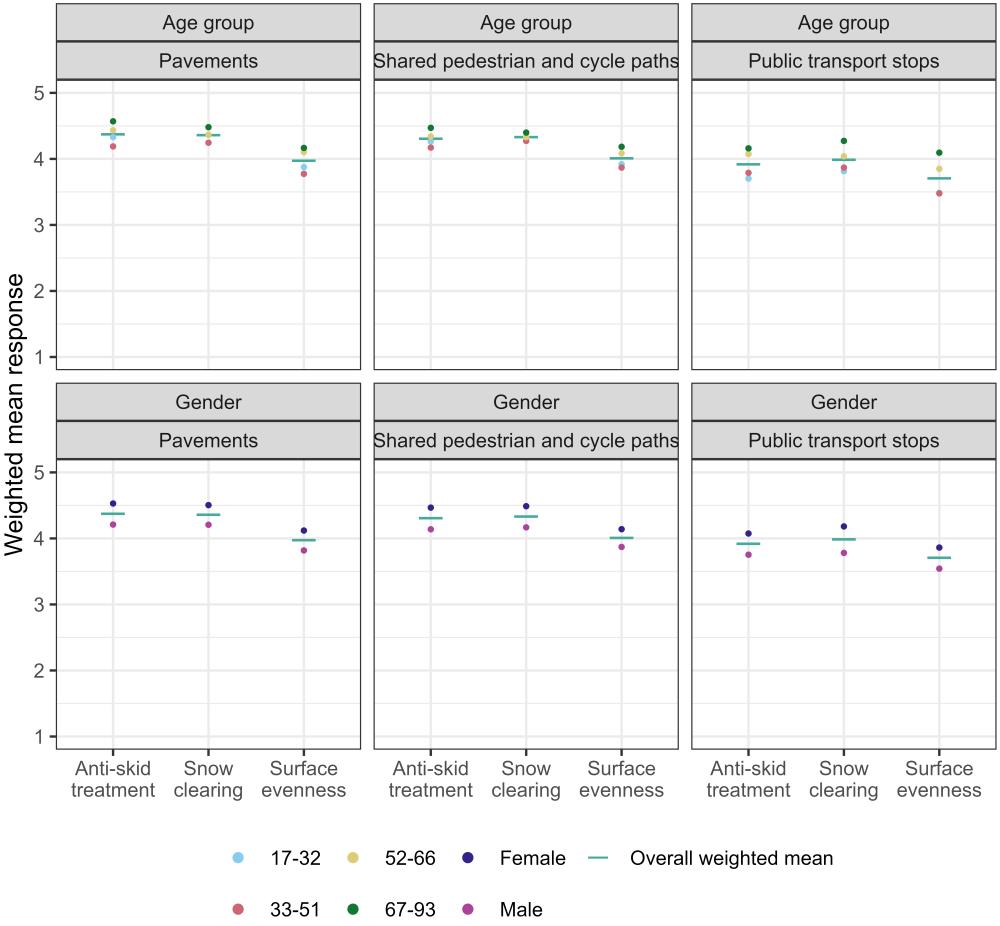
Respondents also rated how important they considered different winter maintenance measures in different travel environments. The number of responses varied by item between 1,003–1,175 due to the exclusion of “Not sure” answers. All measures were considered important in all environments (means above 3.0), although surface evenness was considered slightly less important than anti-skid treatments and snow clearance. A factorial ANOVA was also computed for each winter maintenance measure in each environment to assess the effect of age group and gender (Figure 8, and Appendix 2). Both variables had statistically significant effects for all measures, except age group for snow clearing on shared pedestrian and cycle lanes.
5. Discussion
Increasing the role of walking is considered especially desirable from sustainability and public health perspectives given its environmentally benign nature and its potential to help reverse the trend of declining physical activity levels (Alessio et al., 2021; Watts et al., 2015). As part of the effort to increase walking, the safety of walking must be ensured. However, pedestrian falls are not typically included in traffic accident statistics or policy, even though they account for a large share of pedestrian injuries, especially in countries with cold and snowy winters like Finland (Berntman, 2015; Malin et al., 2022; Methorst et al., 2016, 2017; Vuoriainen et al., 2000). The exclusion of pedestrian falls from traffic accident statistics may lead to a biased image of pedestrian safety, although they could be considered pedestrian single accidents (Methorst et al., 2017). This survey study aimed to explore experiences of winter slip-and-fall accidents in Finland, estimate their frequency and investigate views regarding their prevention to inform efforts aiming to increase the role of walking.
According to the results, approximately one fourth of respondents had slipped and fallen once, and every tenth respondent had done so several times during the winter of 2020–2021. Therefore, just over one third of respondents had fallen due to slipping at least once. Previous survey studies conducted in Finland feature similar proportions of those who had slipped and fallen during the winter preceding the surveys of around 30–40% (Anttila, 2001; Finnish Road Safety Council, 2021; Penttinen et al., 1999; Pöysti, 2014; Rantala & Pöysti, 2015). If 30–40% of Finnish residents above the age of 17 (approximately 4.6 million; OSF, 2024) annually experience a fall due to slipping, this corresponds to approximately 1,4–1,8 million people. If we assume that the 10% of respondents in the present study who reported slipping several times represents the share of the population aged 17 or above slipping twice per year, and that 25% of the population experience one slip-and-fall each year, then approximately 2,070,000 slip-and-falls of any level of consequence occur annually [(4.6M * 0.25) + (4.6M * 0.1 * 2)]. As Finnish residents walk an average of one kilometre a day (Traficom, 2023), the risk of experiencing such a fall based on the above would be approximately 2,744 per million kilometres walked during one winter (November–March, 164 days) [2,070,000 / (4.6 million km * 164)]. If the 8.9% of falls requiring medical attention in the present study is considered a proxy for injury, the corresponding figures would be approximately 184,230 or 244 per million kilometres walked. These figures suggest that slip-and-falls occur very frequently in Finland. However, it is important to note that these figures are rough and likely to be overestimated, since experiencing a fall may increase willingness to answer a related survey and it is not possible to confirm whether all falls for which medical care was sought resulted in actual injury. Our estimate is also greater than previous Finnish estimates, which put the estimated number of slip-and-fall accidents between 20,000–100,000 per year (Malin et al., 2022; Penttinen et al., 1999). Additionally, Swedish estimates based on the STRADA database are much smaller at roughly 11,000 per year (Amin et al., 2024; Berntman, 2015). However, this may be related to several factors. First, Amin et al. (2024) and Berntman (2015) focused only on falls occurring in the road environment, while the present study also included falls occurring in yards, some of which are private spaces. Furthermore, STRADA features less complete coverage of mild injuries which may be more eagerly reported in survey studies. For example, injuries treated at health centres (vårdcentraler) and at private practitioners, as well as injuries treated at hospitals not participating in STRADA during the full study periods, were not included in Berntman (2015) and Amin et al. (2024). Elvik & Bjørnskau (2019) also estimated a large risk of injury as a result of slipping and falling during winter in Oslo, Norway.
We also analysed the relationship between weekly kilometres walked and having experienced a fall with logistic regression. Although greater weekly walking distances were associated with greater odds of falling compared to the lowest activity group, the non-linear pattern suggests that the risk per kilometre may be lower for higher-distance walkers. A similar non-linear relationship was observed by (Li et al., 2014). However, a lower per kilometre risk cannot be conclusively determined without more accurate fall counts and estimates of walking distances. In addition, we recommend future research to investigate the relationship between injury risk and kilometres walked with a similar regression analysis, which was not possible to reliably perform in this study due to the low number of falls requiring medical attention.
Approximately half of respondents in the youngest age group had experienced a slip-and-fall, whereas approximately one fourth of the oldest age group had done so. In general, older respondents had experienced fewer falls than younger respondents. A similar result concerning age was also found by Penttinen et al. (1999). Although the elderly reported the least falls, previous studies suggest they have a greater risk of injury due to falling relative to kilometres walked (Bärwolff & Gerike, 2024; Björnstig et al., 1997; Elvik & Bjørnskau, 2019; Gyllencreutz et al., 2015; Morency et al., 2012; Vuoriainen et al., 2000). This suggests that although young people fall most frequently in absolute figures, the elderly are more often injured as a result of falling. Furthermore, the oldest age group most frequently reported at least one consequence due to falling. The above is concerning given that the population of Finland is aging (OSF, Official Statistics of Finland (OSF), 2023), as the number of injuries requiring medical care and associated societal costs may increase due to the higher fall injury risk of the elderly and the increasing frequency of slippery conditions due to climate change (Hippi & Kangas, 2022). Despite previous literature suggesting that women fall more often than men, gender was not significantly associated with experiencing a fall in the results of the present study. However, female respondents reported a consequence due to falling significantly more frequently than men. In general, this could be associated with more severe consequences, as especially elderly women are associated with their relatively greater risk of osteoporosis (Ettinger et al., 1999).
Given that most reported falls did not result in having to seek medical attention (91%), the results suggest that most slip-and-falls do not result in injury. While these falls may not be of direct concern from a traffic safety perspective, they may affect willingness to walk and thus reduce physical activity within the population and potentially increase the use of less sustainable modes such as private cars. Indeed, approximately 10% of respondents who had fallen reported no longer preferring to walk during slippery conditions as a consequence of falling, and older respondents reported the consequence significantly more often than younger respondents. Zijlstra et al. (2007) also reported that for older adults, experiencing a fall increases fear of falling, which in turn reduces mobility. Therefore, safe walking conditions during winter should be maintained to encourage walking from an environmental and public health perspective. Walking can provide beneficial levels of physical activity for older adults (Visser et al., 2002), most of whom do not meet physical activity recommendations in Finland (Husu et al., 2018). No research concerning fear of falling focusing on younger populations exists, but a similar effect could apply to them. Further research on fear of falling among younger age groups is recommended.
Walking conditions during falls reported in the present study were most frequently icy or snowy, and the most frequently reported contributing factor was an unexpected slippery spot. The finding complements results from a study on winter pedestrian falls in Norway, which found that pavement surface conditions are usually not homogenous, and that all recorded falls occurred when stepping on a spot that was particularly slippery compared to the surrounding surface (Fossum, 2022). Other frequently reported contributing factors included poor footwear traction and poor winter maintenance. Similar survey results were obtained by Penttinen et al. (1999), where icy and snowy surface conditions were reported to have contributed to most falls. The importance of good winter maintenance for walking was also recorded in previous Nordic surveys (Krogstad et al., 2015; Wennberg et al., 2009). Furthermore, approximately 60% of falls analysed by Berntman (2015) were also associated with a snowy or icy surface.
The most frequently reported environments where falls occurred were yards (26.6%) and pavements (23.1%), which are both areas where winter maintenance is typically used to improve walking surface conditions. By default, the responsibility for the winter maintenance of pavements in Finland falls on property owners unless the municipality has assumed it. For yards and courtyards, the responsibility always belongs to property owners (Hippi et al., 2017), who often outsource execution to a maintenance operator (Hautala & Leviäkangas, 2007). This system has resulted in ambiguities regarding responsibilities as well as a varying level of quality or lack of implementation due to the number of operators (Hippi et al., 2017; Malin et al., 2022). Confusion could potentially be reduced if municipalities more broadly assumed maintenance responsibilities. As the costs of falls appear to often outweigh the costs of maintenance (Mattsson, 2017; Myllylä et al., 2006), additional funding to carry this out may be justifiable. Additionally, there are no guarantees regarding the quality of winter maintenance on yards in single-family homes where the owner is responsible for maintaining a walkable surface. As such, homeowners should be supplied with guidance on how to maintain safe walking conditions for yards. Yards and pavements were also the most common slip-and-fall environments in Penttinen et al. (1999) and Rantala and Pöysti (2015).
Most respondents reported typically wearing winter shoes, studded shoes or using anti-slip devices during slippery walking conditions. However, the results differed by age group, with the youngest respondents least frequently reporting the use of winter shoes, studded shoes or anti-slip devices. The group also reported poor traction of footwear as a factor contributing to falling more often than any other age group. Given this and the statistically significant result that young people reported the most falls, promoting better footwear could help to prevent falls among young people and potentially increase their willingness to walk and physical activity levels. The oldest age groups reported using winter footwear most frequently, which is desirable given their fragility. Studded shoes and anti-slip devices have been studied to effectively prevent slip-and-fall accidents (Berggård & Johansson, 2010; Bonander & Holmberg, 2019; Holmberg et al., 2022; McKiernan, 2005), and were associated with walking more in Berggård and Johansson (2010).
In general, all measures rated by respondents to prevent slip-and-fall accidents were considered important. Winter maintenance was considered important in all environments, with surface evenness considered slightly less important than anti-skid treatments and snow clearing. Good winter maintenance was also found to be important for walking in Krogstad et al. (2015). In addition to winter maintenance, personal preparation such as use of appropriate footwear, was considered highly important. Even though considerable resources are spent in Finland on informational campaigns related to slipping and falling as well as pedestrian weather warning systems (Hautala & Leviäkangas, 2007; Hippi et al., 2020), they were considered least important by respondents, and were generally regarded neutrally. This suggests that increased resources for winter maintenance, as well as a programme to provide anti-slip devices to the elderly, similar to the scheme in Gothenburg, Sweden evaluated in Bonander & Holmberg (2019), could be appropriate in Finland as well and be received more positively by the public.
Women and older respondents systematically considered measures to prevent slip-and-falls more important than men and younger respondents. The finding suggests that the measures could more significantly influence the willingness to walk of women and the elderly compared to young people and men. Similarly, women and older respondents considered winter maintenance to be more important than men and younger respondents. The findings are consistent with previous literature, where men and young people are more likely to accept risky driving behaviour than women and the elderly (e.g., Cordellieri et al., 2016; Mizenko et al., 2015). However, despite statistical significance, differences in views were small in magnitude and similar in their overall direction. For example, there were no measures where the elderly strongly disagreed with younger respondents. Therefore, although these issues may be more important for women and the elderly, they remain important in general for all analysed groups.
5.1. Limitations of the study
This study was subject to some limitations. The survey sample obtained from the market research company’s survey panel was not entirely representative of the population, with differences in age and gender distributions. This was expected, since survey panels consist of participants who have agreed to be contacted to fill in surveys and may result in nonprobability samples which do not accurately represent the target population (Callegaro et al., 2014). These differences were addressed by calculating sampling weights to account for differences. In addition, those who have experienced a slip-and-fall may be more interested in answering a related survey, which could potentially lead to an overestimation of the proportion of those who had experienced a fall in the present study.
6. Conclusion
According to the results of the present study, slip-and-falls occur often, with over one third of respondents having fallen due to slipping at least once during the winter of 2020–2021. The finding is in line with figures from previous surveys and suggests that walking during winter in Finland is relatively dangerous. Most reported falls occurred on yards and pavements. Younger respondents reported more falls than older respondents but were more likely to experience no consequence as a result. Unexpected slippery spots on the walking surface and poor footwear traction were frequently reported contributory factors. All investigated measures to prevent slip-and-falls were considered important, but winter maintenance, focusing more on the walking task, and the use of appropriate footwear were considered most important. The aging population of Finland and growing prevalence of slippery walking conditions due to climate change presents an increasingly significant challenge for pedestrian safety during winter.
Given the prevalence of slip-and-falls, their omission from traffic accident statistics arguably results in a misleading image of pedestrian safety. Therefore, considering pedestrian falls as pedestrian single accidents and including them in traffic safety policy is recommended. Efforts to promote active travel should consider the role of pedestrian falls, especially in countries with snowy and icy winters. Based on respondent views, a combination of public and personal measures, such as increased winter maintenance resources and wearing anti-slip devices could be the most effective way to prevent slip-and-fall accidents.
Acknowledgements
This research is derived from survey material originally published in a Finnish report titled Pedestrian slip-and-fall accidents and their prevention: an equality perspective (original Finnish title: Liukastumistapaturmat ja niiden ehkäisy toiminnallisen tasa-arvon ja yhdenvertaisuuden näkökulmasta) funded by the Finnish Ministry of Transport and Communications, The Finnish Transport and Communications Agency, the Finnish Transport Infrastructure Agency and the Finnish Meteorological Institute.
Declaration of competing interests
The authors do not have any conflict of interest with other entities or researchers.
Ethics statement
Based on Finnish law and the guidelines provided by the Finnish National Board on Research Integrity TENK, an ethical review for the research was not required because the research adhered to the principle of informed consent, did not intervene in the physical integrity of research participants, did not expose participants to exceptionally strong stimuli, did not involve a risk of causing mental harm that exceeds the limits of normal daily life, survey respondents were not minors under the age of 15, and conducting the research could not involve a threat to the safety of participants or others. (Finnish National Board on Research Integrity TENK, 2019). In case any of these had not been the case, a separate ethical review from a human sciences ethics committee would have been necessary prior to data collection. Data gathered from respondents was stored on a network drive, in a folder to which only the authors had access.
Funding
This study received financial support from the Finnish Ministry of Transport and Communications, The Finnish Transport and Communications Agency, the Finnish Transport Infrastructure Agency and the Finnish Meteorological Institute.
CRediT contribution
Johannes Mesimäki: Formal analysis, Methodology, Visualization, Writing—original draft. Fanny Malin: Conceptualization, Funding acquisition, Methodology, Project administration, Supervision, Writing—review & editing. Merja Penttinen: Conceptualization, Funding acquisition, Methodology, Project administration, Supervision, Writing—review & editing.
Declaration of generative AI use in writing
The authors declare that no generative AI was used in this work.
Editorial information
Handling editor: Aliaksei Laureshyn, Lund University, Sweden.
Reviewers: Khabat Amin, Swedish Transport Agency, Sweden; Paul Schepers, Ministry of Infrastructure and Water Management, the Netherlands; Anna Carlsson, Chalmers Industriteknik, Sweden.
Submitted: 20 December 2024; Accepted: 4 April 2025; Published: 5 May 2025.
Appendices
Appendix A: ANOVA results
The F-statistics and p-values for the ANOVAs are presented in tables A1 and A2 below. The F-statistic describes how much the group means differ relative to what would be expected by random chance alone. A larger F-statistic suggests greater difference between group means.
| Measure | Age group | Gender |
| Improved winter maintenance on pedestrian infrastructure | F1,1179=3.6 p=0.005* |
F1,1179=46.0 p<0.001* |
| Focusing more on the walking task | F1,1177=19.1 p<0.001* |
F1,1177=0.8 p=0.368 |
| Use of winter footwear | F1,1178=22.3 p<0.001* |
F1,1178=8.9 p=0.001* |
| Improved winter maintenance in yards | F1,1174=8.0 p<0.001* |
F1,1174=25.0 p<0.001* |
| Maintaining balance ability | F1,1171=26.5 p<0.001* |
F1,1171=2.3 p=0.133 |
| Improved accessibility of pedestrian infrastructure | F1,1168=8.3 p<0.001* |
F1,1168=39.4 p<0.001* |
| Ensuring sufficient travel time | F1,1182=18.8 p<0.001* |
F1,1182=6.1 p=0.014* |
| Use of anti-slip devices | F1,1168=34.3 p<0.001* |
F1,1168=12.2 p<0.001* |
| Walking more carefully | F1,1172=18.1 p<0.001* |
F1,1172=0.0 p=0.939 |
| Improved lighting | F1,1177=8.8 p<0.001* |
F1,1177=60.2 p<0.001* |
| Pedestrian weather warning system | F1,1158=8.4 p<0.001* |
F1,1158=22.5 p<0.001* |
| Informational campaigns | F1,1128=13.4 p<0.001* |
F1,1128=19.5 p<0.001* |
| Measure | Age group | Gender | |
| Anti-skid treatment | Pavement | F3,1170=8.3 p<0.001* |
F1,1170=30.6 p<0.001* |
| Shared pedestrian and cycle lane | F3,1155=5.0 p=0.002* |
F1,1155=32.1 p<0.001* |
|
| Public transport stop | F3,1005=8.1 p<0.001* |
F1,1005=14.9 p<0.001* |
|
| Snow clearing | Pavement | F3, 1168=3.3 p=0.020* |
F1, 1168=31.9 p<0.001* |
| Shared pedestrian and cycle lane | F3,1160=0.7 p=0.530 |
F1,1160=33.9 p<0.001* |
|
| Public transport stop | F3, 1002=8.0 p<0.001* |
F1, 1002=26.7 p<0.001* |
|
| Surface evenness | Pavement | F3, 1161=9.8 p<0.001* |
F1, 1161=25.2 p<0.001* |
| Shared pedestrian and cycle lane | F3, 1152=6.2 p<0.001* |
F1, 1152=20.5 p<0.001* |
|
| Public transport stop | F3, 998=16.9 p<0.001* |
F1, 998=15.5 p<0.001* |
|
Appendix B: Survey (translated from Finnish)
Introduction
The aim of this survey is to collect information about pedestrian falls and slip-and-fall accidents in winter conditions. Additionally, information is gathered on prevention methods for slip-and-fall accidents.
The research is conducted by the VTT Technical Research Centre of Finland. The responses of individual respondents will not be shared with other parties, and the results will not identify individual respondents. The survey takes approximately 10 minutes to complete.
Slip-and-fall accidents
How many times have you slipped and fallen while walking outside during this past winter?
-
Once
-
Multiple times
-
Not at all
Think about the most serious slip you experienced this winter. (section asked if respondent had experienced a slip-and-fall)
Where did the slip occur?
-
Pavement
-
Shared pedestrian and cyclist path
-
Hard shoulder on highway
-
Kerbstone
-
Roadway
-
Pedestrian crossing
-
Yard
-
Parking lot
-
Public transport stop
-
Outdoor path
-
Elsewhere, where?
What was the purpose of the trip when the slip occurred?
-
Work or study trip: walking only
-
Work or study trip: part of a multimodal travel chain
-
Errand trip: entirely walking only
-
Errand trip: part of a multimodal travel chain
-
Other leisure trip: entirely walking only
-
Other leisure trip: part of a multimodal travel chain
-
Walking for exercise
-
Other, what?
In which month did the slip-and-fall occur?
-
October
-
November
-
December
-
January
-
February
-
March
-
I don’t know, I don’t remember
-
Exact time (if you remember)
Weather conditions
What was the surface condition (you may select multiple options)?
-
Dry
-
Wet
-
Icy (smooth ice, rough uneven ice surface)
-
Light snow on ice
-
Wet ice
-
Snowy
-
Hard-packed snow (from heavy walking, plowing)
-
Slushy
-
I don’t know, I don’t remember
-
Other, what?
Was the weather freezing?
-
Freezing (below 0 degrees)
-
Around 0 degrees
-
Thawing (above 0 degrees)
-
I don’t know / I don’t remember
Had the weather just changed?
-
Yes
-
No
-
I don’t know / I don’t remember
Did the slippery weather come as a surprise?
-
Yes
-
No
-
I don’t know / I don’t remember
What factors contributed to the slip-and-fall? Please select all contributing factors.
-
Particularly slippery surface (e.g., smooth stone surface or slippery road markings at pedestrian crossings)
-
Unexpected single slippery spot (e.g., frozen puddle, black ice)
-
Bad weather
-
Poor winter maintenance
-
Obstacles on the path (e.g., roadworks, surface damage, cars parked on the path)
-
Poor grip on shoes
-
Darkness, poor lighting
-
Hurry
-
Inattention, for example focusing on a mobile phone
-
I don’t know
-
Other, what?
What were the consequences of the slip-and-fall? (choose all relevant consequences)
-
I had to be absent from work or school for one day
-
I had to be absent from work or school for multiple days
-
I had to seek medical care
-
I had to stay in the hospital for at least one night
-
I walk more cautiously on slippery surfaces now
-
I started using anti-slip devices and/or studded shoes
-
I started using walking poles and/or a walker
-
I got better winter shoes
-
I follow weather forecasts and pedestrian weather more closely
-
I no longer like to go out on slippery surfaces
-
No consequences
-
Other, what?
How did you seek medical care? (asked if medical care was sought)
-
By ambulance through the emergency center
-
Went to the health center emergency room
-
Went to the hospital emergency room
-
Through occupational health care
-
Other, how?
| (1) Very satisfied |
(2) | (3) | (4) | (5) Very dissatisfied |
Not sure | |
| Determining the right place for treatment | ||||||
| Ease of getting to the treatment place | ||||||
| Speed of getting treatment once you arrived at the treatment place (e.g., waiting time) | ||||||
| Success of the treatment evaluated afterwards (self-assessment) |
Could the healthcare you received for your slip-and-fall accident have been improved in your opinion? If yes, how?
Pedestrian Weather Services
Introduction: Various services provide specific information to pedestrians about the slipperiness of sidewalks and paths.
Have you yourself obtained or received a warning about slippery walking conditions?
-
Yes
-
No, but I know about the existence of the services
-
I didn’t know about the existence of the services
Where have you received information about current or forecasted slippery walking conditions? (following questions asked if had used services)
-
From the Finnish Meteorological Institute’s website
-
From another website
-
From the Finnish Meteorological Institute’s mobile weather app
-
From another mobile weather app
-
From the radio
-
From the television
-
From teletext or teletext app
-
As a text message service ordered to the phone
-
From social media (e.g., Facebook or Twitter)
-
Elsewhere, where?
Did receiving the warning about slippery walking conditions affect any of the following factors? Choose all relevant factors.
-
Choice of footwear
-
Use of anti-slip devices
-
Use of walking poles or other walking aids
-
Cancellation of a trip
-
Choice of mode of transport (walking/bus/car/taxi)
-
Choice of destination (e.g., only to the local store)
-
Choice of walking route (e.g., avoiding steep hills)
-
Time allocated for the trip
-
Time of departure
-
Taking a companion along
-
Walked particularly cautiously
-
Other, what?
-
The information did not affect my behaviour
| (1) Very useful | (2) | (3) | (4) | (5) Completely useless | Not sure | |
| For myself | ||||||
| In general |
What benefits do you think warnings about particularly slippery walking conditions? Choose all benefits. (asked from all)
-
Information specifically about the slipperiness of pedestrian paths
-
Local (e.g., city-specific) information about the slipperiness of pedestrian paths
-
Influence on the choice of safer footwear
-
Influence on the use of anti-slip devices
-
Influence on the use of walking poles or other walking aids
-
More careful consideration of the decision to go out
-
Influence on the choice of mode of transport (walking/bus/car/taxi)
-
Influence on the choice of destination (e.g., only to the local store)
-
Influence on the choice of walking route (e.g., avoiding steep hills)
-
More time allocated for the trip
-
Attention to the time of departure
-
Taking a companion along
-
Walking particularly cautiously
-
Other, what?
Where would you like to find warnings given to pedestrians about slippery walking conditions?
| (1) Yes | (2) Possibly | (3) No | (4) Not sure | |
| From websites | ||||
| From mobile weather apps | ||||
| From the radio | ||||
| From the television | ||||
| From teletext or teletext app | ||||
| As a text message service ordered to the phone | ||||
| From social media (e.g., Facebook or Twitter) | ||||
| Elsewhere, where? | ||||
Winter Maintenance
| (1) Very satisfied |
(2) | (3) | (4) | (5) Very dissatisfied |
Not sure / no experience | ||
| Anti-skid treatment | …on pavements | ||||||
| …on shared pedestrian and cycle paths | |||||||
| … at public transport stops | |||||||
| Snow clearing… | …on pavements | ||||||
| …on shared pedestrian and cycle paths | |||||||
| … at public transport stops | |||||||
| Surface evenness | …on pavements | ||||||
| …on shared pedestrian and cycle paths | |||||||
| … at public transport stops |
| (1) Very important |
(2) | (3) | (4) | (5) Not important at all |
Not sure / no experience | ||
| Anti-skid treatment | …on pavements | ||||||
| …on shared pedestrian and cycle paths | |||||||
| … at public transport stops | |||||||
| Snow clearing… | …on pavements | ||||||
| …on shared pedestrian and cycle paths | |||||||
| … at public transport stops | |||||||
| Surface evenness | …on pavements | ||||||
| …on shared pedestrian and cycle paths | |||||||
| … at public transport stops |
Did any of the following cause difficulties in walking on your usual walking routes? Choose all relevant deficiencies.
-
Winter maintenance started too late
-
Winter maintenance started too early
-
Anti-skid treatment quality varies along the route
-
Insufficient quality of anti-skid treatment throughout the route
-
Varying quality of snow clearance along the route
-
Insufficient quality of snow clearance throughout the route
-
Other, what?
Can you think of anything else related to winter maintenance that could make walking easier or more pleasant for you?
| (1) Very important | (2) | (3) | (4) | (5) Not important at all | Not sure | |
| Improving maintenance in yard areas | ||||||
| Improving maintenance on pedestrian routes | ||||||
| Improving the ease of movement and accessibility of pedestrian routes | ||||||
| Improving street and yard lighting | ||||||
| Proactive and timely, area-specific warning of slippery weather for pedestrians | ||||||
| General information campaigns aimed at pedestrians | ||||||
| Pedestrians would use better and more grippy footwear | ||||||
| Pedestrians would use anti-slip devices on their footwear | ||||||
| Pedestrians would walk more cautiously | ||||||
| Pedestrians would focus on walking (and not, for example, use their phone at the same time) | ||||||
| Pedestrians would maintain their balance and alertness | ||||||
| Pedestrians would allocate enough time for the trip and leave early | ||||||
| Other, how? | ||||||
Transport Planning
Introduction: The national goal is to increase the number of walking trips. Next, we would like to hear your general experiences of considering pedestrians in traffic planning.
Do any of the following factors affect your decision to make trips by walking? Choose all relevant factors.
-
Lack of sidewalk or light traffic path
-
Lack of safe crossing place
-
Too narrow sidewalks or light traffic paths
-
Lack of benches or other seating places
-
Obstacles on pedestrian routes (e.g., parked vehicles, tools, advertising signs)
-
Tripping hazards on pedestrian routes
-
Curbs not lowered at intersections
-
Too short time to cross the street during the green traffic light
-
Deficiencies in winter maintenance/slipperiness of pedestrian route
-
Signage and routes around construction sites
-
Poor lighting
-
Lack of suitable route
-
Too long distance
-
Bad weather
-
Lack of time
-
Lack of stamina
-
Physical mobility restrictions
-
Too high speed of motorists
-
Behavior of cyclists
-
Behavior of electric scooter riders
-
Other, what?
| (1) Very important | (2) | (3) | (4) | (5) Not important at all |
Not sure | |
| Separate routes for pedestrians and cyclists | ||||||
| More spacious sidewalks or light traffic paths | ||||||
| Construction of a separation strip between the sidewalk and the roadway | ||||||
| Reducing driving speeds | ||||||
| More safe ways to cross busy streets | ||||||
| Longer time at traffic lights to cross the roadway | ||||||
| Shorter waiting time at traffic lights | ||||||
| Easier and/or shorter walking distance to services | ||||||
| More areas intended for walking | ||||||
| More pedestrian routes | ||||||
| More easy-to-walk and accessible routes | ||||||
| More direct routes | ||||||
| More places for resting and stopping (e.g., benches) | ||||||
| More stimuli along the routes (e.g., street art) | ||||||
| Cleaner and more pleasant environment | ||||||
| Plantings along pedestrian routes (e.g., parks, street trees, bushes, flower plantings) | ||||||
| Cleaner air | ||||||
| Better winter maintenance of pedestrian routes | ||||||
| Better lighting | ||||||
| Better route signage | ||||||
| Better signage around construction sites | ||||||
| Mobile app or challenge encouraging walking | ||||||
| Other, what? | ||||||
Background Information
In what year were you born?
Gender
-
Female
-
Male
-
Other
-
I don’t want to say
Household income level
Postal code
What type of environment do you live in?
-
Apartment in the city centre
-
Apartment outside the city centre (e.g., suburb)
-
Row or semi-detached house
-
Detached house
Do you have any mobility restrictions (e.g., disability or illness) that affect your ability to make everyday trips?
-
Yes
-
No
| Winter season (November-March) | Summer season (April-October) | |
| less than 1 km/week | ||
| 1–5 km/week | ||
| 6–10 km/week | ||
| 11–20 km/week | ||
| 21–30 km/week | ||
| more than 30 km/week |
| Winter season (November-March) | Summer season (April-October) | |||||||||
| Daily or almost daily | Weekly | Monthly | Rarely | Not at all | Daily or almost daily | Weekly | Monthly | Rarely | Not at all | |
| Car (as a driver) | ||||||||||
| Car (as a passenger) | ||||||||||
| Public transport | ||||||||||
| Cycling | ||||||||||
| Walking | ||||||||||
| How far are the following places from your home? | Which mode of transport do you typically use to reach the following places? | |||||||||||
| Less than 1 km | 1–5 km | 6–10 km | 11–16 km | Over 16 km | I do not typically visit this place | I do not know | Car | Public transport | Bicycle | Walking | Other | |
| My workplace or study place | ||||||||||||
| The grocery store I use most often | ||||||||||||
| Other errand place (e.g., post office and pharmacy services) | ||||||||||||
| Place where I exercise most often | ||||||||||||
| Other place I visit often. What? | ||||||||||||
What type of footwear or accessories do you mainly use in winter on slippery surfaces?
-
anti-slip devices for heels
-
Full sole anti-slip devices
-
Anti-slip devices for the ball of the foot
-
Studded shoes
-
Friction/grip sole shoes
-
Winter shoes (without special accessories)
-
I don’t use special winter shoes
Has the COVID-19 pandemic had the following effects on your walking habits? Choose all changes that apply to you.
-
Yes, I walk more often
-
Yes, I walk less often
-
Yes, I walk longer distances
-
Yes, I walk shorter distances
-
Yes, I walk more during daylight hours
-
Yes, I walk less during daylight hours
-
No
-
I don’t know
-
Other, what?
Is there anything else you would like to add?