A Hybrid Structural Equation Modeling and Fuzzy-set Qualitative Comparative Analysis Framework for Using Limited Samples to Relate Cycling Performance to Behavioral Traits
Abstract
The objective of this investigation was to explore a hybrid application of Structural Equation Modelling (SEM) and Fuzzy-set Qualitative Comparative Analysis (FsQCA) to assess the impact of safety-related behavioural traits on the performance of bicyclists using a limited sample of data as a case study. These behavioural characteristics of cyclists are fundamental when specific cyclist groups are targeted for safety countermeasures. The data were collected from individuals who completed a survey and participated in bicycle simulator experiments. Each of the items in the survey aimed to describe how keen the rider is to take risks. The motivation for the study is the recognition that traditional statistical methods have limitations related to the model structure and the type of variables they can analyze, especially where sample sizes are limited. To address these limitations and to estimate complex relationships between variables, SEM can be used to assess the individual effect of each variable on the response variable(s). In the real-world context, however, a combination of variables can affect response variables. To address this issue, this study used the hybrid SEM-FsQCA approach, in which SEM was applied as the first step in analyzing the latent behavioural variables. Then, using the outputs of the previous step, FsQCA was applied to assess the effect of combinations of variables on the performance of cyclists. Based on SEM, none of the factors significantly affected performance, likely due to the low sample size. However, when applying FsQCA, it was observed that combinations of factors significantly affect performance. This hybrid approach was seen to be promising for the case study application and, in that context, to have the potential, even with smaller samples, to significantly contribute to a deep understanding of the safety-related behavioral traits, which can be used in designing targeted countermeasures to improve their safety.
1. Introduction
Cycling has been recognized as a practical and viable mode of transportation for daily activities such as commuting to work, school, or shopping, driven by growing investments in integrating cycling into multimodal urban mobility systems (Warner et al., 2017). However, the lack of bicycle infrastructure, taken together with unsafe intersections, results in a worrying number of injuries to cyclists, even though cyclists do not generally travel at high speeds compared to cars (Reynolds et al., 2009). The 2,035 cyclist fatalities recorded in Europe in 2019 provide vivid evidence of this problem, as do the 938 fatalities and 38,886 serious injuries to cyclists in 2020 in the U.S., the highest numbers since 2011 (National Highway Traffic Safety Administration, 2022). Therefore, it is crucial not only to identify factors influencing cyclist safety and those impacting the behaviour of cyclists but also to continuously advance and improve the analytical methods used for such assessments, given that sample sizes for such investigations are typically small. This recognition provides the motivation for this case study investigation aimed at advancing the methodology for identifying behavioural and other factors influencing traffic safety, with a focus on cyclists.
Various statistical techniques have been utilized to investigate the impact of multiple factors on the safety of cyclists and their related behaviour; these include regression models (Christoforou et al., 2023; Liu et al., 2020; Schepers et al., 2023), Structural Equation Models (SEM) (Al-Mahameed et al., 2019; Useche et al., 2018), machine learning (Lu et al., 2022; Sanjurjo-de-No et al., 2023) and deep learning algorithms (Yaqoob et al., 2023a, 2023b). It is important to note that traditional statistical methodologies (e.g., multiple regressions, logistics regression, ANOVA, etc.) have three main limitations, namely: 1) they tend to postulate that the model structure is simple, 2) they typically assume that all variables can be measured directly (i.e., they are observable variables), and 3) they frequently assume that all independent variables are measured without error (Hair et al., 2022; Wang & Wang, 2012). To address these limitations, second-generation models, such as structural equation modelling (SEM), have been suggested. SEM provides researchers with a flexible and powerful tool to assess and estimate complex relationships between different types of variables (Hair et al., 2022). Some of the advantages of SEM include the ability to analyze models with multiple dependent variables simultaneously, to assess direct, indirect, and total effects of variables on response variables, and to handle different data types (e.g., data containing count, categorical, and non-normal outcomes with small to big sample sizes) (Wang & Wang, 2012).
Despite the advantages of SEM, it has some limitations. First, SEM is a mean-centred symmetric approach that estimates the average effect of independent latent variables on the dependent ones. However, data may be skewed, and the mean may not be an accurate representation of all data points. Second, while it generally captures linear relationships, these relationships can be complex and nonlinear in reality. Third, SEM cannot estimate the impact of variable combinations on the dependent variable (Hasan et al., 2022; Rasoolimanesh et al., 2021). To address these concerns, a combination of SEM and an asymmetric approach, such as Fuzzy-set Qualitative Comparative Analysis (FsQCA), has been recommended to supplement regression-based analysis for exploring how various combinations of independent variables generate specific levels of outcome(s) (Kraus et al., 2018; Rasoolimanesh et al., 2021).
Qualitative Comparative Analysis (QCA) is an asymmetric data analysis technique that enables researchers to perform data exploration and understand the similarities and differences among several variable combinations, referred to as configurations (Ragin, 2014). The main objective of QCA is to explore the causality in complex relationships between variables, which can be nonlinear and non-probabilistic. FsQCA is a subset of QCA that can identify different configurations that constitute sufficient and necessary conditions for the outcome of interest (Pappas & Woodside, 2021). According to Ragin (Ragin, 2009), due to the simultaneous use of qualitative and quantitative methods in this approach, FsQCA bridges the gap between quantitative and qualitative approaches. In contrast to more quantitative methods that rely on correlations, FsQCA builds logical connections between causal conditions and outcomes, resulting in rules that summarize the sufficiency between subsets of all possible combinations based on the causal conditions of the combinations (Mendel & Korjani, 2013). The FsQCA method can be appropriate when there are multiple causes of a research phenomenon and where these causes work together to generate the outcome (Woodside, 2011). As a result, FsQCA examines all combinations of the independent variables rather than estimating a net effect of each of those variables (Kraus et al., 2018).
Combining symmetric and asymmetric perspectives was proposed by Rasoolimanesh et al. (Rasoolimanesh et al., 2021) in the hospitality and tourism sectors through Partial Least Squares Structural Equation Modelling (PLS-SEM) and fuzzy set qualitative comparative analysis (FsQCA). There are other notable applications of this hybrid approach in different fields, including business and psychology (Chen et al., 2023; Hasan et al., 2022; Kang & Shao, 2023; Pappas & Woodside, 2021; Yang et al., 2022). However, this hybrid method has not, to the best of the authors’ knowledge, been implemented in traffic safety, although there are a few comparable studies for analyzing user behaviour in transportation systems. For example, Abbasi et al. (Abbasi et al., 2022) investigated the intentions of drivers to adopt eco-driving behaviours using asymmetrical analysis through fuzzy set qualitative comparative analysis. For comparison with the findings from FsQCA, symmetrical analysis was also conducted using PLS-SEM. In another study, to understand how various antecedent factors affect connected and autonomous vehicles (CAVs) acceptance, Li et al. (Li et al., 2022) developed an integrated model. To analyze data from 362 drivers, symmetric (Structural Equation Modelling) and asymmetric (Qualitative Comparative Analysis) techniques were used. PLS-SEM was used to analyze each antecedent’s net effect on CAVs’ adoption, whereas FsQCA was applied to reveal the configurations of causal conditions that affect CAVs’ adoption.
In summary, the literature review suggests that SEM and FsQCA can be considered complementary techniques, offering a blend of symmetric and asymmetric approaches to uncover complex relationships among various variable combinations. However, the integration of SEM-FsQCA in traffic safety research is a novel concept that has garnered limited attention thus far. As such, the main objectives, and the central novelty of this study, are the exploration of this concept for a case study to assess the impact of different behavioural aspects on the performance of bicyclists and the demonstration of how a limited sample of data could be used for this purpose with this approach. The sample data were collected from individuals completing a survey and bicycle simulator experiments. In the process of addressing the main objectives, the research sought to address the following specific questions for the case study:
-
What is the individual effect of each safety-related behavioural trait on a cyclist’s performance?
-
How does a combination of safety-related behavioural traits affect a cyclist’s performance?
2. Methods
2.1. Partial Least Squares Structural Equation Modelling (PLS-SEM)
PLS-SEM is one of the two main approaches for applying structural equation modelling, and according to (Hair et al., 2022), it is particularly appropriate when latent variable scores are required for subsequent analyses, as is the case in this study. PLS-SEM was therefore applied in this study to examine the complex relationships between observed variables (questionnaire items) and latent variables or constructs (behavioural traits and cycling performance). Details on the questionnaire items and latent constructs are provided later in presenting the data in Section 3.
The PLS-SEM model was developed using the SmartPLS 4.1 software (Ringle et al., 2024). PLS-SEM is a method used to understand complex relationships among latent variables. It does this by combining two models: the measurement model, which links latent variables (or constructs) to their observed variables (i.e., indicators), and the structural model, which maps how the latent variables relate to each other. The process begins by estimating initial scores for the latent variables, usually with ordinary regression. It then refines these estimates by calculating how the observed data contribute to each latent variable and by analyzing the relationships between the latent variables. This iterative process ensures that the model maximizes the explained variance in the dependent constructs (Hair et al., 2022).
The next step after estimating the model parameters was to evaluate the PLS-SEM results. The first stage of evaluating the PLS-SEM model was to assess the measurement models. For this purpose, indicator reliability, internal consistency, convergent validity, and discriminant validity were evaluated for each factor following specifications recommended by Hair et al. (Hair et al., 2022). The indicator reliability criterion states that the factor loadings between the indicators and the construct should be at least 0.6. For internal consistency, Cronbach’s alpha is a traditional measure. However, Cronbach’s alpha assumes that the reliability of all indicators is equal and is sensitive to the number of indicators within each construct. Therefore, two measures – composite reliability and reliability coefficient were used instead. For internal consistency, values below 0.6 indicate a lack of consistency. Convergent validity measures the share of the variance of the indicators explained by the construct, denoted by Average Variance Extracted (AVE). AVE should be 0.5 or higher, meaning that at least 50% of the variance is explained by the latent variable. Discriminant validity measures how distinct the construct is from other constructs. There are two criteria to measure this validity – “Fornell-Larcker” and “Heterotrait-Monotrait ratio (HTMT)”. According to the “Fornell-Larcker” criterion, the square root of the Average Variance Extracted (AVE) should be greater than the correlation coefficient with other constructs in the model. HTMT is the ratio of the between-trait correlation to within-trait correlations. A value of HTMT higher than 0.9 shows a lack of discriminant validity.
After assessing all measurement models, the structural model was evaluated for its explanatory power using the coefficient of determination (R2), the traditional measure of model fit. Hair et al. (Hair et al., 2022) provide more detailed information on evaluating PLS-SEM results.
2.2. Fuzzy-set Qualitative Comparative Analysis (FsQCA)
After the PLS-SEM analysis, FsQCA was performed using the FsQCA software (Ragin & Davey, 2022). Latent variable scores, one of the outputs of the PLS-SEM analysis, were used as inputs to explore complicated relationships between latent variables. The raw data were transformed through calibration within the FsQCA procedure, using the software’s ‘Calibrate’ function to convert data points into fuzzy sets with values between 0 and 1. Following the approach of Pappas and Woodside (Pappas & Woodside, 2021), this study transformed latent scores into fuzzy sets using percentile thresholds at 0.95, 0.50, and 0.05 levels, providing additional insights into the complex relationships between dependent and independent variables. This approach avoids assigning absolute set membership (i.e., 0 or 1), which is rarely justifiable in behavioral data and may lead to overly rigid or unstable truth table solutions. After the calibration of variables, the next step was to determine the truth table in the FsQCA software (Kraus et al., 2018). Each row of a truth table displays all possible combinations of potential causal conditions, records the number of cases for each configuration, and indicates whether the outcome materialized.
Based on the configuration scores, two criteria were calculated for each configuration: consistency and coverage. Consistency for a condition refers to the degree to which conditions or combinations of conditions and the outcome are related. The coverage of a configuration is another criterion that is used to confirm its sufficiency and necessity (Rasoolimanesh et al., 2021). Coverage indicates the proportion of the outcome that is explained by a given condition or configuration (Ragin et al., 2008). In other words, the coverage value indicates how much an outcome depends on a specific configuration (Rasoolimanesh et al., 2021). The mathematical formulation for calculating consistency and coverage is shown in Equation (1) and Equation (2):
where is the fuzzy membership score for condition i, and Yi is the outcome membership score.
By calculating the consistency and coverage of causal conditions in FsQCA, it is possible to determine whether the causal conditions are sufficient or necessary for an outcome to occur. A configuration is considered sufficient to produce the desired result if its consistency exceeds 0.8 and its coverage is greater than 0.2. It is considered necessary for an outcome to happen if the consistency and coverage value of a configuration is close to 1 (Ragin, 2009; Ragin et al., 2008).
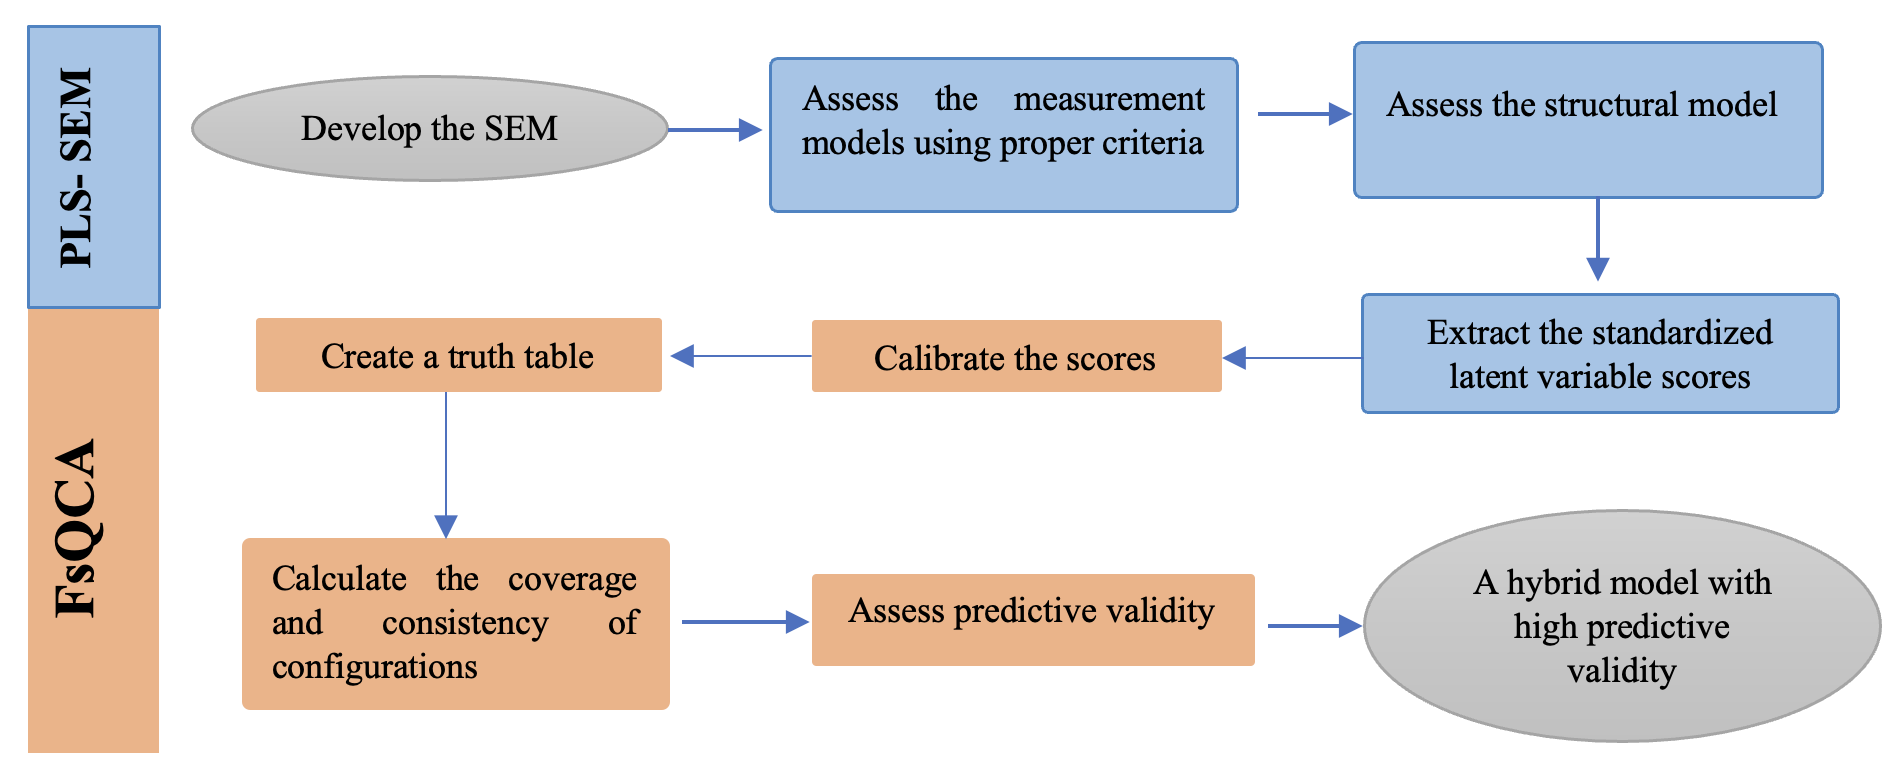
Given the reliance of PLS-SEM on regression methods, incorporating FsQCA also helps address the inherent limitations of regression analysis by providing a means to examine causal asymmetries, thus strengthening the overall analytical approach (Kang & Shao, 2023; Pappas & Woodside, 2021). For this study, this hybrid modelling framework was selected for two key reasons. First, the small sample size, which is typical of pilot studies involving simulator-based behavioral data, meant that it was not feasible to apply traditional statistical methods such as multivariate regression or covariance-based SEM. Second, the behavioral constructs under investigation were expected to influence the performance in complex, interactive, and potentially nonlinear ways. PLS-SEM was therefore applied to estimate latent behavioral factors and test their structural relationships, while FsQCA was used to uncover combinations of behavioral factors that are sufficient to explain performance outcomes. This dual perspective facilitated the exploration of both isolated and configurational effects in a way that aligns with the complexity of real-world cyclist behavior. PLS-SEM and FsQCA can, therefore, be regarded as complements that combine symmetric and asymmetric approaches and, in so doing, can grasp much more complex relationships between different combinations of variables. The steps for using the hybrid SEM-FsQCA method are shown in Figure 1, adapted from the studies conducted by Rasoolimanesh et al. (Rasoolimanesh et al., 2021), Pappas and Woodside (Pappas & Woodside, 2021), and Hair et al. (Hair et al., 2022).
3. Data Collection
The data used in this study were collected by Lund University, Sweden, using a bicycle simulator and a questionnaire. The bicycle simulator equipment had technical limitations that restricted the number of participants who could be tested, so the sample was confined to 20 subjects. This data collection was, in fact, a pilot study aimed at testing the potential of the bicycle simulator and the effectiveness of the hybrid analysis method for small samples. Given the strengths of SEM and FsQCA, the expectation was that a small sample would be sufficient to identify potential issues, refine the methodology, and guide the design of larger studies.
First, the subjects completed a questionnaire based on that designed by Taubman-Ben-Ari et al. (Taubman-Ben-Ari et al., 2004) to assess the aggressiveness of subjects when driving automobiles, assuming that such behaviour will be manifested in explanatory power for their performance when cycling. Besides, the use of a more reliable and validated questionnaire to understand attitudes and aggressiveness seemed appropriate given the study objectives and the limited research involving cycling performance in bike simulators. This questionnaire has been specifically used to identify potential risky behaviours, providing a framework for analyzing the safety performance of cyclists. The questionnaire captured various demographic characteristics and behavioural aspects of the 20 participants, including dissociative driving style, anxious driving style, risky driving style, angry driving style, high-velocity driving style, distressed-reduction driving style, patient driving style, confident driving style and cautious driving style. The constructs and the related questionnaire items are represented in Table 1. The same participants later completed a biking simulator experiment in which their safety performance was evaluated based on measures such as mean speed, the standard deviation of speed, the percentage of pedalling, the percentage of braking and the closest lateral distance to a vehicle.
| Constructs | Safety-Related Behavioral Traits | Code |
| Dissociative driving style | Misjudge the speed of an oncoming vehicle when passing | DS1 |
| Intend to switch on the windscreen wipers, but switch on the lights instead | DS2 | |
| Forget that my lights are on full beam until flashed by another motorist | DS3 | |
| Nearly hit something due to misjudging my gap in a parking lot | DS4 | |
| Plan my route badly, so that I hit traffic that I could have avoided | DS5 | |
| Try to drive away from traffic lights in third gear (or in neutral in automatic cars) | DS6 | |
| Lost in thoughts or distracted, I fail to notice someone at the pedestrian crossings | DS7 | |
| Daydream to pass the time while driving | DS8 | |
| Anxious driving style | Feel nervous while driving | AX1 |
| Feel distressed while driving | AX2 | |
| Driving makes me feel frustrated | AX3 | |
| It worries me when driving in bad weather | AX4 | |
| On a clear freeway, I usually drive at or a little below the speed limit | AX5 | |
| Feel I have control over driving | AX6 | |
| Feel comfortable while driving | AX7 | |
| Risky driving style | Enjoy the excitement of dangerous driving | R1 |
| Enjoy the sensation of driving on the limit | R2 | |
| Like to take risks while driving | R3 | |
| Like the thrill of flirting with death or disaster | R4 | |
| Fix my appearance while driving | R5 | |
| Angry driving style | Swear at other drivers | AG1 |
| Blow my horn or “flash” the car in front as a way of expressing frustrations | AG2 | |
| If someone does something on the road that annoys me, I flash them with high beam | AG3 | |
| Honk my horn at others | AG4 | |
| When someone tries to skirt in front of me, I drive in an assertive way to prevent it | AG5 | |
| High-velocity driving style | In a traffic jam, I think about ways to get through the traffic faster | HV1 |
| When in a traffic jam and the lane next to me starts to move, I try to enter that lane | HV2 | |
| Traffic light turns green, the front car doesn’t go instantly, I urge them to move on | HV3 | |
| Purposely tailgate other drivers | HV4 | |
| Get impatient during rush hours | HV5 | |
| Drive through traffic lights that have just turned red | HV6 | |
| Distress-reduction driving style | Use muscle relaxation techniques while driving | DS1 |
| While driving, I try to relax myself | DS2 | |
| Do relaxing activities while driving | DS3 | |
| Mediate while driving | DS4 | |
| Patient driving style | At intersection where I must give right-of-way to oncoming traffic, I wait patiently | P1 |
| Base my behavior on the motto “better safe than sorry” | P2 | |
| When a traffic light turns green and the car in front doesn’t get going, I just wait | P3 | |
| Plan long journeys in advance | P4 | |
| Cautious driving style | Tend to drive cautiously | C1 |
| Drive cautiously | C2 | |
| Always ready to react to unexpected maneuvers by other drivers | C3 | |
| Distracted or preoccupied and must slam on the brakes to avoid a collision | C4 | |
| Confidence | Feel I have control over driving | AX6 |
| Feel comfortable while driving | AX7 |
Table 2 shows the descriptive statistics of the 20 participants in the experiments. According to these statistics, more than half of the study population (65%) were men, and only about 40% of the participants rode a bike three or more days a week. Also, more than half of the studied individuals (60%) ride less than 20 kilometres per week. Most of them rode a bike on roads that are loud, bumpy, and full of traffic. Lastly, half of these individuals were involved in a crash while riding, and more than half of them (65%) have not ridden after drinking. It is worth noting that as the sample was homogenous regarding age and biking experience, these two variables have not been included in the analysis.
| Variable | Category | Percentage (%) |
| Gender | Male Female |
65 35 |
| The frequency of weekly biking | Daily 5-6 days per week 3-4 days per week 1–2 days per week Only at the weekend Never |
5 10 25 25 5 30 |
| Kilometers biking weekly | 0–10 km 11-20 km 21-30 km 31-40 km more than 40 km |
35 25 25 10 5 |
| Regular route characteristics | none traffic loud bumpy traffic and bumpy traffic and loud all |
25 25 0 10 20 10 10 |
| Involvement in a crash | Yes No |
50 45 |
| The experience of driving after drinking | Yes No |
35 65 |
4. Results
4.1. Structural Equation Modelling
The developed PLS-SEM model is illustrated in Figure 2, which is taken directly from the SmartPLS software. It represents a second-order model, which is also known as the hierarchical component model, and is used to represent higher-level latent constructs formed by grouping related first-order constructs. It is especially appropriate for this study given that the objective was to examine the contribution of different behaviours on the performance of bicyclists.
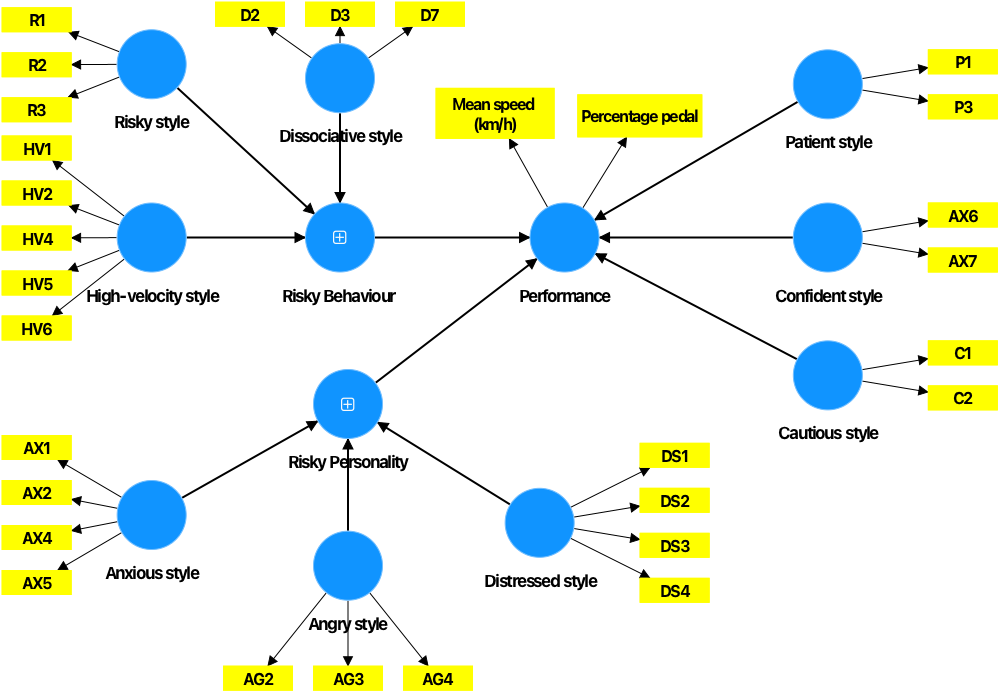
In applying PLS-SEM, the adverse behavioural factors were divided into two groups: risky behaviour (risky style, dissociative style and high-velocity style) and risky personality (anxious style, angry style and distressed-reduction style). More positive behavioural factors (patient style, confident style and cautious style) were also considered individually, as shown on the right of the figure. The indicators of performance are mean speed and percentage of time spent pedalling during the simulation. These two measures were used to assess the performance of cyclists as they can influence the crash risk of cyclists and their ability to respond to hazards.
The validity and reliability of the constructs were assessed at multiple stages, following the guidelines provided by Hair et al. (Hair et al., 2022). As the first step in SEM assessment and evaluation of the measurement models for reliability and convergent validity, checks were made on thresholds for factor loadings (0.6), composite reliability and reliability coefficient (0.7), and convergent validity (average variance extracted (AVE)) (0.5). Indicators having values lower than these thresholds were removed from the study in accordance with Hair et al. (Hair et al., 2022). Table 3 provides the outcome for the reliability and convergent assessment for each variable; the indication from these results is that all reliability and convergent validity criteria are satisfied.
| Constructs | Items | Loading | AVE | ||
| Dissociative Driving Style | DS2 | 0.84 | 0.75 | 0.81 | 0.59 |
| DS3 | 0.72 | ||||
| DS7 | 0.75 | ||||
| Anxious Driving Style | AX1 | 0.90 | 0.90 | 0.92 | 0.74 |
| AX2 | 0.91 | ||||
| AX4 | 0.87 | ||||
| AX5 | 0.76 | ||||
| Risky Driving Style | R1 | 0.65 | 0.63 | 0.76 | 0.51 |
| R2 | 0.85 | ||||
| R3 | 0.63 | ||||
| Angry Driving Style | AG2 | 0.95 | 0.92 | 0.93 | 0.82 |
| AG3 | 0.84 | ||||
| AG4 | 0.92 | ||||
| High-Velocity Driving Style | HV1 | 0.78 | 0.85 | 0.88 | 0.61 |
| HV2 | 0.91 | ||||
| HV4 | 0.68 | ||||
| HV5 | 0.84 | ||||
| HV6 | 0.66 | ||||
| Distressed reduction Driving Style | DS1 | 0.89 | 0.82 | 0.86 | 0.61 |
| DS2 | 0.83 | ||||
| DS3 | 0.74 | ||||
| DS4 | 0.64 | ||||
| Patient Driving Style | P1 | 0.82 | 0.84 | 0.87 | 0.77 |
| P3 | 0.94 | ||||
| Cautious Driving Style | C1 | 0.97 | 0.96 | 0.98 | 0.95 |
| C2 | 0.98 | ||||
| Confident Driving Style | AX6 | 0.98 | 1.68 | 0.92 | 0.85 |
| AX7 | 0.85 | ||||
| Performance | Mean speed (km/h) | 0.97 | 1.27 | 0.86 | 0.76 |
| % of time pedaling | 0.76 |
Table 4 lists the discriminant validity outcomes according to the Heterotrait-Monotrait ratio (HTMT), defined as the ratio of the between-trait correlation to the within-trait correlations. Assessing discriminant validity aims to determine whether a construct is strongly related to its indicators. For example, the HTMT value of 0.16 between dissociative style and anxious style suggests that these two constructs are different, and they capture distinct concepts as the HTMT value is low. The low HTMT value means that the items within each latent variable are strongly correlated, while the correlations between items across constructs are low. Based on Hair et al.'s recommendation that this ratio be less than 0.9 to establish discriminant validity, it is evident that the measurement models met this criterion.
| ANG | ANX | DSV | DS | HV | PT | RS | CU | C | |
| Angry (ANG) | |||||||||
| Anxious (ANX) | 0.45 | ||||||||
| Dissociative (DSV) | 0.29 | 0.16 | |||||||
| Distressed reduction (DS) | 0.41 | 0.43 | 0.39 | ||||||
| High velocity (HV) | 0.26 | 0.64 | 0.36 | 0.33 | |||||
| Patient (PT) | 0.69 | 0.23 | 0.29 | 0.54 | 0.21 | ||||
| Risky style (RS) | 0.41 | 0.41 | 0.41 | 0.43 | 0.61 | 0.45 | |||
| Cautious (CU) | 0.25 | 0.60 | 0.18 | 0.19 | 0.21 | 0.35 | 0.81 | ||
| Confident (C) | 0.48 | 0.88 | 0.20 | 0.37 | 0.31 | 0.27 | 0.51 | 0.54 | |
| Performance (P) | 0.07 | 0.26 | 0.22 | 0.45 | 0.45 | 0.36 | 0.45 | 0.34 | 0.31 |
The next step was to assess the second-order measurement models. The latent indicators were evaluated by checking the Variance Inflation Factor (VIF) values to check the multicollinearity between variables. The VIF values of the indicators of the constructs are shown in Table 5. VIF values ranging from 1 to 5 indicate that the variable is moderately correlated. In this case, as the VIF values are well below 5 and even less than 1.5 (as shown in Table 5), it can be concluded that there is no collinearity between the latent variables. The model results indicated acceptable levels of internal consistency, convergent validity, and discriminant validity, as well as satisfactory levels of multicollinearity, suggesting that the measurement and structural models are methodologically sound.
| Indicator | VIF (Risky Personality) | VIF (Risky Behaviour) |
| Angry style | 1.30 | |
| Anxious style | 1.28 | |
| Distressed reduction style | 1.20 | |
| Dissociative style | 1.11 | |
| High-velocity Style | 1.34 | |
| Risky style | 1.36 |
In the final step of evaluating the SEM model, the coefficient of determination (R2) was assessed. According to the PLS-SEM output, the R2 value of 0.4 suggests a moderate explanatory power, per the guidelines provided by Hair et al. (Hair et al., 2022).
After evaluating the SEM model, the path coefficients and relevant p-values for the relationships between first-order and second-order constructs were determined. The results are shown in Table 6. These results show that all variables, except dissociative driving style, significantly affect the second-order constructs. However, none of the factors significantly affect the performance as the dependent variable, possibly due to unobserved nonlinearity among relationships that could not be explored with SEM. Applying FsQCA can facilitate the exploration of such nonlinear relationships in addition to identifying configurations of conditions that jointly influence performance. Unlike SEM, which focuses on linear, net effects, FsQCA allows for examining complex relationships, capturing how different combinations of factors can lead to the same outcome, as well as the possibility of asymmetric relationships where conditions leading to high performance may differ from those leading to low performance. The FsQCA investigation is described next.
| Structural path | Coefficient | P values |
| Angry style -> Performance | 0.109 | 0.547 |
| Angry style -> Risky Personality | 0.403 | 0.002 |
| Anxious style -> Performance | 0.144 | 0.602 |
| Anxious style -> Risky Personality | 0.535 | <0.001 |
| Cautious style -> Performance | -0.036 | 0.942 |
| Confident style -> Performance | 0.599 | 0.434 |
| Dissociative style -> Performance | -0.044 | 0.63 |
| Dissociative style -> Risky behaviour | -0.15 | 0.507 |
| Distressed reduction style -> Performance | 0.098 | 0.568 |
| Distressed reduction style -> Risky Personality | 0.364 | 0.013 |
| High-Velocity style -> Performance | 0.231 | 0.334 |
| High-Velocity style -> Risky behavior | 0.789 | <0.001 |
| Patient style -> Performance | -0.242 | 0.438 |
| Ricky style -> Performance | 0.077 | 0.524 |
| Ricky style -> Risky behaviour | 0.262 | 0.016 |
| Risky Personality -> Performance | 0.269 | 0.587 |
| Risky behaviour-> Performance | 0.293 | 0.411 |
4.2. Fuzzy-set Qualitative Comparative (FsQCA) Analysis
After examining the individual effects of behavioural factors, the focus shifted to FsQCA, which explores the impact of variable combinations, known as configurations, on the outcome (cycling performance). After processing the SEM model and extracting the latent variable scores, the model could be analyzed using FsQCA.
The FsQCA output contains three types of solutions (complex, parsimonious, and intermediate) as potential combinations and configurations that can predict strong outcome conditions in most cases (Fiss, 2011). The complex solution includes all possible combinations of conditions but can be difficult to interpret due to the large number of configurations identified. The parsimonious solution simplifies this by highlighting only the core conditions. The intermediate solution lies between the two, incorporating only theoretically justifiable assumptions to identify both core and possible conditions (Pappas & Woodside, 2021).
In this study, the focus was on the parsimonious solutions as the aim was to focus on presenting the most important conditions that cannot be omitted from any solution, the so-called “core conditions” (Fiss, 2011). The eight parsimonious solutions (C1-C8) are presented in Table 7, which is taken directly from FsQCA software output, while the consistency and coverage values are shown in Table 8. According to the parsimonious solutions, for higher performance (i.e., higher mean speed and higher percentage of pedalling), there are four sufficient conditions (C1, C6, C7, C8), since as seen in Table 8, the related coverage and consistency are greater than 0.2 and 0.8, respectively. The following points summarize the four solutions:
-
C1 states that for higher performance, having traits of high confidence, low cautiousness, and high risky style are sufficient.
-
According to C6, a combination of having a risky style and being anxious while driving is sufficient for higher performance.
-
As C7 shows, a combination of risky style and being angry while driving is sufficient for higher performance.
-
C8 represents a combination of risky style, lack of confidence, and lack of distressed reduction style, which is sufficient for higher performance.
| Factors | C1 | C2 | C3 | C4 | C5 | C6 | C7 | C8 |
| Confident style | ● | ⨂ | ||||||
| Cautious style | ⨂ | ⨂ | ||||||
| Risky style | ● | ● | ● | ● | ● | |||
| Anxious style | ● | ● | ● | |||||
| Angry style | ⨂ | ● | ● | |||||
| Distressed reduction style | ⨂ | ⨂ | ||||||
| High velocity style | ● | |||||||
| Dissociative style |
| C1 | C2 | C3 | C4 | C5 | C6 | C7 | C8 | |
| Coverage | 0.25 | 0.16 | 0.22 | 0.22 | 0.21 | 0.26 | 0.22 | 0.21 |
| Consistency | 0.82 | 0.70 | 0.73 | 0.74 | 0.74 | 0.86 | 0.80 | 0.80 |
| Overall solution Coverage | 0.61 | |||||||
| Overall solution Consistency | 0.72 | |||||||
It is useful at this point to illustrate how the results of the FsQCA analysis may be used to inform the design of interventions or safety campaigns, even though this may be somewhat speculative. For example, configuration C1, which shows high confidence, low cautiousness, and high risky style, suggests that cyclists who are confident and willing to take risks but not cautious may have higher performance (e.g., higher mean speed and more consistent pedalling). This pattern might reflect thrill-seeking, which may not align with safety-oriented behaviours. Based on this insight, safety campaigns can work on social training programs aiming to help people turn confidence into smart, responsible choices by encouraging them to stay aware of their surroundings and think ahead about potential hazards. Another example can be seen in the configurations C6 (risky style + anxious style) and C7 (risky style + angry style), which suggest that some cyclists may take more risks when they are feeling anxious or angry, possibly using risky behaviour as a way to manage their emotions. These riders might be acting out of frustration or uncertainty rather than clear decision-making. To support them, interventions could potentially focus on helping them manage their emotions through programs such as stress-reduction practices, while also raising awareness about the risks involved in their choices.
In the next step, the predictive validity of the model was assessed. For this purpose, as suggested by Pappas et al. (Pappas & Woodside, 2021), the data were randomly split into two subsamples. The first subsample was used to extract the sufficient and necessary configurations (C11- C14), which are shown in Table 9. The consistency and coverage for these configurations are presented in Table 10.
| Factors | C11 | C12 | C13 | C14 |
| Confident style | ● | ● | ● | |
| Cautious style | ⨂ | |||
| Risky style | ||||
| Anxious style | ||||
| Angry style | ⨂ | |||
| Distressed reduction style | ● | |||
| High velocity style | ||||
| Dissociative style | ● | |||
| Patient style | ⨂ |
| C11 | C12 | C13 | C14 | |
| Coverage | 0.52 | 0.63 | 0.46 | 0.32 |
| Consistency | 0.76 | 0.87 | 0.86 | 0.98 |
| Overall solution Coverage | 0.61 | |||
| Overall solution Consistency | 0.72 | |||
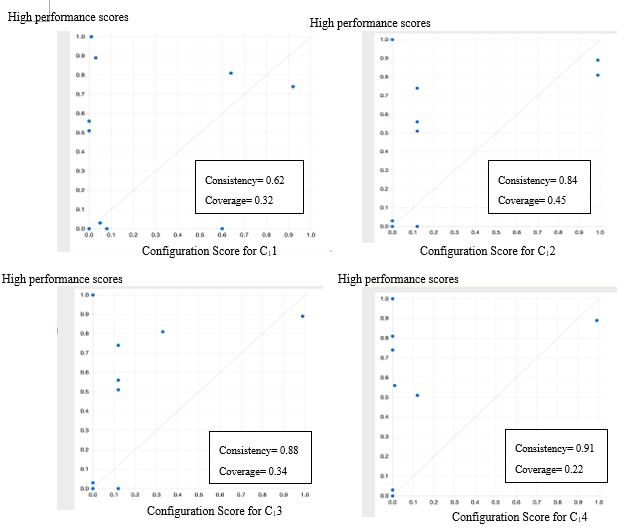
The second subsample was used to draw an X-Y plot in the FsQCA software (Figure 3) using the configurations extracted from the first subsample to show that the consistency and coverage in the two subsamples are consistent. In FsQCA, an X-Y plot is a graphical representation of the relationship between two fuzzy sets, typically the outcome (Y) and a single condition or a combination of conditions (X). In such a plot, the x-axis represents the membership scores of the condition(s) (X), and the y-axis represents the membership scores of the outcome (Y). This plot is used to visualize the relationship between the condition(s) and the outcome, and also to identify the coverage and consistency of the configurations that are associated with the outcome. The plot in Figure 3 shows the values of consistency and coverage from the second subsample extracted from the FsQCA software. In Figure 3, the Y-axis represents high performance across all items, while the X-axis corresponds to the sufficient configurations listed in Table 10. The results of the predictive validity test demonstrate that the findings are reproducible across different samples, as the consistency and coverage values of the sufficient configurations identified in the first subsample align with those obtained from the second subsample, showing no contradictions between the two. Therefore, it can be concluded that the capability of the model for predicting the performance, as well as the predictive validity of the model, are confirmed.
To briefly summarize this aspect of the study, while the SEM analysis focused on examining the individual effect of each behavioral trait, FsQCA identifies combinations of conditions or configurations that are sufficient to produce a given outcome. Through this approach, several configurations of behavioral traits were identified that were sufficient for higher cycling performance. For example, high performance was associated with combinations such as high confidence + low cautiousness + risky style (C1), or risky style paired with emotional traits such as anxiety (C6) or anger (C7). These insights go beyond what SEM could provide, suggesting that performance can be shaped by specific behavioural profiles, even when no single trait is strong enough to make a significant impact.
This contrast illustrates the added value of the hybrid approach. SEM facilitated the validation of the measurement models and assessment of the independent contribution of each trait, while FsQCA uncovered meaningful combinations that reflect the complexity of real-world behavior. By combining these two perspectives—one symmetric and the other one asymmetric—a deeper and more comprehensive understanding of how cyclist behaviour relates to performance was provided, especially in the context of small sample sizes.
5. Summary
In this study, a hybrid use of Partial Least Squares Structural Equation Modeling (PLS-SEM) and Fuzzy-set Qualitative Comparative Analysis (FsQCA) was explored to assess the impact of safety-related behavioural traits on the safety performance of bicyclists using a limited sample of data as a case study. The data were collected from individuals who participated in bicycle simulator experiments after completing a survey that aimed to identify their potential for risky behavior. The results from PLS-SEM showed that none of the factors had a significant individual impact on the performance. FsQCA was then applied to assess the effect of combinations of variables on the performance of bicyclists, and it was seen that these effects are informative. From the outputs of PLS-SEM, it was seen that four configurations contribute sufficiently to higher performance. Therefore, it can be concluded that the two approaches complement each other in capturing complex phenomena and providing deeper insights into data samples that may be limited out of necessity. Specifically, in contexts where specific groups of road users are predominant, the proposed hybrid framework allows for targeting countermeasures to specific behaviours even with limited data availability and helps identify factors impacting their safety performance.
This study offers a novel contribution through the hybrid application of PLS-SEM and FsQCA in traffic safety research, especially when sample sizes might be limited. In this context, it should be noted that this pilot case study was specifically designed to explore the feasibility of applying a hybrid PLS-SEM and FsQCA approach to a small-sample context. While PLS-SEM can estimate complex models in exploratory research, and FsQCA is designed to effectively analyze smaller samples in addition to larger ones, some limitations should be acknowledged. First, the small sample size of this study, in addition to the narrow geographic focus, can restrict the generalizability of the results. Therefore, the results should be interpreted in the context of the case study, especially since cultural norms, traffic laws, and cycling infrastructure can vary from one region to another, which can have an impact on both behavioral traits and performance outcomes. Second, the participants in this study were relatively homogenous in terms of some characteristics, such as age and cycling experience, which were therefore excluded from the model due to the lack of significant variation. Third, the selection process of participants may have led to self-selection bias as the limited capacity of the bicycle simulator restricted the number of individuals who could be included in the study. Consequently, only those who were available may have participated, potentially limiting the representativeness of the sample and introducing selection bias into the findings. Lastly, the SEM model did not reveal significant individual effects on performance, which may be a result of the complexity and nonlinearity of relationships among behavioural characteristics.
Based on the promising results of this study, and considering its limitations, future research should aim to enhance the generalizability of findings by applying this hybrid technique to larger and more diverse samples in different geographic and cultural contexts. In addition, expanding the range of included variables to environmental and socioeconomic factors could potentially enhance the depth of analysis. Finally, the hybrid SEM-FsQCA framework could be complemented with the use of machine-learning techniques to account for the nonlinear relationships.
CRediT contribution
Mahsa Jafari: Conceptualization, Data curation, Formal analysis, Methodology, Software, Writing—original draft
Bhagwant Persaud: Conceptualization, Supervision, Funding acquisition, Writing—review & editing.
Carmelo D’agostino: Data curation, Writing—review & editing.
Data availability
The data are available on request to the authors.
Declaration of competing interests
The authors report no competing interests.
Declaration of generative AI use in writing
The authors declare that no generative AI was used in this work
Ethics statement
The study was conducted as part of a bachelor’s thesis research, making it exempt from ethical review. Data were utilized only for the purposes of this research. No ethical issues (including privacy issues) arise in the data collection and re-use.
Funding
This research was funded by a Discovery Grant (Appl. ID RGPIN-2023-03787) from the Natural Sciences and Engineering Research Council of Canada (NSERC). Furthermore, this study was partly supported (last author-Carmelo D’Agostino) by the European Union (ERC, SUperSAFE, 101039222). However, the views and opinions expressed are those of the authors only and do not necessarily reflect those of the European Union or the European Research Council. Neither the European Union nor the granting authority can be held responsible for them.
Editorial information
One of the authors, Carmelo D’Agostino, is a member of the editorial board of the Traffic Safety Research journal. To minimize the risk for conflict of interest during the review process, an external guest editor was called to handle this paper.
Guest editor: Reginald R. Souleyrette, University of Kentucky, the United States of America
Reviewers: Anonymous Reviewer, not disclosed due to disagreement with editor’s decision; Shayan Sharifi, Wayne State University, the United States of America