Evaluation of the human interaction with automated vehicles on highways
Guest editor: Reginald Souleyrette, University of Kentucky, the United States of America
Reviewers: Eric Jackson, University of Connecticut, the United States of America
Austin Obenauf, WSP, the United States of America
Received: 14 June 2024; Accepted: 22 November 2024; Published: 10 January 2025
Abstract
Human-driven vehicles (HVs) will be interacting with automated vehicles (AVs) at AV market penetrations between 0% and 100%. However, little is known about how HVs interact with AVs. This study addresses knowledge gaps related to how HVs will interact with AVs on highways. The research was conducted in Oregon State University's Passenger Car Driving Simulator. Additionally, a Shimmer3 GSR+ sensor was used to measure participants' galvanic skin response (GSR). Two independent variables (i.e. leading vehicle speed and autonomy) were selected and resulted in a 2 × 2 factorial design. Participants were also exposed to two hard-braking scenarios: one with a leading HV and one with a leading AV. A post-drive survey included questions about the participant's level of comfort following HVs and AVs. The driving simulator experiment was successfully completed by 36 participants. Results from the linear mixed model show that driver level of stress was 70% higher in hard-brake scenarios involving HVs versus AVs. Of the 78 hard-braking scenarios tested in this study, 10 crashes were observed (4 with an HV, 6 with an AV). Half of the participants involved in a crash with an HV perceived the leading vehicle to be at fault, while all the participants who crashed with an AV blamed themselves for the error. Additionally, drivers over the age of 34.5 were found to give AVs 2% larger headways than HVs, while younger drivers gave AVs 18% smaller headways than HVs. Zero participants above the age of 34.5 years self-reported being ‘unconcerned’ when following an AV in the post-drive survey, while 38% of participants under the age of 34.5 did. This study supports the need for a better understanding of how human drivers will interact with AVs to calibrate human driver models when AV market penetrations are between 0% and 100%.
Keywords
automated vehicles, driving simulator, human-driven vehicles
Introduction
Automated vehicles (AVs) will undoubtedly have a significant impact on the safety and operation of future transportation networks. Human-driven vehicles (HVs) will be interacting with automated vehicles (AVs) at AV market penetrations between 0% and 100%. However, little is known about how HVs interact with AVs.
Automated vehicle implementation challenges
Leading companies in the field of AV development, such as General Motors, Waymo (Google), Uber, and Baidu have increased AV testing on public roads significantly in recent years (Bridgelall & Tolliver, 2020). Compared to urban driving, the challenges AVs face driving on highways are significantly less, as highway infrastructure and highway users tend to be more predictable (Nothdurft et al., 2011). As a result of this understanding, many transportation agencies are preparing for widespread AV implementation on highways (KPMG, 2019). This has increased the urgency of research aimed at solving the set of challenges associated with AV operation on highway infrastructure. Table 1 summarizes estimates from 2017 for when AVs will be introduced to certain driving environments (Shladover, 2017), which aligns well with other predictions reviewed in this literature review. The table references Society of Automotive Engineers (SAE) Levels of Driving Automation. In general, SAE level 1 and 2 are defined as vehicles with driver support features (e.g. adaptive cruise control, lane centering), whereas SAE level 3, 4, and 5 are defined as vehicles with full self-driving features (e.g. self-driving on limited access highways, full self-driving). SAE level 0 is defined as a vehicle with no driver support features of self-driving features. For the purposes of this study, an HV is defined as an SAE level 0 vehicle and an AV is defined as an SAE level 5 vehicle.
|
Environment |
SAE Level 1 |
SAE Level 2 |
SAE Level 3 |
SAE Level 4 |
SAE Level 5 |
|---|---|---|---|---|---|
|
Everywhere |
2020s |
2025s |
— |
— |
2075s |
|
General Urban |
2010s |
2025s |
2030s |
2030s |
— |
|
Pedestrian Zone |
2010s |
2020s |
2020s |
2020s |
— |
|
Limited-Access Highway |
2010s |
2010s |
2020s |
2025s |
— |
|
Separated Guideway |
2010s |
2010s |
2010s |
2010s |
— |
While significant progress has been made in understanding how AVs will perform under various roadway conditions, not much is known about how HVs will interact with AVs on highways. Specifically, it is not fully understood how the interaction between HVs and AVs will impact highway safety and capacity, and what can be done to mitigate any negative impacts (Ren et al., 2023). Therefore, it is imperative to understand the dynamics of HV-to-AV interactions on highways before the widespread adoption of AVs.
Human trust in automated vehicles
While the public's perception of AVs continues to evolve with time, recent literature can still give a general sense of human drivers' trust in AVs. Five surveys conducted in the United States and Canada found that the general population consistently had considerable doubt in the ability of AVs to have a positive impact on transportation. Most survey respondents reported distrust in AVs' ability to handle unique or edge-case driving scenarios. Those respondents also preferred AVs to have an option for the human operator to take control when they desired. Furthermore, this study found that younger respondents consistently held more trust in AVs than older respondents, suggesting a future shift in public attitudes toward technology as younger generations age (Hedlund, 2017). An Australian survey on the topic of trust in AVs found similar results, with a significant majority of respondents expressing concerns related to perceived safety, trust, and control issues. Males, younger respondents, and respondents with higher levels of education in this survey were also found to hold more favorable views of AVs (Pettigrew et al., 2019). Another survey conducted in the U.S. also found that younger, educated males hold a more positive attitude of AVs than older, less educated females. The survey was distributed before and after the first crash between an AV and pedestrian in the U.S. and found that perceived safety levels in AVs dropped significantly after the crash and did not recover to their precrash levels (Tapiro et al., 2022).
Empirical studies have also investigated trust in AVs. One 2019 study found that human drivers' level of trust does not change between AVs that are programmed to imitate human driving behavior and AVs programmed to convey the impression of communicating with other AVs and the surrounding infrastructure. This may suggest that human drivers' level of trust in AVs is pre-determined and not influenced by AV driving behavior. Additionally, the study found that human drivers trusted AVs more with increased interaction time (Oliveira et al., 2019).
AVs are significantly more expensive than standard vehicles commercially available today and are only being tested in a few municipalities across the U.S. (Brownell & Kornhauser, 2014). Therefore, most studies evaluating human interactions with AVs cannot be conducted at any reasonable scale. Instead, other means of data collection must be utilized, such as small-scale vehicles. This study tested humans' intended driving responses against multiple variations of driving maneuvers performed by small-scale AVs. Results show that HV driving behaviors and perceptions of AVs are strongly related to the AVs' driving maneuvers (Zimmermann & Wettach, 2016). This suggests that AVs can viscerally communicate information to HVs through certain driving maneuvers—the opposite of the findings in Oliveira et al. (2019) as discussed in the previous paragraph.
Driving simulators in automated vehicle research
Driving simulators are established tools for researching human factors and driver behavior at a nanoscopic level (Fisher et al., 2011). Recently, driving simulators have been used to evaluate driver behavior when operating an AV. For example, one study used a driving simulator programmed to simulate automated driving at SAE level 3 to extract participants' level of trust in and perceptions of AVs (Buckley et al., 2018). Another study used a driving simulator to observe how drivers react to takeover requests when approaching an intersection, and how proximity to the intersection and in-vehicle tasks impact the risk of crashes with bicyclists approaching the same intersection (Fleskes & Hurwitz, 2019). Driving simulators are effective tools to measure headway, as driver headways in virtual driving simulator environments do not vary significantly from driver headways in real road driving (Risto & Martens, 2014).
There are significant knowledge gaps related to how human drivers will interact with AVs on highways. This information has the potential to change understandings of how mixed traffic is modeled, and how varying MPs of AVs impact highway capacity. To address these knowledge gaps and issues, several objectives were developed. First, we aim to compare drivers' level of stress in a hard-braking scenario when following an AV or an HV. Next, we seek to interpret how drivers assign fault from a crash with an AV or an HV. Another objective is identifying the demographic variables that impact a driver's headway when following an AV. Lastly, we plan to determine the difference in driver headways when following an AV or an HV. These objectives aim to fill the identified knowledge gaps and contribute to the body of research on AVs and their interaction with human drivers on highways.
Methodology
This study was approved by the Oregon State University (OSU) Institutional Review Board (Study number 2019-0261). The primary experimental tools were the OSU Passenger Car Driving Simulator and an iMotions Shimmer3 GSR+.
Oregon State University Passenger Car Driving Simulator
The full-scale OSU Passenger Car Driving Simulator is a high-fidelity motion-based simulator comprising of a full 2009 Ford Fusion cab mounted above an electric pitch motion system capable of rotating plus or minus four degrees. The vehicle cab is mounted on the pitch motion system with the driver's eye point located at the center of rotation. The pitch motion allows for an accurate representation of acceleration or deceleration (Swake et al., 2013). Three liquid crystals on silicon projectors with a resolution of 1 400 × 1 050 are used to project a front view of 180 × 40 degrees. These front screens measure 11 × 7.5 feet. A digital light-processing projector is used to display a rear image for the driver's center mirror. The two side mirrors have embedded liquid crystal displays. The update rate for all projected graphics is 60 hertz. Ambient sounds surrounding the vehicle and internal vehicle sounds are modeled with a surround sound system.
The computational system includes a quad-core host computer running Realtime Technologies SimCreator Software (Version 3.2) with graphics update rates capable of 60 hertz. The simulator software can capture and output values for multiple kinematic performance measures with high fidelity. These performance measures include position of the subject inside the virtual environment, velocity, and acceleration. Each of these computation components is controlled from the operator workstation. The driving simulator is in a physically separated room from the operator workstation to prevent participants in the vehicle from being affected by visual or audible distractions.
IMotions Shimmer3 GSR+
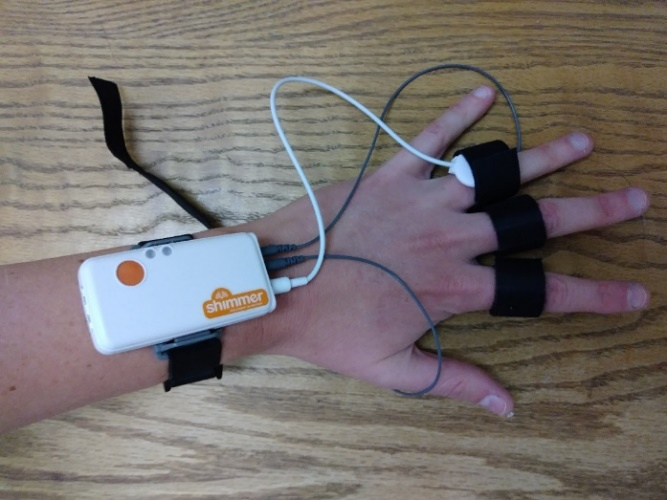
The Shimmer3 GSR+ measures galvanic skin response (GSR). GSR data is collected by two electrodes attached to two separate fingers on one hand. These electrodes detect stimuli in the form of changes in moisture, which increase skin conductance and change the electric flow between the two electrodes. Therefore, GSR data is dependent on sweat gland activity, which is correlated to participant's level of stress (Cobb et al., 2021), and is often used in studies to measure the physiological response related to scenarios effectively in psychological and physiological studies (Krogmeier & Mousas, 2019; Terkildsen & Makransky, 2019; Zou & Ergan, 2019). The Shimmer3 GSR+ sensors attach to an auxiliary input, which is strapped to the participant's wrist, as shown in Figure 1. The device was strapped to participants' less prominent hand to mitigate any false positive GSR responses. Data is wirelessly sent to a host computer running iMotions EDA/GSR Module software, which features data analysis tools such as automated peak detection and time synchronization with other experimental data.
Experimental design
Two independent variables were selected to assess HV to AV headways—leading vehicle speed and leading vehicle autonomy. A 2 × 2 factorial design was created to assess each of the two independent variables of the study. Additionally, participants were exposed to two hard-braking scenarios: one with a leading HV and one with a leading AV. In total, participants were exposed to each of the four levels and two hard-braking scenarios with six unique scenarios (Table 2). Scenarios presented in the same track were separated by 45 to 60 seconds of driving. Hard-braking events were only included in tracks III and IV and did not interfere with the car-following portion of each track.
|
Track |
Scenario |
Leading vehicle speed |
Leading vehicle autonomy |
Hard-braking |
|---|---|---|---|---|
|
I |
1 |
65 mph |
AV |
No |
|
2 |
45 mph |
HV |
No |
|
|
II |
3 |
65 mph |
HV |
No |
|
4 |
45 mph |
AV |
No |
|
|
III |
5 |
55 mph |
AV |
Yes |
|
IV |
6 |
55 mph |
HV |
Yes |
The within-subject design provides advantages of greater statistical power and reduced error variance associated with individual differences (Brink & Wood, 1998). However, one fundamental disadvantage of the within-subject design is the potential for ‘practice effects’, caused by practice, experience, and growing familiarity with procedures as participants move through the sequence of conditions. To control for practice effects, the order of the presentation of scenarios to participants needs to be randomized or counterbalanced (Girden, 1992). To account for practice effects, four different track layouts representing six different scenarios were presented in a random order to each participant. This adds flexibility and simplicity to the statistical analysis and the number of participants required. Following the experimental drives, participants were asked to respond to questions in a post-drive survey. The survey included questions about the participant's level of comfort following AVs and HVs. Additionally, participants were asked to identify fault if they were involved in one or more crashes during the experimental drives.
Virtual environment
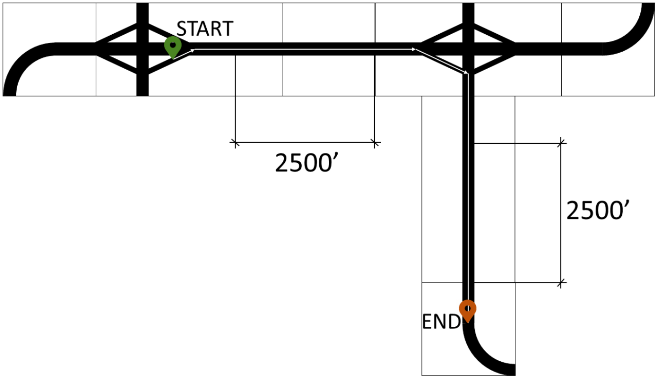
The virtual environment was developed using the following software packages: Internet Scene Assembler (ISA), SimCreator, and GNU Image Manipulation Program (GIMP). The dynamic elements of the simulations were developed in ISA using JavaScript-based sensors on tracks to engage position-dependent events such as hard braking. The environment was designed to replicate limited-access highway conditions with speed limits between 45 mph and 65 mph. Roadway cross-sections consisted of two 12-foot lanes in each direction of travel. The environment surrounding the roadway was designed to replicate a rural setting, minimizing off-road distractions for the participant. Speed limit signs were placed near the start, middle, and end of each experimental drive. Track layouts, dimensions, and segments of data collection are shown in Figure 2.
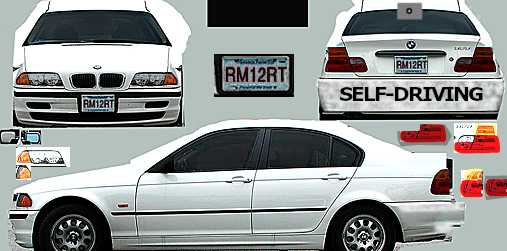
Pre-loaded dynamic objects from SimCreator were adjusted with GIMP to produce visually identifiable AVs. GIMP is an open-sourced image editing software that is capable of editing RGBA image file types, the file type used to render textures of dynamic objects in SimCreator. The rear of AV was edited to say ‘Self-Driving’, which replicates the terminology and position of text of current AVs being tested on public roads by WAYMO and Uber. The edited image file is shown in Figure 3. AVs in the simulation were programmed to have zero fluctuation in speed or lane position. The AV was programmed to merge in front of the participant once the participant began driving and to drive at a constant speed equal to the roadway speed limit. HVs in the simulation were programmed to have continuous random speed fluctuations plus or minus five mph, and to merge, follow, and brake at rates set by an aggression factor set randomly by normal distribution. Participants were briefed before their first experimental drive. Briefings were limited to explaining the experimental drive route (enter highway, take first exit, turn right) and defining ‘self-driving’ vehicles as vehicles that are operating with zero human input. Participants were shown the emergency stop button and told to end the simulation if they felt any simulator sickness or discomfort. No other information was provided to participants that would influence their driving behavior during the experimental drives.
Analysis and results
Of the 39 participants who participated in the study, 44% were female, while the age of the participants ranged between 18 years and 69 years (M(age) = 27.4, SD (age) = 10.9). Three participants reported simulator sickness and did not complete the experiment. All responses recorded from participants who reported simulator sickness were excluded from the analyzed dataset. Driving simulator headway data, GSR data, and survey data were reduced and analyzed to answer the study's research questions.
Headway results
Linear Mixed Effects Models (LMM) can account for errors generated from repeated measures, consider fixed or random effects in its analysis, and accommodate for both categorical and continuous variables. Furthermore, LMMs have a low probability of incurring Type I errors. Considering that this study’s sample size exceeds the minimum required for an LMM analysis and meets the required distributional assumptions, the LMM is a strong candidate for the analysis of the experimental drive dataset (Barlow et al., 2019).
Variables of roadway speed, leading vehicle type, whether the participant was involved in a crash, the participant's self-reported level of concern when following an AV, and age are included in the model as fixed effects. The participant variable is included as a random effect. The driver performance measures evaluated are headways when following either an AV or HV. Instantaneous time headways are recorded when participants follow select vehicles throughout the drive as intended by the experimental design. To find the closest value to the participant’s preferred following distance, the average following distance throughout the entire recorded segment could not be used. This is because the entire recorded segment includes headway datapoints when the participant is choosing their preferred headway, which highly varies across different participants. Instead, the minimum headway value in the recorded segment was used and will be referred to as ‘headway’ in the analysis.
To that end, an LMM was used to estimate the relationship between the independent variables and the participant's time headway. In the case of statistically significant effects, the Fisher's Least Significant Difference (LSD) test was run to perform post hoc contrasts for multiple comparisons. All statistical analyses were performed at a 95% confidence level using Python. Restricted Maximum Likelihood estimates were also used in the development of this model. Table 3 shows the results of the model. The linear mixed-effects model reveals significant factors influencing minimum time headway, including leading vehicle type, posted speed limits, crash involvement, participant age, and their concern following AVs.
|
Variable |
Levels |
Estimate |
SE |
T-Value |
|---|---|---|---|---|
|
Participant Random Effect (Var) |
— |
0.92 |
0.28 |
3.27** |
|
Constant |
— |
3.94 |
0.74 |
5.31** |
|
Leading Vehicle Type |
AV |
-0.22 |
0.15 |
-1.47* |
|
HV |
Base |
|
— |
|
|
Speed Limit |
45 mph |
0.38 |
0.15 |
2.46** |
|
65 mph |
Base |
|
— |
|
|
Crash |
Yes |
-0.93 |
0.42 |
-2.24** |
|
No |
Base |
|
— |
|
|
Age |
< 34.5 |
-1.35 |
0.78 |
-1.74* |
|
> 34.5 |
Base |
|
— |
|
|
Concerned Following AV |
Yes |
-1.64 |
0.88 |
-1.87* |
|
Other |
Base |
|
— |
|
|
Age × Concerned |
< 34.5 Yes |
1.49 |
0.98 |
1.52* |
|
> 34.5 No |
Base |
|
— |
Summary Statistics:
R2 = 72.07%
-2Log Likelihood = 418.98
AIC = 423.08
Significance level: ** = 0.05; * = 0.15
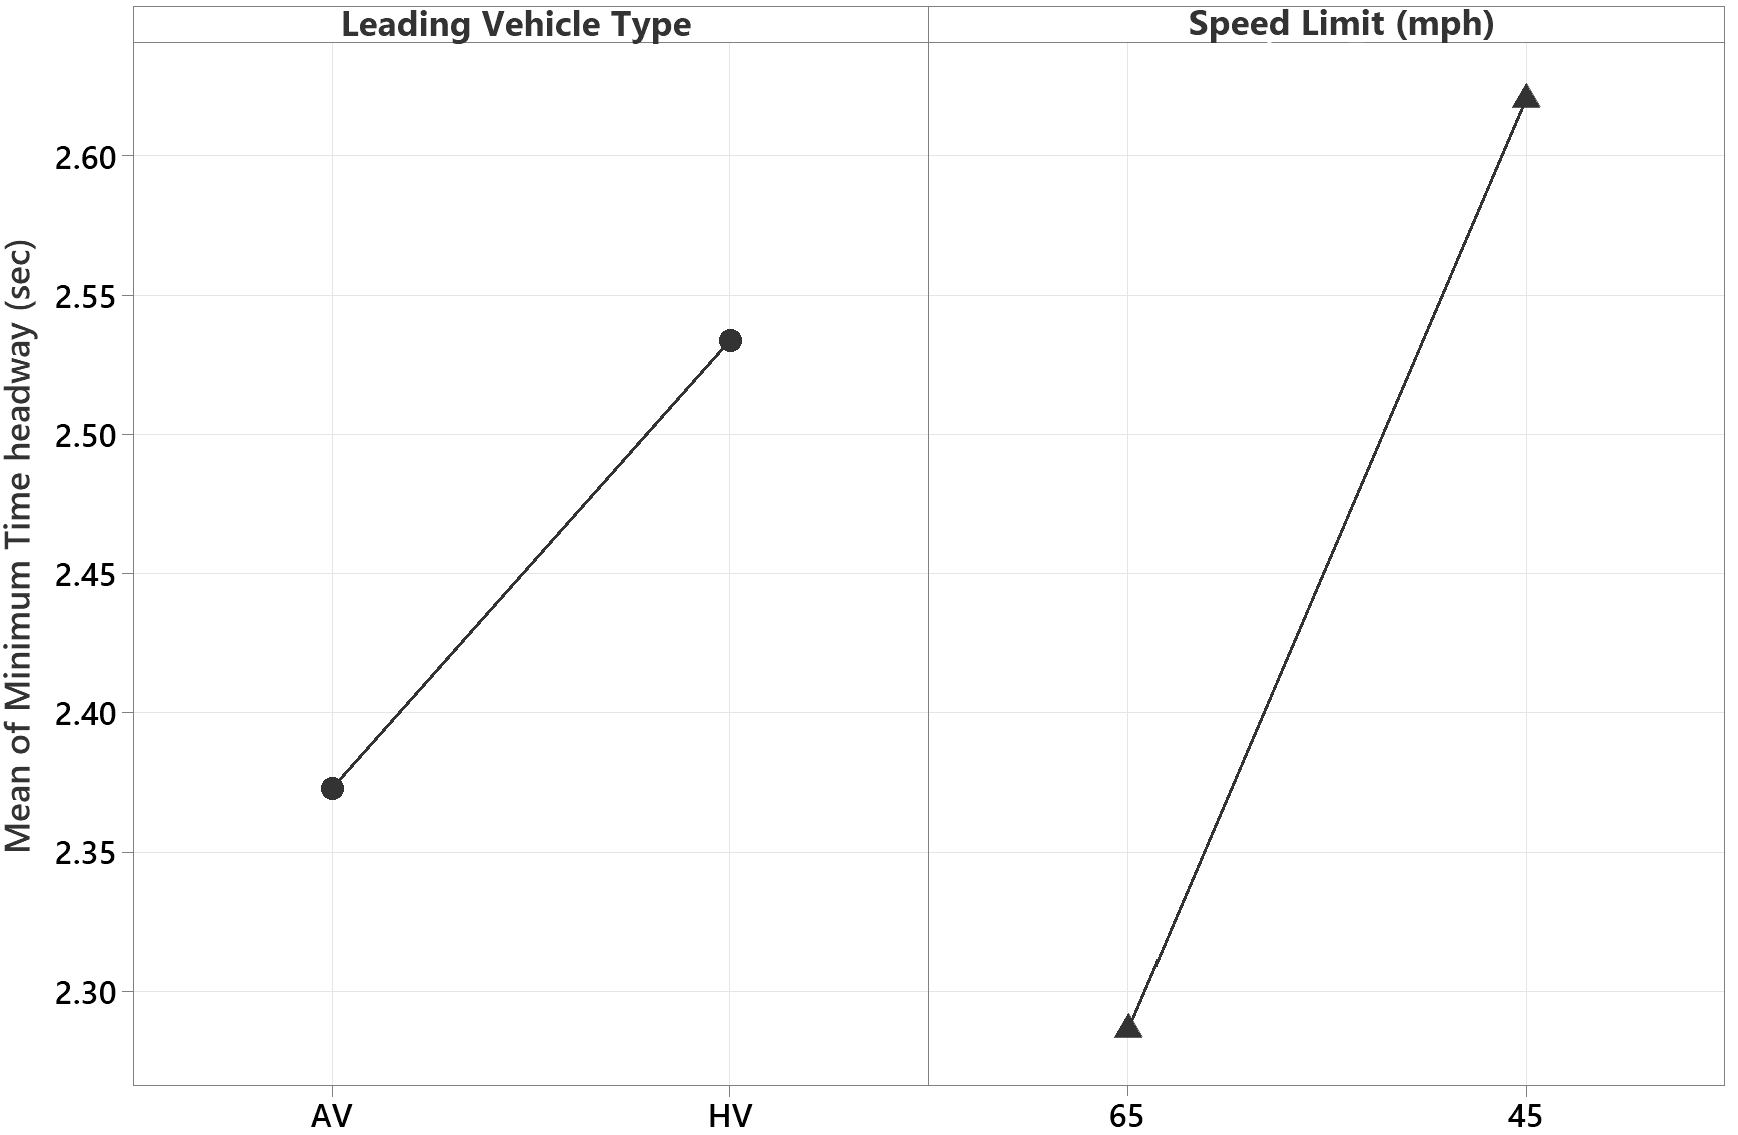
Both treatment factors were found to have a significant impact on headway. Regardless of other variables, participants following AVs maintained shorter headways than when following HVs (p-value < 0.15). Similarly, participants selected headways that were higher with 45 mph speed limits versus 65 mph speed limits (p-value < 0.05). The mean time headways for each level of leading vehicle type and the speed limit are shown in the main effects plot presented in Figure 4. The greatest average time headway was observed when participants followed an HV with a 45-mph speed limit (mean = 2.8 s, SD = 1.9 s), while the smallest average time headway was observed when participants followed an HV with a 65-mph speed limit (mean = 2.3 s, SD = 1.2 s).
Moreover, on average, participants who have experienced a crash event maintained a shorter minimum time headway (p-value < 0.05) when compared to the ones who were not involved in a crash. Results also showed that participants with an age of less than 35 tend to have a shorter minimum time headway compared to older participants. The two-way interactions between age and level of concern were found to be statistically significant (p-value < 0.05); younger participants with concerns about AVs tended to maintain a longer headway compared to their counterparts who were not concerned. Finally, the random effect was significant (Wald Z = 3.27, p < 0.001), which suggests that it was necessary to treat the participant as a random factor in the model. The model explains 72% (R-squared) of the variance in the minimum time headway, indicating a good fit.
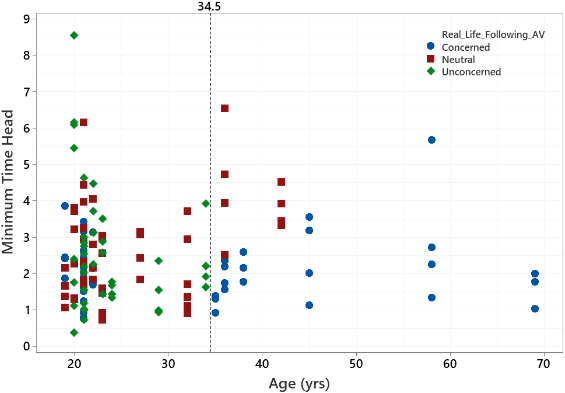
The relationship between headways and the age of participants was graphically presented while controlling for the question from the post-survey of participants' level of concern when following an AV. A clear divide was observed between participants above and below 34.5, clustering the data into two age groups (Figure 5). The vertical dashed line at 34.5 years in Figure 5 divides the two groups of participants. This age threshold was found to be significant, as noted in the LMM model output. For participants older than 34 years, there is a visible reduction in variability, with most minimum time headways clustering around the average value. Zero participants above the age of 34 years self-reported being ‘unconcerned’ when following an AV in the post-drive survey, while 38% of participants under the age of 35 did, which aligns with the model output.
Galvanic skin response results
GSR measurements were reduced to GSR peaks per minute for the two hard-braking scenarios. The dataset analyzed begins at the start of the leading vehicle's deceleration and ends when the leading vehicle has come to a complete stop. By reducing the data to peaks per minute, the natural variations between participants' peak heights are controlled for. GSR peaks per minute have been used in previous transportation human factors studies (Krogmeier & Mousas, 2019). Furthermore, GSR peaks per minute is generally accepted as an indicator of level of stress in human factors studies (Zou & Ergan, 2019). iMotions software was used to segment, compute, and reduce the dataset. The software develops a baseline GSR reading for each participant based on their average response throughout the entire experimental drive. Any amplified response above the baseline is classified as a peak and is recorded (iMotions, 2017).
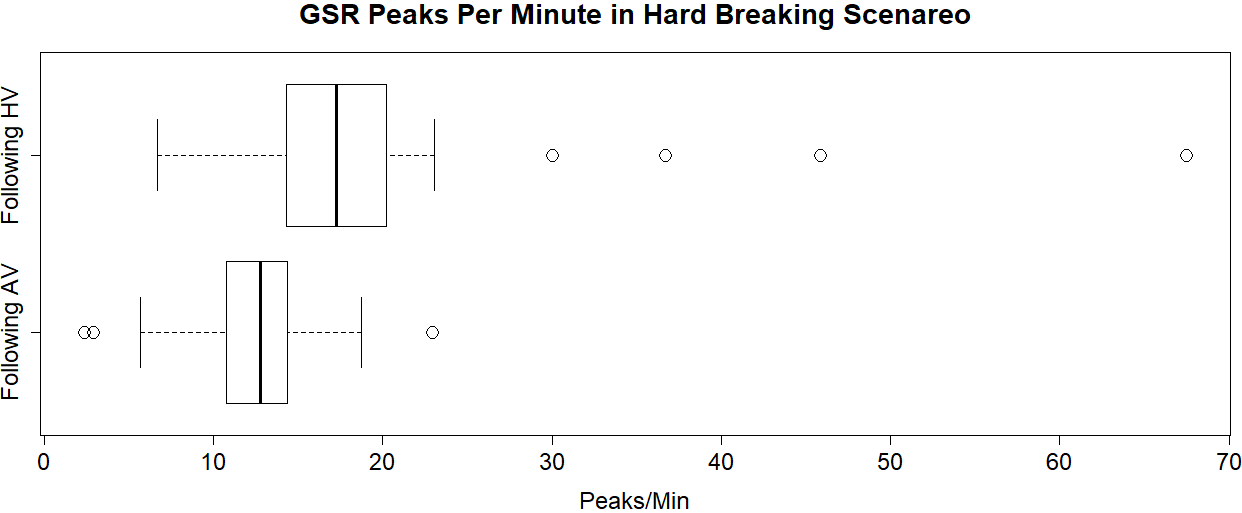
During the experimental drive, GSR data is transmitted wirelessly from the Shimmer+ device attached to the participant in the driving simulator to a host computer in the control room. The strength of wireless connectivity can vary, with weaker wireless connections degrading the reliability of the dataset. Fifteen datasets were removed from the analysis due to weak wireless connections. Figure 6 visualizes the two datasets of 21 participants with boxplots.
With said, the 21 datasets were analyzed using a paired t-test for dependent means (also referred to as a repeated measures t-test) at the 95% confidence level. This test is a reliable choice to test the difference between the two datasets because it accounts for repeated measures (within-subject) data. The test shows that GSR readings (peaks per minute) are 70% higher in the HV hard-braking scenario than in the AV hard-braking scenario (p-value < 0.01).
Post-ride survey results
After the experimental drive, participants were asked if they would prefer AVs to drive in a separate lane from human drivers on highways. Thirty-eight percent of participants indicated that they would prefer separation. However, how participants answered this question was not found to have a relationship with participant's headways when following an AV or HV. Zero participants above the age of 34.5 years self-reported being ‘unconcerned’ when following an AV in the post-drive survey, while 38% of participants under the age of 34.5 did.
Each participant was exposed to two hard-braking scenarios—one when following an AV and one when following an HV. If the participant was involved in a crash during one or both hard-braking scenarios, they were asked to identify who was at fault for the crash. Of the 78 hard-braking scenarios tested in this study, 10 crashes were observed (4 with an HV, 6 with an AV). Half of the participants in a crash with an HV placed fault on the leading vehicle, while all the participants in a crash with an AV placed fault on themselves. However, the sample size is too small to draw a conclusion.
Discussion
The results of this study show that driver headways differ when following an AV versus an HV. Regardless of any other factors, drivers give HVs 8% more following distance than AVs. This suggests that participants have a greater level of comfort or trust when following an AV, which is consistent with the findings related to research objectives. As discussed in the previous section, headways when following an AV can be as much as 18% lower than when following an HV, depending on the driver's age.
Drivers' level of stress was measured using GSR peaks per minute and was found to be significantly higher in the HV hard-braking scenario than in the AV hard-braking scenario. On average, GSR peaks per minute were 70% higher with HVs versus AVs in hard-braking scenarios. Of 4 observed crashes with HVs, two participants blamed the leading HV for the crash, and two blamed themselves. In contrast, zero of the 6 participants who crashed with an AV blamed the AV for the crash. Considering these findings, it is possible that participants have a higher level of confidence in an AV's ability to exhibit safe driving behaviors than an HV's. However, the sample size of driver interpretations of fault is too small to draw a definitive conclusion with confidence.
Of the demographic information provided by participants (e.g. gender, income, race), age was found to be the best indicator of how a participant perceives and interacts with AVs. None of the participants over the age of 34 reported being ‘unconcerned’ when following an AV, compared to 38% of participants under the age of 35. In terms of following distance, age was also a strong predictor of how a participant behaves. In general, those over the age of 34 had greater headways than those under the age of 35, regardless of the vehicle type. This is consistent with what is already known about age’s impact on driver headways (e.g. Brackstone et al. (2009)) and helps to validate the dataset produced in this study. Compared to their respective headways, when following an HV, those older than 34.5 increased headways by over 2% when following an AV. On the contrary, those younger than 34.5 decreased headways by over 18%.
Conclusions
This study addresses knowledge gaps related to how HVs would interact with AVs on highways. The research was conducted in Oregon State University's Passenger Car Driving Simulator. Additionally, a Shimmer3 GSR+ sensor was used to measure participants' galvanic skin response (GSR). To that end, driver level of stress is greater in hard-braking scenarios involving an HV compared to an AV, and there is some evidence to suggest that drivers are more likely to blame themselves if in a rear-end crash with an AV. In general, drivers give AVs less headway than HVs. However, age is a compelling indicator of how a driver perceives an AV and how much headway they may give when following an AV. Older drivers may follow AVs with slightly greater headways than HVs, while younger drivers follow AVs with significantly smaller headways than HVs. Given that younger drivers already tend to follow vehicles with smaller headways than other age groups (Brackstone et al., 2009), this could be a potentially dangerous emergent behavior. Education programs and campaigns should reinforce safe following distances regardless of the lead vehicle type. Overall, this study justifies the need for a better understanding of how human drivers will interact with AVs. A better understanding of these interactions can improve AV vehicle design and AV policy to increase safety for all roadway users, as well as be of value to the automobile insurance industry in quantifying crash risk factors associated with AV and HV interactions.
This study makes it clear that there is a difference between how drivers will follow HVs and AVs. While these differences likely have small impacts on highway travel times and flow, they could have more significant impacts on the analysis of other facility types (such as intersections) or on the calculation of other driver behaviors that use headway as an input variable. Therefore, the Highway Capacity Manual (HCM) should include lookup tables with different headway values based on the leading vehicle type and driver age. GSR data analyzed also suggests that drivers have a smaller physical response to hard-braking AVs, which could increase the risk of AVs being rear-ended by human drivers. AVs may be more likely to exhibit hard-braking behavior at intersections in states with restrictive yellow-light laws and in areas with high densities of inter-modal interaction (e.g. urban areas). States should consider evaluating yellow-light laws and their application to AVs to maximize safety, and vehicle manufacturers should consider ways to communicate to following vehicles of hard-braking that induce a greater physical response.
This study serves as an important step in understanding the differences in how human drivers interact with and perceive AVs. It is also an important step in developing an effective way to integrate driving simulator data into traffic models. However, there are limitations to this study. Even though the scenarios were randomized, within-subject study designs have limitations associated with fatigue and carryover effects, which can degrade participants' performance and compromise data validity. Participants likely have not driven with AVs before. Driving behavior and perceptions may change with increased exposure to AVs. Although efforts were made to recruit a sample of drivers like the driving population of the US, the final sample skewed slightly young. Fifteen GSR datasets were lost due to weak wireless connectivity between the GSR sensor and the host computer. Future studies should find a way to synchronize SimObserver data with GSR data so that the GSR sensor and host computer can be in the same room during data collection. This study could also be repeated in the future to assess how driver behaviors and attitudes toward AVs have changed over time. Future work could utilize driving simulators to observe other HV-to-AV interactions, such as yield behavior or gap acceptance, or it could be supplemented with eye-tracking data to better understand drivers' gaze patterns. HV to AV interaction data could also be used to inform multi-agent simulation models at a network level or to model intersections. Another potential future study could focus on gathering detailed crash or near-miss information to better understand HV and AV interactions. This could include driver responses like swerving, crash types, and the severity based on impact speed, which eventually contributes to efforts in preventing fatal and serious injury crashes.
Declaration of competing interests
The authors report no competing interests.
Ethics statement
The methods for data collection in the present study have been approved by the Oregon State University Institutional Review Board (Study number 2019-0261).
Funding
This work has been funded by the US Department of Transportation's University Transportation Center program Grant number 69A3551747110 through the Pacific Northwest Regional Transportation Center (PacTrans). The authors would like to thank PacTrans for their support.
Declaration of generative AI use in writing
The authors declare that no generative AI was used in this work.
CRediT contribution statement
Cadell Chand: Conceptualization, Data curation, Investigation, Methodology, Software, Visualization, Writing—original draft.
Hisham Jashami: Data curation, Formal analysis, Resources, Validation, Visualization, Writing—original draft.
Haizhong Wang: Conceptualization, Funding acquisition, Supervision, Writing—review & editing.
David Hurwitz: Conceptualization, Funding acquisition, Project administration, Resources, Supervision, Writing—review & editing.