Pedestrians' Attributions of Risk and Safety in Traffic: Case of Türkiye
Abstract
Pedestrians constitute between 17%–33% of all road traffic deaths depending on the region. For this reason, factors influencing the risky as well as safe behaviours of pedestrians need to be examined. The current study aims to understand risk and safety attributions of this road user group. A total of 254 pedestrians aged between 18 and 68 participated in the study. The participants filled out a demographic information form and Causal Dimension Scale-II (CDSII), which is composed of a qualitative and a quantitative part. CDSII is a self-report measure assessing how individuals evaluate the causes of events in various dimensions. The CDSII was filled out twice by the respondents: once for the riskiest and once for the safest situations experienced as a pedestrian. For 6 out of 9 situations in which pedestrians feel at risk, the most common reason was problematic drivers. Elimination of and decrease in crash risk were the most important reasons for feeling safe in areas separating pedestrians and drivers. The results showed that there is a difference between causal evaluations of risky and safe situations. The findings of this study point out to several points that require attention. One of these is the driver-pedestrian interactions. To overcome this, effective enforcement and well-functioning infrastructural improvements can be suggested.
1. Introduction
According to World Health Organization (WHO; 2023), pedestrians make up more than one fifth of road traffic fatalities globally (i.e. 21%). However, there are notable differences in the proportion of pedestrians in road traffic deaths across regions. Pedestrians constitute between 17%-33% of all road traffic deaths depending on the region (World Health Organization, 2023). Moreover, recent studies suggest that both individual income and the average income in the area are critical factors for pedestrian crashes, injuries, and deaths: the lower the income, the higher the risk (Noland et al., 2013; Roll & McNeil, 2022; Roshanfekr et al., 2020). Nevertheless, in their systematic review study, Rezapur-Shahkolai et al. (2022) found that studies focusing on interventions to decrease pedestrian injuries were mostly conducted in high income countries, highlighting the need for urgent attention to pedestrian safety issues among low and middle income countries. These findings emphasize the importance of research on pedestrian behaviour and measures in low and middle income countries.
There is a wealth of research focusing on pedestrian safety in low and middle income countries. In one review study, it was found that the most effective strategy for reducing pedestrian injuries in low and middle income countries was traffic calming strategies (e.g. road contraction, speed reduction); whereas the effects of those strategies aimed at minimizing pedestrian exposure (e.g. crosswalks) were minimal (Boun et al., 2024). However, the study also highlights that the effectiveness of these measures were diverse across countries. In another review study focusing on pedestrian safety around bus stops, Yendra et al. (2024) reported that this issue was widely unexplored in low income countries, and the methods used for research and data collection varied between countries with different income levels. Specifically, they found that crash data analysis was a common method in research among high income countries, while few studies employed this method among low and middle income countries.
Türkiye is an upper middle income country located in the European region of WHO (World Health Organization, 2024). According to latest data, pedestrian deaths constituted 18% of all road traffic deaths in 2023 within European Union (European Commission, 2025) and 25% of all road traffic deaths in 2021 within the wider European region of WHO. Percentage of pedestrian deaths was 22% in Türkiye in 2023 (Turkish Statistical Institute, 2024b; World Health Organization, 2024). This percentage can be considered as an indicator of a need for pedestrian-directed safety measures to be among the countries that are located at the lower end of pedestrian deaths in the European region. In developing such measures, understanding the characteristics of pedestrians in the area is a critical step. For this reason, the next section focuses exclusively on the studies conducted with Turkish pedestrians.
1.1. Previous research on pedestrian safety in Türkiye
There have been notable attempts by researchers to understand pedestrian crash characteristics in Türkiye. In one of these research, it was found that involvement in a crash was higher in urban compared to rural areas, whereas fatality rate was higher in rural compared to urban areas in Türkiye (Ozen et al., 2017). Similarly, Kuşkapan et al. (2019) found that the rate of traffic crashes involving at-fault pedestrians was around 11% in urban and 1.5% in rural areas in Türkiye. In another study, pedestrian crash locations were examined over a 6-year-period and it was concluded that contrary to developed countries, which target adapting the flow of motorways in a way to protect pedestrians, Türkiye’s approach was to maximize the flow (Kaygısız et al., 2015). Hence, attempts at improving pedestrian safety were rather aimed at physical separation of pedestrians and vehicles (e.g. middle fences, overpasses).
In addition to crash characteristics, behavioural characteristics of Turkish pedestrians were examined by the researchers. For instance, in both urban (i.e. 46%) and rural (i.e. 36%) areas, the most common pedestrian conduct causing the crash was violating the crossing rules in the absence of crossings or junctions (Kuşkapan et al., 2019). The second common conduct was displaying behaviours on the road that could endanger traffic flow in urban areas, while in rural areas, it was entering the vehicle road. In another study, overpass non-use rate was found to vary between 37%-94% among the pedestrians in the central business district of Ankara, and it was concluded that it was a habitual behaviour influenced from pedestrians’ perceptions of convenience, familiarity, and safety (Räsänen et al., 2007). These findings about behavioural characteristics are useful in defining the problem areas, however, it is also important to understand the psychological mechanisms and rationale behind the observable behaviour to be able to successfully change those problem behaviours.
Several studies investigated the relationship between psychological factors and pedestrian behaviours in Türkiye. Specifically, it was found that pedestrians’ attitude was an important factor associated with their risky behaviours (Serin et al., 2018). Similarly, attitudes favouring safe behaviours over violation and risk were negatively associated with risky behaviours among Turkish pedestrians (Şimşekoğlu, 2015). Other factors related to increased risky pedestrian behaviours were decreased satisfaction with infrastructure, lower level of empathy, and increased social conformity in Şimşekoğlu’s study. Öngören et al. (2024) found that locus of control is related to risky and positive pedestrian behaviours. Last but not least, in their study comparing five different countries (i.e. Estonia, Greece, Kosovo, Russia, and Türkiye), Solmazer et al. (2020) found that basic individual values were associated with risky pedestrian behaviours. Specifically, they found that self-transcendence (i.e. prioritizing others’ needs beyond the self) was associated with decrease in several risky pedestrian behaviour types in Türkiye; however, this relationship was not consistent across the five countries. This inconsistence emphasizes the critical role of regional context in investigating pedestrian behaviours.
1.2. Current study
Previous research on pedestrians highlight the regional differences in behaviour and crash characteristics (Kuşkapan et al., 2019; Ozen et al., 2017; Solmazer et al., 2020; World Health Organization, 2023), indicating that area-specific research can yield refined results. In addition, association between several psychological factors such as attitudes, personality, values (Serin et al., 2018; Şimşekoğlu, 2015; Solmazer et al., 2020) and risky behaviours encourage researchers to examine other psychological variables in the context of pedestrian safety. As mentioned above, understanding the underlying mechanisms of problem behaviour and desired behaviour is important in changing the risky to safe behaviour. For this reason, factors influencing the risky as well as safe behaviours of pedestrians need to be examined in detail and in context. One such variable is causal attributions, which is the way individuals explain the reasons of events (Weiner, 1990). According to Weiner’s theory of attribution, causes of events are evaluated on several dimensions, which elicits certain affective and cognitive assessments that influence likelihood of future behaviour. These dimensions are locus of causality, personal control, external control, and stability (McAuley et al., 1992). However, research in driving context showed that traffic-related attributions are evaluated on 3 dimensions (Fındık, 2023; Fındık et al., 2023). Specifically, personal control reflects whether the individual perceives the event to be controllable by himself/herself. External control refers to the perceived level of controllability of the event by other people. Finally, stability reflects perception of changeability of the event over time.
Pedestrians’ causal explanations can be considered as a variable of interest, since they were found to be associated with risky and aggressive behaviours among drivers (Fındık, 2023; Fındık et al., 2023; Wickens, 2009). Moreover, Fındık et al. (2023) found that crash-free drivers were more likely to perceive their weaknesses as externally controllable as compared to their crash-involved counterparts. They argued that this specific finding might be associated with depending less on skills and acting more cautiously. Nonetheless, causal attributions remained unexplored in the context of pedestrians in previous research.
Available research indicate that pedestrian attributions and behaviours might be associated with each other. For instance, a Chinese study shows that increase in fatalistic beliefs (i.e. explaining the reasons of events with unchangeable factors such as fate, luck, and so on) corresponded to increased risky behaviours among pedestrians (Liu et al., 2021). In one qualitative research conducted in Iran, young pedestrians explained their aberrant pedestrian behaviour by conformity with crowd, lack of social cohesion, and bypassing the law (Hashemiparast et al., 2017). This finding was in line with Demir et al.‘s (2019) finding that pedestrian behaviours are more social reactive than reasoned. In another study conducted in Spain, pedestrians’ self-reported attributions to crashes were examined and it was reported that 44.6% of crashes were caused by pedestrians themselves, 23.3% of them were caused by other road users, 26.7% of them were caused by infrastructure or environment, and 5.3% of the crashes were caused by bad luck (Useche & Llamazares, 2022). These studies indicate that causal attributions might be an important variable of interest for studies focusing on pedestrians.
For addressing the gap in the literature regarding causal attributions of pedestrians, the current study aims to conduct an exploratory analysis of risk and safety attributions of this road user group. Specifically, causal attributions of pedestrians regarding risky and safe situations in traffic are investigated in the scope of this research. The secondary aim was to explore if these attributions varied by demographic factors.
2. Method
2.1. Participants and procedure
A total of 254 pedestrians (84 males, 169 females, 1 not specified) participated in the study. They were aged between 18 and 68 (M = 25.41, SD = 9.96). Self-reported socioeconomic level was low for 51 (20.1%), medium for 146 (57.5%), and high for 57 (22.4%) participants. Finally, 109 of them (42.9%) did not hold a driver’s license, whereas 145 of them (57.1%) were drivers.
Ethical approval was obtained from the Human Subjects Ethics Committee of the Middle East Technical University. Participants were recruited online through snowball and convenience sampling methods. The link to the online survey was shared on social media platforms and the university’s survey database. Researchers shared the survey link with their contacts and asked them to disseminate it to their own contacts. Also, the link was shared on the university’s survey database, which allows students to participate in research in exchange for bonus course points. Upon clicking the link, potential participants displayed the informed consent, which informs them about the study and ensures their confidentiality. Those individuals who accepted the informed consent were then presented with the study questions.
It should be noted that both sample characteristics and study design reflect the limitations regarding the generalizability of the results to be presented. For instance, national statistics show that the percentage of males and females were 50.1% and 49.9%, respectively, during the year of data collection (Turkish Statistical Institute, 2024a). In the current work, corresponding percentages were 33.1% and 66.5%, indicating a gender bias. Similarly, median age of the population was 34 (Turkish Statistical Institute, 2024a), whereas the median age of the sample was 22, indicating an age bias. These biases were expected considering the recruitment processes employed in this study. The majority of the participants were composed of students of the psychology department of the university, which largely shaped the sample characteristics. It should be acknowledged that the findings presented in the following sections are of exploratory nature and require further validation by future work.
2.2. Instruments and analyses
The participants filled out an online survey composed of a demographic information form and Causal Dimension Scale-II (CDSII; McAuley et al., 1992). The demographic form included a combination of open-ended and multiple-choice questions regarding age, gender, education level, income level, driver status, and so on. The CDSII is a 12-item questionnaire rated on a 9-point Likert type scale. It is a self-report measure assessing how individuals evaluate the causes of events in terms of various dimensions (i.e. locus of causality, personal control, external control, and stability). The event, of which the cause is evaluated can be modified based on the purposes of the research. The scale is composed of 4 subscales and 3 items per subscale, namely locus of causality, personal control, external control, and stability. However, Fındık et al. (2023) found that the 3-factor solution was appropriate for the scale in the traffic context. For this reason, the 3-factor structure is used in this study. The CDSII was filled out twice by the respondents: once for the riskiest and once again for the safest situations experienced as a pedestrian. In the qualitative part, respondents were asked to define the situations, in which they feel at risk/safe the most and then asked to define the most important reason for feeling so. In the quantitative part, they evaluated the reason they provided on 3 dimensions: personal control, external control, and stability. The qualitative and the quantitative questions in the scale are presented in Table 1.
| Qualitative Part | |
|---|---|
| Risky Situation and Reason | Safe Situation and Reason |
| As a pedestrian, what is the most risky situation/task in traffic? | As a pedestrian, what is the safest situation/task in traffic? |
| What is the most important reason for this situation/task being risky for pedestrians? | What is the most important reason for this situation/task being safe for pedestrians? |
| Quantitative Part Is this cause something: |
|
| Personal Control Items | |
| That reflects an aspect of the situation - 1 | 9 - That reflects an aspect of yourself |
| Not manageable by you - 1 | 9 - Manageable by you |
| You cannot regulate - 1 | 9 - You can regulate |
| Outside of you - 1 | 9 - Onside of you |
| Something about others - 1 | 9 - Something about you |
| Over which you have no power - 1 | 9 - Over which you have power |
| External Control Items | |
| Over which others have no control - 1 | 9 - Over which others have control |
| Not under the power of other people - 1 | 9 - Under the power of other people |
| Other people cannot regulate - 1 | 9 - Other people can regulate |
| Stability Items | |
| Temporary - 1 | 9 - Permanent |
| Variable over time - 1 | 9 - Stable over time |
| Changeable - 1 | 9 - Unchangeable |
Qualitative and quantitative parts of the CDSII were analysed separately. In the qualitative part, similar responses to the 4 questions (i.e. what is the riskiest situation, why it feels risky, what is the safest situation, why it feels safe) were grouped together to form the initial codes by the researchers. For instance, responses such as “crosswalks” and “pedestrian crossings” were combined into a single “crosswalks” code in the initial coding phase. In other words, responses were combined based on their simple semantic meanings. Later, these initial codes were grouped together again to form final codes. In forming the final codes, participants’ responses were combined based on a reflection of what makes that situation or reason risky or safe. For instance, “lack of a countdown” and “lack of crosswalks” were both assumed to reflect lack of some sort of signalization, which is thought to be the common element missing in both responses.
The quantitative part was analysed by using the Statistical Package for the Social Sciences software (SPSS v.28). Frequencies of these initial and final codes were calculated. To match the situations with reasons, crosstabs were prepared. In the quantitative part, mean scores of personal control, external control, and stability were calculated. Paired-samples t-tests were conducted to examine the mean differences in risky/safe pairs of the 3 dimensions. Also, a set of one-way analysis of variance (ANOVA) were conducted to investigate potential differences in causal attributions in different levels of demographic factors (i.e. gender, socioeconomic level, and driver status).
The choice of CDSII as the main measurement tool had several implications on both qualitative and quantitative analyses. Since the tool requires the participants to define a situation (in this case, risky and safe situations as a pedestrian), a variety of conditions were mentioned as “the riskiest” and “the safest” situations. As a result, each participant rated the quantitative part based on different situations. Although this seems to yield heterogeneity in the qualitative responses and corresponding quantitative evaluations, it should be noted that the quantitative evaluations were still homogeneous in terms of being perceived as “the riskiest” and “the safest” situation by each participant himself/herself. In that sense, it can be claimed that the scale takes individual differences in perceived risk of specific events into account. The same applies to the reasons of these situations: reasons are attributed to different events, all of which are associated with the events consisting extreme risk and safety. A valid criticism might be associated with the evaluation of extreme risk and safety. Specifically, causal evaluations as assessed by CDSII solely focus on extreme situations and disregards less extreme situations. Hence, causal evaluations regarding less risky and safe situations remain unexamined. Analyses were also subject to the limitations regarding sample characteristics mentioned in the previous section.
3. Results
In the first step, the four qualitative questions of the CDSII were qualitatively analysed. These questions were: “As a pedestrian, what is the situation you feel at highest risk in traffic?”, “What do you think is the most important reason that you feel at risk in this situation?”, “As a pedestrian, what is the situation you feel the safest?”, and “What do you think is the most important reason that you feel safe in this situation?”. In the initial coding phase, similar answers were grouped together for each question separately (see Table 2). Later, a second grouping was made to form final codes and assign numerical values. Numerical values were assigned as new groups emerged, hence they were not based on any logical rule. Frequencies and percentages were then calculated for final codes and crosstabs were formed.
| Final Code | Initial Codes |
|---|---|
| Riskiest Situation | |
| encountering problematic drivers | motorcyclists (1), obstruction in view (3), overtaking (1), public transport drivers (1), drivers violating rules (31) |
| encountering problematic pedestrians | pedestrians violating rules (5) |
| crossing the signalized roads | crosswalks (30), traffic lights (12) |
| crossing the unsignalized roads | no countdown (1), no crosswalk (9), crossing unsignalized roads (35) |
| turns/ roundabouts | roundabouts (11), turns (17) |
| crossing the road | crossing the road (60) |
| flow characteristics | dense traffic (7), high-speed traffic (2), highways (4), urban areas (1), pavements (1), public transport stops (1), seaside (1), streets (3), oncoming traffic (2), wide roads/narrow roads without pavement (5) |
| weather/ road conditions | night (2), slippery pavements (1) |
| other situations | other (7) |
| Riskiest Reason | |
| problematic drivers | careless drivers (49), drivers (14), rule breaking drivers (37), speeding (16) |
| problematic road users | indecisive people (1), low attention (9), rule breaking (10), rushing people (6) |
| poor infrastructure | poor design (6), poor enforcement (1), poor signalization (1), traffic jam (2), light breakdown (1), long wait (1), no underpass/overpass (4), no crosswalk (2), no lights (6), no pavement (1), no safe zone (4) |
| problematic pedestrians | jumping on road (4), unsafe pedestrians (3) |
| low controllability | abrupt maneuvers (2), dependent on drivers’ decision (5), low control (5), stress (1), unpredictable (12) |
| traffic culture | low education (4), no trust in driver (3), traffic culture not established (3) |
| increased crash risk | high crash probability (13), oncoming traffic (3) |
| high traffic flow | crowded (2), high density traffic (9) |
| low visibility | low visibility (5) |
| other reasons | falling (1), other (8) |
| Safest Situation | |
| being separated from vehicles | underpasses/overpasses (58), carparks (1), far from road (6), no vehicle zone (12), being passenger (3), pavements (52) |
| regulated/ enforced crossings | crossing at light (40), crossing at speed bump (1), crosswalk (14), fines (1), police presence (6), regulated area (2) |
| road users displaying safe/ positive behaviors | when all obey rules (4), high road user awareness (1), when drivers obey rules (5), eye contact with driver (1), mutual respect (2), drivers signaling (1) |
| low vehicle density areas | campus (9), low density traffic (12), low speed area (4), night (1), small town (1), street (4) |
| high pedestrian density areas | crowded area (5), public transport stops (1) |
| none | no safe situation (4) |
| other situations | high traffic density (1), high socioeconomic status region (1), other (1) |
| Safest Reason | |
| elimination of crash risk | car cannot crash (109) |
| safe road user behaviors | high attention by drivers (7), drivers obeying rules generally (18), everyone obeying the rules generally (7), high attention by pedestrians (1) |
| safety culture | good communication (1), education (3), humanism (2), mutual respect (4), traffic culture (1) |
| enforcement | authority presence (2), highly controllable (7), fines stop drivers (15), predictable (3) |
| decrease in crash risk | less mistakes (3), less crash risk (28), low speed (2), pedestrian priority (4), protected area (15), no secondary tasks (1) |
| pedestrian presence | crowded (7), human shield (1) |
| inevitable risk | inevitable risk (5) |
| other reasons | other (8) |
3.1. Qualitative findings
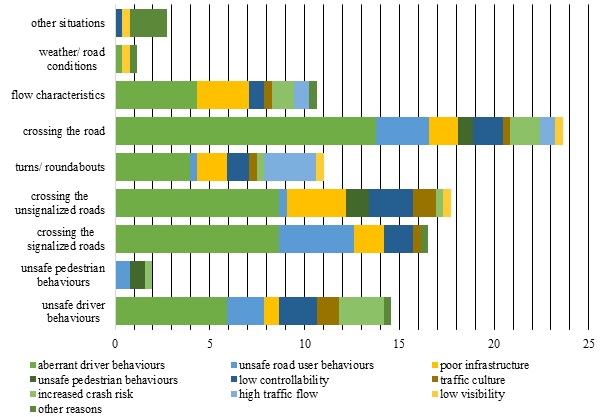
Analysis of the qualitative part of the CDSII yielded 9 final categories for the situations pedestrians felt at highest risk (see Figure 1). These were crossing the road (23.6%), crossing the unsignalized roads (17.7%), crossing the signalized roads (16.5%), unsafe driver behaviours (14.6%), turns/roundabouts (11.0%), flow characteristics (10.6%), other situations (2.8%), unsafe pedestrian behaviours (2.0%), and weather/road conditions (1.2%). In addition, 10 final categories were obtained for the reasons for feeling risk in these situations (see Figure 1). The 10 categories were aberrant driver behaviours (45.7%), poor infrastructure (11.4%), unsafe road user behaviours (10.2%), low controllability (9.8%), increased crash risk (6.3%), high traffic flow (4.3%), traffic culture (3.9%), other reasons (3.5%), unsafe pedestrian behaviours (2.8%), and low visibility (2.0%).
Crosstab of risky situations and the reasons for feeling risk are visualized in Figure 1. According to the findings, for 6 out of 9 situations in which pedestrians feel at risk, the most common reason was aberrant driver behaviours. Other than aberrant driver and road user behaviours, poor infrastructure was a prominent reason why pedestrians felt at risk, especially at varying flow characteristics (e.g. wide roads, highways, high density traffic, and so on).
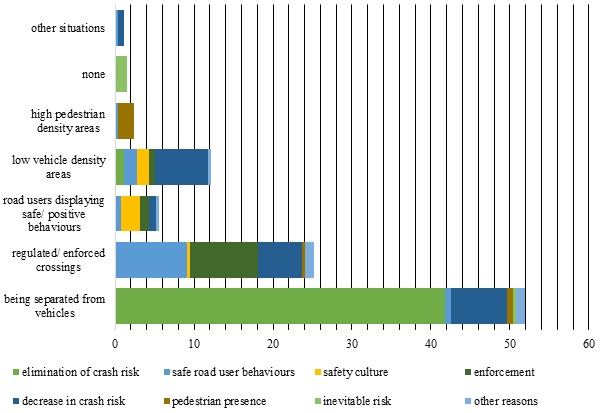
Investigation of situations, in which pedestrians feel safest yielded 7 final categories (see Figure 2). These were being separated from vehicles (52%), regulated/enforced crossings (25.2%), low vehicle density areas (12.2%), road users displaying safe/positive behaviours (5.5%), high pedestrian density areas (2.4%), none (1.6%), and other situations (1.2%). Additionally, 8 final categories were obtained for the reasons for feeling safe in these situations (see Figure 2). The 8 categories were elimination of crash risk (42.9%), decrease in crash risk (20.9%), safe road user behaviours (13.0%), enforcement (10.6%), safety culture (4.3%), pedestrian presence (3.1%), other reasons (3.1%), and inevitable risk (2.0%).
Crosstab of safe situations and the reasons for feeling safe are visualized in Figure 2. According to the findings, elimination of and decrease in crash risk were the most important reasons for feeling safe in areas separating pedestrians and drivers. It was also noteworthy that reasons for feeling safe in regulated or enforced crossings were safe road user behaviours and enforcement.
3.2. Quantitative findings
A set of paired-samples t-tests were conducted in an attempt to examine potential differences in causal dimensions in risk and safety conditions. The results of these analyses are presented in Table 3. A significant difference was found between evaluations of risky and safe situations in terms of all 3 subscales of CDSII, namely personal control, external control, and stability. Specifically, risk situations were evaluated as less personally controllable, more externally controllable, and less stable than safe situations.
| Mean | Standard Deviation | t | df | Cohen’s d | |
|---|---|---|---|---|---|
| Personal Control | -6.14* | 253 | -.39 | ||
| Risky | 2.72 | 1.66 | |||
| Safe | 3.57 | 2.03 | |||
| External Control | 6.11* | 253 | .38 | ||
| Risky | 6.97 | 1.82 | |||
| Safe | 6.02 | 2.09 | |||
| Stability | -7.24* | 253 | -.45 | ||
| Risky | 4.45 | 1.70 | |||
| Safe | 5.49 | 2.12 |
Several one-way ANOVAs were conducted to investigate if causal attributions differ by demographic variables (i.e. gender, socioeconomic level, and driver status). According to the results, personal control, external control, and stability of risky (p = .37, p = .61, p = .46, respectively) and safe (p = .99, p = .20, p = .69, respectively) situations did not differ by gender. Similarly, evaluations of personal control, external control, and stability were similar across 3 levels of socioeconomic status for both risky (p = .85, p = .99, p = .17, respectively) and safe (p = .98, p = .94, p = .29, respectively) conditions. Finally, personal control, external control, and stability of risky (p = .51, p = .45, p = .92, respectively) and safe (p = .16, p = .11, p = .70, respectively) situations did not differ among those who hold and those who do not hold a driver’s license.
4. Discussion
This study aimed to shed light on pedestrians’ evaluations of risky and safe situations in Türkiye. According to the findings, crossing the road was perceived as the riskiest situation for pedestrians. Interestingly, crossing was perceived as roughly equally risky at both signalized and unsignalized roads. The 3 final themes combined (i.e. crossing the road, crossing unsignalized roads, and crossing signalized roads), a total of 57.8% of the participants perceived road crossing as the riskiest aspect of being a pedestrian in Türkiye. It is possible for the risk associated with road crossing to increase further due to the introduction of electric vehicles. Research shows that electric vehicles have an adverse effect on pedestrian safety due to low auditory detectability (Karaaslan et al., 2018). According to recent estimations, growth rate of electric vehicle ownership will reach its peak value in approximately 20 years in Türkiye (Alatawneh & Ghunaim, 2024), which translates into more electric vehicles being on the roads soon. As a result, electric vehicles may present a future challenge in terms of pedestrian safety in Türkiye.
Regardless of the signalization status, the most commonly stated reason for crossing to be perceived as risky was driver behaviour according to pedestrians. Risk situations and causal attributions of risk point to driver-pedestrian interactions as a critical factor in Türkiye. This is supported with the official statistics: 89% of faults leading to fatality/injury accidents were driver-related in 2023 (Turkish Statistical Institute, 2024b). Moreover, Çıkrıkçı et al. (2021) reported that most common problems of Turkish pedestrians were drivers not complying with the right of way rules, honking, and non-compliance to traffic lights by drivers. Although pedestrians regarded drivers as the main source of risk in signalized crossings, they also considered poor infrastructure as a secondary reason in unsignalized crossings. This can be interpreted as despite not relying on signalization as an effective measure, they still consider it as necessary. In fact, satisfaction with infrastructure was an important element in safe behaviour in Şimşekoğlu’s (2015) study. Therefore, not only the presence, but also functioning of infrastructure can be prompting road users to behave more safely.
In line with the findings regarding risky situations, safest situations were those that separate pedestrian traffic from vehicle traffic, such as overpasses/underpasses and pavements. The results of the qualitative section indicate that current regulations such as pedestrian crossings and traffic lights are not enough to provide a sense of safety for pedestrians. Consistent with the officials’ approach on the issue (Kaygısız et al., 2015), pedestrians require strictly limited interaction with vehicle traffic in order to feel safe, which is a costly and inapplicable way of increasing pedestrian safety at all times. The most apparent reason for feeling safe in these areas was elimination of crash risk, which makes their position clear. The second safest situation was regulated/enforced crossings, such as signalized crossings, crosswalks, or places where police is present. According to participants, the reason for these places being safe was associated with safe road user behaviour and enforcement at an almost equal frequency. This can be interpreted as legal sanctions and constant monitoring prompting safe behaviour among drivers (and other road users) in those areas, which is helpful in decreasing crash risk as can be inferred from the reason for feeling safe. Hence, a powerful strategy in increasing pedestrian safety in Türkiye may focus on effective enforcement and sanctions.
Quantitative findings indicate that pedestrians perceive lower personal controllability and higher external controllability in risky situations as compared to safe conditions. This finding supports the qualitative findings, which suggest that drivers were seen as the source of risk. In a similar vein, previous research found that 44.6% of pedestrians attribute responsibility of crashes to themselves, whereas 53.4% attribute to other road users, infrastructure, or other factors (Useche & Llamazares, 2022). Moreover, the same study reported that errors, which are less personally controllable, were assigned as a cause to a greater extent when the crash is thought to be caused by the pedestrians themselves; while violations, which are more externally controllable, were assigned as a cause to a greater extent when it is thought to be caused by other road users. Lower stability of risk compared to safety points to risk situations being attributed to situational factors, such as driver behaviours. This can be caused by and changed through enforcement activities. Specifically, pedestrians may feel safer while interacting with vehicles, if they can anticipate behaviours of drivers. This can be achieved through consistent enforcement of rules in traffic, which is not at the desired status yet (Rahman, & Ture Kibar, 2022). Despite being less evident among other responses, traffic culture and safety culture terms were present in the participant answers. In time, effective enforcement and increased compliance can translate into these terms being integrated in all road users’ mindsets.
It is also noteworthy that attributions did not differ by demographic characteristics. A similar result was obtained in Çıkrıkçı et al. (2021) study: problems experienced by pedestrians did not differ by gender and driver’s license ownership. Also, Useche et al. (2021) reported that male and female pedestrians did not differ in terms of most attitudinal (e.g. risk perception, observed misbehaviours of other road users) and behavioural (e.g. violations) variables. Similar findings in previous research should still be interpreted with caution, as they do not allow for generalization of the findings. On the other hand, a number of studies report gender differences in terms of behavioural measures, specifically safer behaviour among female pedestrians as compared to male pedestrians (Bendak et al., 2021; Esmaili et al., 2021; Nikolaou et al., 2023). Yu et al. (2020) reported that not the main effect, but interaction of gender and age was significantly associated with pedestrians’ risk perception; whereas neither gender nor interaction was significantly associated with their attributions regarding responsibility of crashes. According to McIlroy et al. (2020), demographic factors such as gender were related to pedestrian attitudes to different extents across various countries in their study (i.e. Bangladesh, China, Kenya, Thailand, United Kingdom, and Vietnam) and when present, effect sizes of these relationships were small. Although pedestrians’ causal understanding of risk and safety do not seem to be directly related to their demographic characteristics, consistent gender differences in their behaviours should be considered in relation to and in interaction with other factors. In accordance with that, Useche et al. (2021) reported that predictors of aberrant behaviours were not identical for male pedestrians and female pedestrians.
The findings point out to a number of problem areas in pedestrian safety in Türkiye. However, it is “safe” to say that Türkiye is making great endeavour to achieve progress in increasing pedestrian safety. Vulnerable road users are selected as a priority area in the current official strategy plan for road safety and pedestrian deaths showed a decreasing trend between 2015-2019 (T.C. İçişleri Bakanlığı, 2021). Also, public awareness campaigns and a call for action was made by the authorities regarding pedestrians’ priority at crossings (T.C. İçişleri Bakanlığı, 2019). Interest in the topic by academicians also continue to proliferate. The findings of the current study contribute to these efforts by pinpointing the reasons why certain situations are perceived as risky, leading to an increased understanding of areas of intervention. Furthermore, considering causal attributions’ association with aberrant driver behaviours (Fındık et al., 2023), it is possible that these attributions play a role in aberrant pedestrian behaviours. In their study examining fatalism, attitudes, and behaviour among pedestrians, Dinh et al. (2020) found that increased internal locus of causality was associated with safer attitudes and behaviour. When the findings of this study are considered in combination with those of Dinh and colleagues, it can be claimed that the efforts should be aimed at changing the attributions toward a more personally controllable direction through correct interventions.
Besides these rather universal recommendations that can be made to improve pedestrian safety, taking cultural factors into account, especially regarding pedestrian safety, might be beneficial (Nordfjærn et al., 2012, 2014; Nordfjærn & Şimşekoğlu, 2013). Earlier studies found that cultural factors were able to explain added variance in risky behaviours in pedestrians (Nordfjærn & Şimşekoğlu, 2013). For instance, according to Hofstede’s cultural dimensions theory, Türkiye’s relatively high score in uncertainty avoidance suggests a strong preference for structure, stability, and predictability (The Culture Factor Group, 2025). As a result, people in Türkiye may be more inclined to avoid ambiguous situations and rely on rules, regulations, and formal procedures to reduce uncertainty. When considering pedestrian related regulations conducted in the recent years in Türkiye, it can be said that this need for rules and order could be satisfied to an extent. However, it takes time for the system as a whole to adapt to these new regulations, and for behaviour change to occur accordingly.
Being the first attempt to both qualitatively and quantitatively look into the attributions of pedestrians, the present study has allowed participants to express their experiences in the way they wish, thereby enabling them to articulate their experiences, which have emerged as a result of direct or indirect influences of the traffic culture they interact with. Additionally, it has created a foundation for generating research questions for future studies. For instance, future research, based on the results of the current one, can focus on the figured out attributions’ relationship with actual or self-reported behaviours. In addition, based on its findings, the present study can serve as a foundation for planning future research that compares different cultures and better illustrates and distinguishes the impact of individual characteristics or cultural specifics on road user behaviours.
Concerning some critical issues to discuss about this study, the sample consisted largely of younger and female participants due to sampling strategy. This creates an age and gender bias in results, which prevents them from being generalized to Turkish population. Even though studies with a more diverse sample, came to similar conclusions (Useche et al., 2021), participants with a wider range of characteristics can be included in future work to overcome this limitation. Additionally, sample size of this study was small. It is recommended to replicate the findings of this study with a larger and representative sample to increase the confidence in the results. Moreover, considering the differences in crash characteristics of urban and rural areas (Kuşkapan et al., 2019; Ozen et al., 2017), comparison studies can be made in urban and rural regions. Finally, although use of the Causal Dimension Scale-II was beneficial in conducting the quantitative group comparisons, its qualitative part limits the responses to some extent. Specifically, as part of the scale, participants are asked to indicate a risky or safe situation and then indicate why they think that specific situation is risky or safe. They are expected to name a single answer to the qualitative questions, so that they can rate the controllability and stability of that specific answer in the quantitative part. In fact, there may be other risky and safe situations that the participant may think of, yet they are not recorded. This creates a limitation of responses in the qualitative part, which may be investigated in future studies employing fully qualitative data collection and analysis methods. In addition, while answering the quantitative questions, the participants might not think of other unsafe situations, they might have experienced. Other study designs that use more elaborate situation sampling approaches, might be helpful to bridge this gap.
5. Conclusion
This study sought to explore pedestrians’ attributions about risk and safety in traffic using a mixed methods approach. Both qualitative and quantitative analyses were conducted to understand what situations were perceived as risky and safe, what were the causes of risk and safety in these situations, and how these causes were evaluated by the pedestrians.
The findings of this study highlight several points that require attention from decision-makers. One of these is the driver-pedestrian interactions. According to the findings of this study, pedestrians require strict separation from drivers in order to feel safe in traffic and regard driver behaviour as the most important reason for risky encounters. To overcome this issue, effective enforcement and well-functioning infrastructural improvements can be suggested. Although such improvements may increase feeling of safety at the exact locations the improvements are applied, it is important to maintain the safe feeling and state at all locations. That can be achieved once the rules become the norm and the traffic culture transforms into a safety-oriented one, as the participants of this study and that of Hashemiparast et al. (2017) also mentioned. One promising finding of this study was that risk was regarded as more externally controllable and less stable, which means that pedestrians consider risk as a changeable situation. Therefore, pedestrian empowerment should be targeted by regulating the external factors such as other road users and infrastructural elements.
CRediT contribution
Gizem Findik: Conceptualization, Formal analysis, Methodology, Writing—original draft. Haluk Oğuz Öngören: Conceptualization, Writing—review & editing. Bahar Öz: Conceptualization, Supervision, Writing—review & editing.
Declaration of competing interests
The authors report no competing interests.
Ethics statement
The methods for data collection in the present study have been approved by Middle East Technical University (Decision no: 0038-ODTUİAEK-2023).
Funding
No external funding was used in this research.
Declaration of generative AI use in writing
The authors declare that no generative AI was used in this work.
Editorial information
Handling editor: Mette Møller, Technical University of Denmark, Denmark
Reviewers: Xinyu Liang, Hebei University of Technology, China; Thérèse Steenberghen, KU Leuven, Belgium; Hanna Wennberg, Lund University, Sweden; Apostolos Ziakopoulos, National Technical University of Athens, Greece