Surrogate safety evaluation of incorrect pedestrian detection at signalized intersections
Guest editor: Nikiforos Stamatiadis, University of Kentucky, the United States of America
Reviewers: Christopher Monsere, Portland State University, the United States of America
Apostolos Anagnostopoulos, Aristotle University of Thessaloniki, Greece
Received: 29 May 2024; Accepted: 9 November 2024; Published: 17 December 2024
Abstract
The design and operations of signalized intersections are critical for the safety and mobility of all road users. Traditionally, video detection systems have surpassed conventional inductive loops in vehicle detection, offering advantages such as user-friendly interfaces, easy installation, versatile applications, and cost-effective maintenance. Recent technological advancements have expanded the capabilities of video detection systems to include automated pedestrian detection. Pedestrian timing treatment at signalized intersections typically involves two approaches: assuming pedestrian demand during each phase (pedestrian recall operations) or activating pedestrian demand when a button is pressed. Automated Pedestrian Video Detection Systems (APVDS) represent a newer approach where pedestrian calls are automatically initiated upon detecting pedestrians within the detection zone. Both pedestrian push buttons and APVDSs have their pros and cons. While push buttons can cause confusion and incorrect usage among pedestrians, APVDSs theoretically address these issues by autonomously determining pedestrian phase needs. However, challenges arise due to differing pedestrian behaviors compared to vehicles, potentially leading to missed or false calls and unsafe pedestrian actions. This study examines the impact of two APVDS issues: missed pedestrian calls and false pedestrian calls. It also compares the effects of incorrect calls under various operational strategies, including APVDS with and without controller pedestrian recycle, pedestrian recall operations, and push-button operations, with and without pedestrian recycle, across different times of the day to replicate varying vehicular and pedestrian demands. Using Vissim microsimulation software and Surrogate Safety Assessment Model (SSAM), experiments were conducted to replicate field conditions closely. This microsimulation approach enables the measurement and analysis of missed and false calls' impact on surrogate safety measures, providing valuable insights challenging to obtain in real-world conditions. The results contribute to pedestrian traffic signal strategies and enhancing pedestrian safety at signalized intersections in urban environments.
Keywords
detection, pedestrians, surrogate measures of safety (SMoS), traffic signals
Introduction
Signalized intersections play a vital role in urban transportation systems by ensuring the safe and efficient movement of both pedestrians and vehicles. Thus, the design and operations of signalized intersections are crucial for safety and mobility of all users. Traditionally, pedestrian signal operations have followed two methods: either automatically recalling pedestrian demand during each phase, assuming constant pedestrian presence, or requiring pedestrians to press a push button to activate a pedestrian phase. Recently, automated pedestrian video detection systems (APVDSs) have been introduced, which replaces the need for push buttons by automatically detecting pedestrians in designated zones and placing the necessary phase call.
APVDSs use strategically placed overhead cameras to capture images of pedestrians at intersections. These images are then analyzed using advanced vision processors and machine learning algorithms, which identify pedestrians within virtual detection zones. This automated system provides significant data about detected pedestrians, yet its accuracy can be influenced by factors such as the quality of the machine learning algorithms, lighting conditions, weather, and camera placement.
As is common with most signal technology, both pedestrian push buttons and APVDSs have their advantages and disadvantages. Push buttons may cause confusion among pedestrians, resulting in incorrect usage and jaywalking. APVDSs theoretically address these issues by determining the need for a pedestrian phase without requiring pedestrians to press the push button. However, challenges arise because pedestrians exhibit different behaviors compared to vehicles, and missed calls can lead to unsafe pedestrian behaviors. For instance, vehicles are always oriented in the direction of travel, whereas pedestrians do not always wait to cross oriented towards the crosswalk of interest.
It is worth mentioning that initially video detection systems were primarily developed for vehicle detection and have been the subject of extensive research so far. Despite technological advancements, these systems still face challenges in adverse weather and low-light conditions. While many studies have examined the performance of video detection systems for vehicles (Chitturi et al., 2010; Grenard et al., 2001; Martin et al., 2004; Medina et al., 2008; Medina et al., 2009; Rhodes et al., 2005), there has been less focus on the accuracy issues associated with APVDSs for pedestrians (Larson et al., 2020). Research has generally evaluated APVDS performance (Gavric et al., 2024; Gavric et al., 2024).
Wu et al. simulated vehicle-pedestrian conflicts in Vissim to examine whether SSAM and Vissim can effectively estimate field conflicts at signalized intersections Wu et al. (2018). While there is extensive research investigating pedestrian-vehicle conflicts in microsimulation, no study has thoroughly quantified the impact of false or missed pedestrian video detection calls on surrogate safety measures.
To address this gap, our study proposes a novel approach to analyzing the effects of missed and false pedestrian calls on surrogate safety in a microsimulation environment. Understanding these impacts is critical for enhancing the safety of traffic signal operations and urban planning process. This research aims to explore the consequences of missed pedestrian calls (where a pedestrian is present but not detected) and false pedestrian calls (where a phase call is placed without a pedestrian being present) on surrogate safety at signalized intersections.
Specifically, our objectives include comparing the effects of missed and false calls in automated pedestrian detection, pedestrian recall operations, and push button operations, with or without the pedestrian recycle feature of the controller, at various times of the day and under different pedestrian and vehicular demands on surrogate safety measures. A microsimulation software Vissim is coupled with Surrogate Safety Assessment Model (SSAM) to conduct experiments, allowing us to measure and analyze the impact of these events in a controlled environment that closely replicates real-world conditions.
The remainder of this paper is structured as follows: first, describe our methodology, including data collection, microsimulation setup, and experimental procedures. We then present and discuss our experimental results in detail. Finally, we conclude with remarks and suggestions for future research opportunities.
Methodology
To achieve the objectives outlined in the introduction, a framework consisting of Vissim, video detection inaccuracies, and SSAM was created.
Common pedestrian timing treatments
As mentioned previously and shown below in Figure 1, we examine five pedestrian signal treatments in terms of surrogate safety.
Firstly, APVDS can be integrated with pedestrian recycle (APVDS_PR) settings when the walk and flashing don't walk times are shorter than the maximum green time for the corresponding phase. The pedestrian recycle setting allows the pedestrian interval of a phase to begin after the green light for the concurrent vehicular phase has started, provided the pedestrian clearance times can still be fully accommodated (NCHRP, 2022) . In Traffic Signal Control Strategies for Pedestrians and Bicyclists NCHRP report (NCHRP, 2022) it is advisable to couple pedestrian recycle with ‘force coord pedestrian yield option’. In that way, the pedestrian phase will be served again only if there is a vehicular call on the coordinated phase that causes the coordinated phase to be extended. This setup ensures that the pedestrian phase is served again only if a vehicular call on the coordinated phase extends the coordinated phase. However, it is important to note that the intersections examined in this study were not coordinated, so the ‘force coord pedestrian yield option’ will not be included in our analysis.
Conversely, the APVDS without pedestrian recycle (APVDS_NPR), as also shown in Figure 1, does not serve pedestrians who arrive late, making them wait until the next cycle or relevant phase.
The third pedestrian timing treatment involves push buttons coupled with a pedestrian recycle feature (PB_PR), where pedestrians are only served if they press the button to request the service. In many cases, pedestrians fail to press the button immediately upon arrival at the intersection, resulting in longer waiting times than necessary, but in this study, we assume that all pedestrians in push button scenarios will press the push button as soon as they arrive at the intersection.
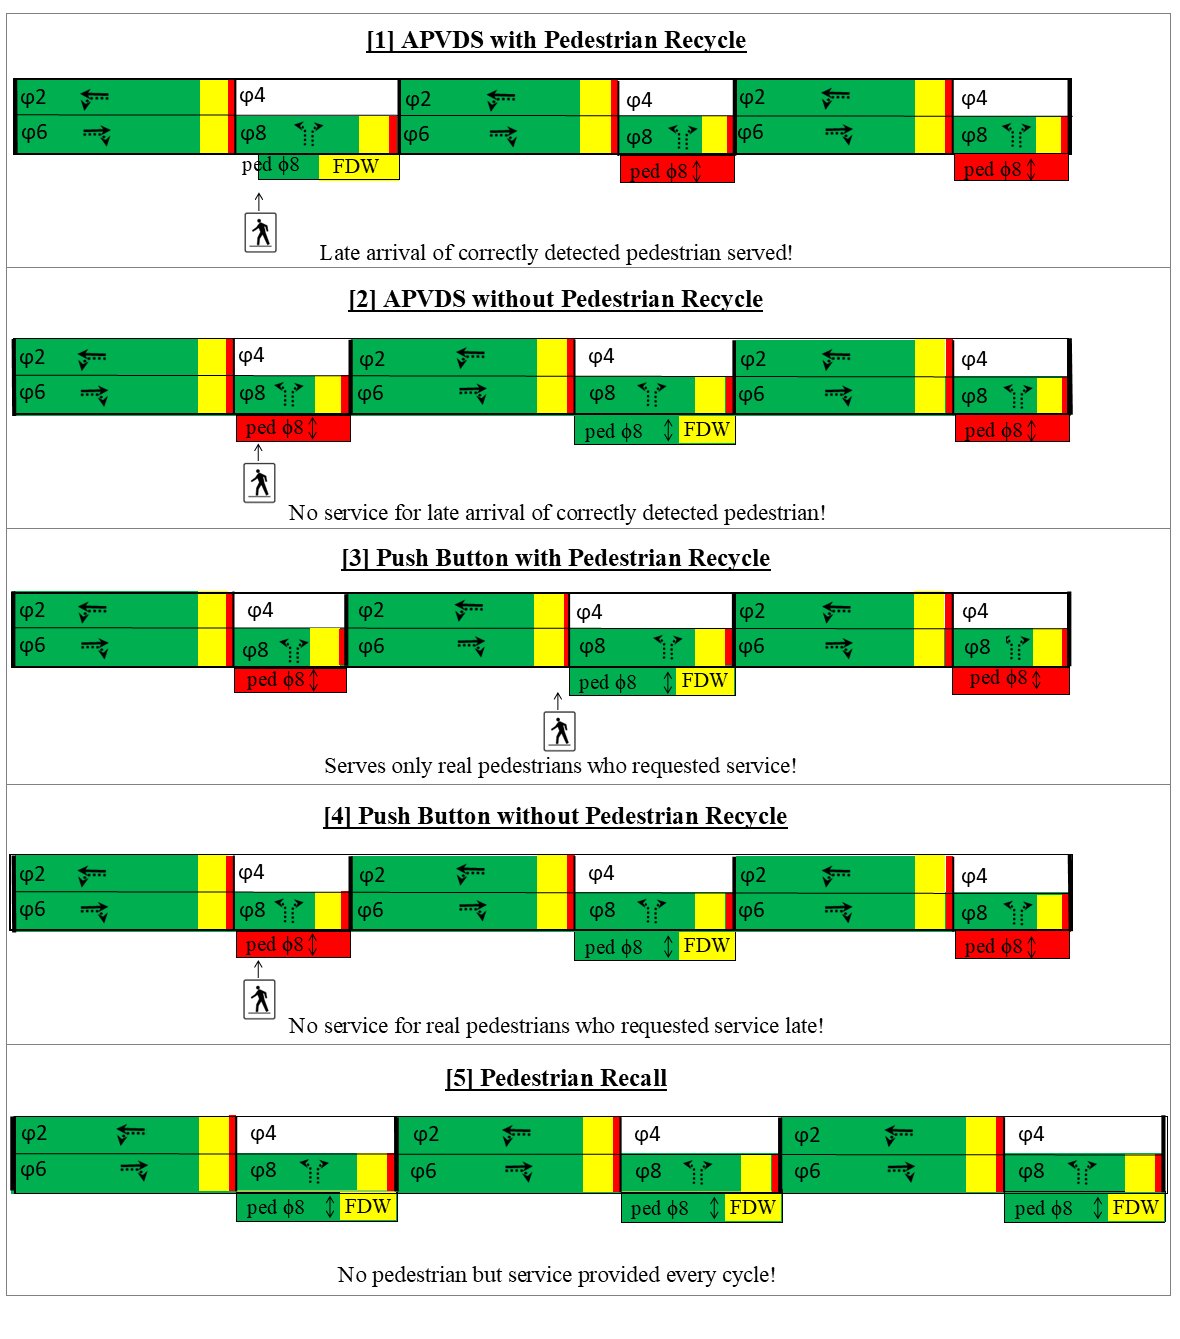
The fourth treatment involves pedestrian push buttons without pedestrian recycling (PB_NPR). Thus, pedestrians will be served only if they press the push button before the start of the concurrent phase.
The fifth treatment is pedestrian recall (Recall), which means that pedestrians will be served in each cycle regardless of actual pedestrian demand.
Data collection
Besides investigating various pedestrian timing treatments, the novelty of this study lies in its aim to analyze two APVD systems to ascertain any significant differences in their surrogate safety performances. To achieve this goal, the authors collected pedestrian video detection data from two intersections located in Pittsburgh, PA.
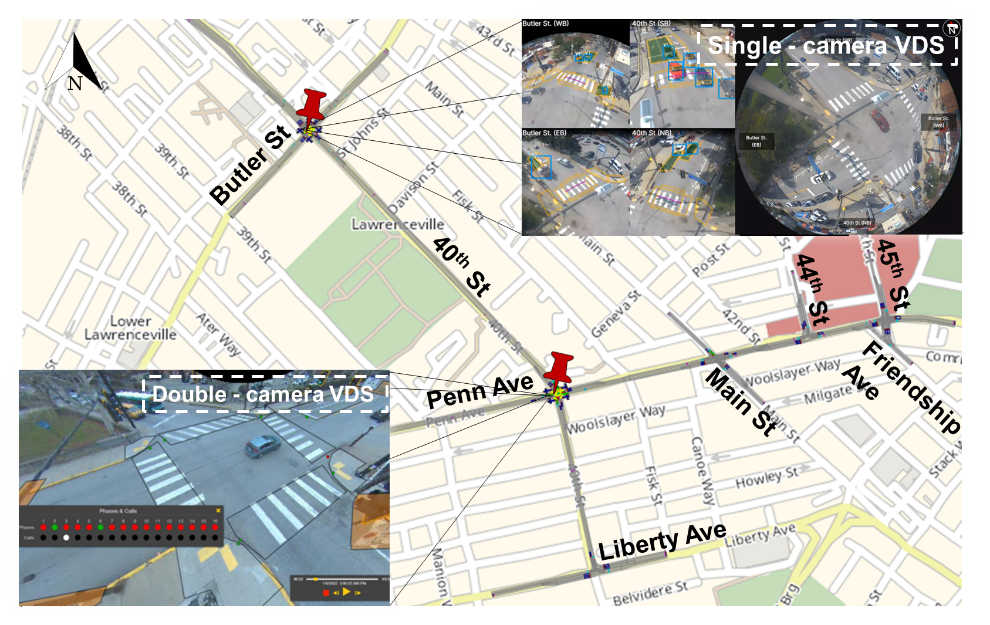
These intersections feature two distinct video detection systems. The first system, situated at Butler and 40th Street, utilizes a single fisheye camera. The second system, located at Penn Avenue and 40th Street, employs two cameras to detect both vehicles and pedestrians. Pedestrian operations recorded on video between May and November 2022 were analyzed as part of this study. For Penn/40th system, data collection required on-site visits to install a hard drive inside the signal controller cabinet. In contrast, Butler/40th videos were accessed by downloading the necessary files from the vendor's online platform. Following the collection of a comprehensive dataset, a randomly selected subset of video data spanning 20 hours was utilized for subsequent analysis. Within this 20 hour subset, pedestrian calls were classified as correct, missed, or false calls through manual observation of vendors' videos by the authors. A summary of the gathered data is presented in Table 1 below. It is important to note that (Larson et al., 2020) also found low accuracy (~25% correct calls) when testing the system installed at Butler/40th. Their study demonstrated that thermal sensors provided higher accuracy at the intersection.
|
Intersection |
Observed corner |
% Correct calls |
% Missed calls |
% False calls |
Total analyzed hours |
Total number of pPedestrian Calls |
|---|---|---|---|---|---|---|
|
Butler/40th |
N-E |
40.8 |
3.0 |
56.2 |
20h |
2091 |
|
S-E |
41.3 |
4.7 |
54.0 |
1624 |
||
|
N-W |
38.5 |
3.4 |
58.1 |
2327 |
||
|
S-W |
37.0 |
17.8 |
45.1 |
1617 |
||
|
Average |
39.4 |
6.6 |
54.0 |
Total: 7659 |
||
|
Penn/40th |
N-E |
32.9 |
56.5 |
10.8 |
20h |
260 |
|
S-E |
29.8 |
68.8 |
1.4 |
215 |
||
|
N-W |
26.7 |
54.0 |
19.3 |
176 |
||
|
S-W |
13.9 |
78.0 |
8.2 |
195 |
||
|
Average |
26.4 |
64.0 |
9.6 |
Total: 846 |
The authors observed that false and missed calls originate from system limitations in interpreting pedestrian presence and behavior. At Penn/40th, missed calls occur when pedestrians move out of the detection zone, as the system assumes they remain stationary. Conversely, at Butler/40th, the system is more sensitive and prone to false detections, triggered by factors like vehicle turns, bicyclists, shadows, and reflections.
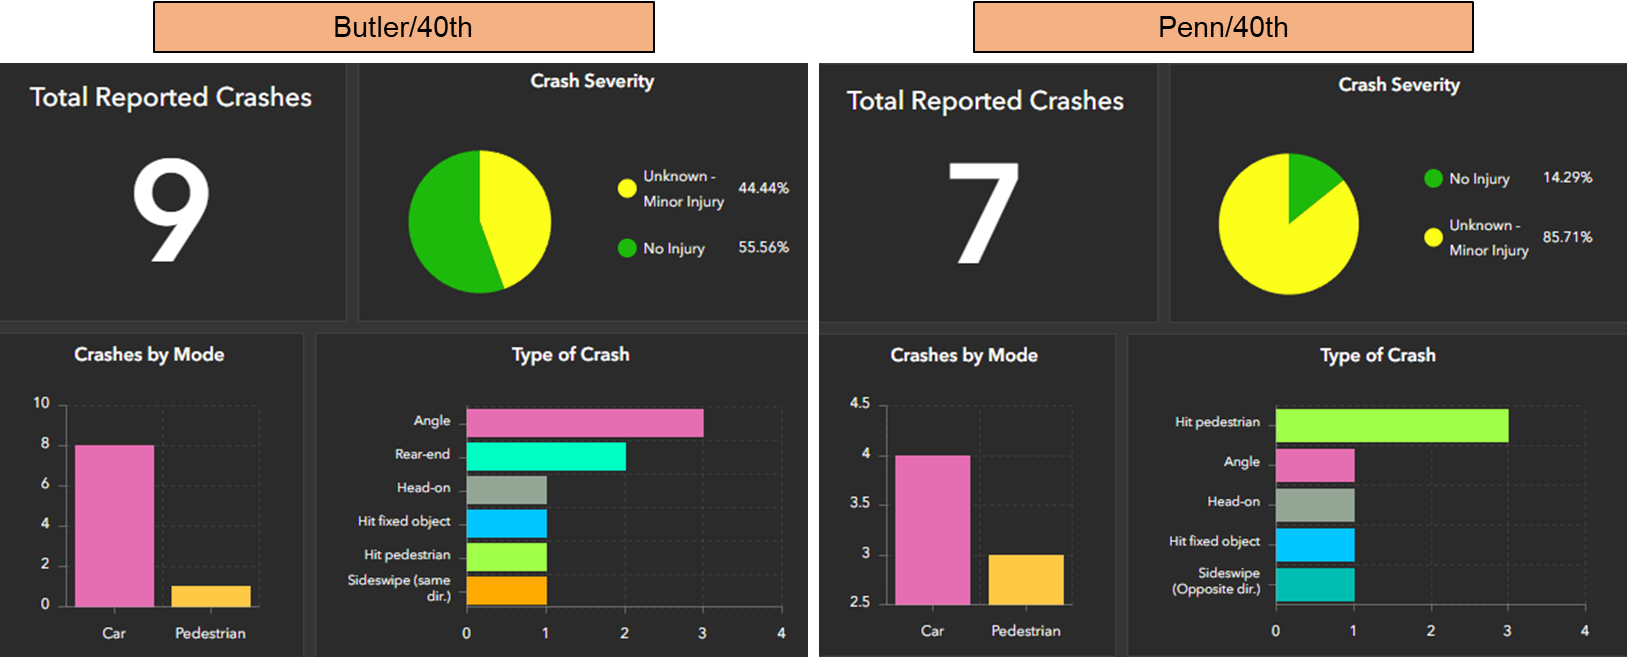
The authors also investigated the number of crashes at these intersections over the last three years (2021-2023), and it appears that both intersections had crashes involving pedestrians (Figure 2). Therefore, it is crucial to test automated pedestrian detection technologies in terms of safety before deploying them in the field, given the historical crashes involving pedestrians at these locations.
Microsimulation model
To model missed and false calls of different APVDS, Vissim, as a well-known microscopic traffic simulation tool, is employed. It operates on a time-step and behavior-based framework designed to emulate traffic patterns. The simulation relies on a psychophysical car-following model derived from the Wiedemann model, which assumes that a driver can exhibit one of four driving behaviors: free driving, approaching, following, and braking.
To assess the safety implications of APVDS accuracy and other pedestrian timing treatments, the authors constructed a Vissim model encompassing six intersections, meticulously designed to mirror real-world conditions (see Figure 3). Notably, this study concentrates on two intersections within the model, while the remaining intersections serve a supportive role in generating more authentic traffic arrival patterns and enhancing the overall validity of the simulation environment. Furthermore, to ensure unbiased results, all scenarios were simulated using identical network geometry and traffic parameters. Speeds in the simulation correspond to actual field speeds, with the speed limit set at the 85th percentile of observed speeds. Regarding pedestrian movements, we adhered to the MUTCD standard, using a pedestrian speed of 3.5 ft/s. In this study, we did not modify the default Wiedemann model parameters for driving behavior because the default parameters are widely accepted in traffic simulation studies. Also, we did not attempt to calibrate any driving behavior-related parameters, and the microsimulation model was successfully calibrated using the default car-following model parameters.
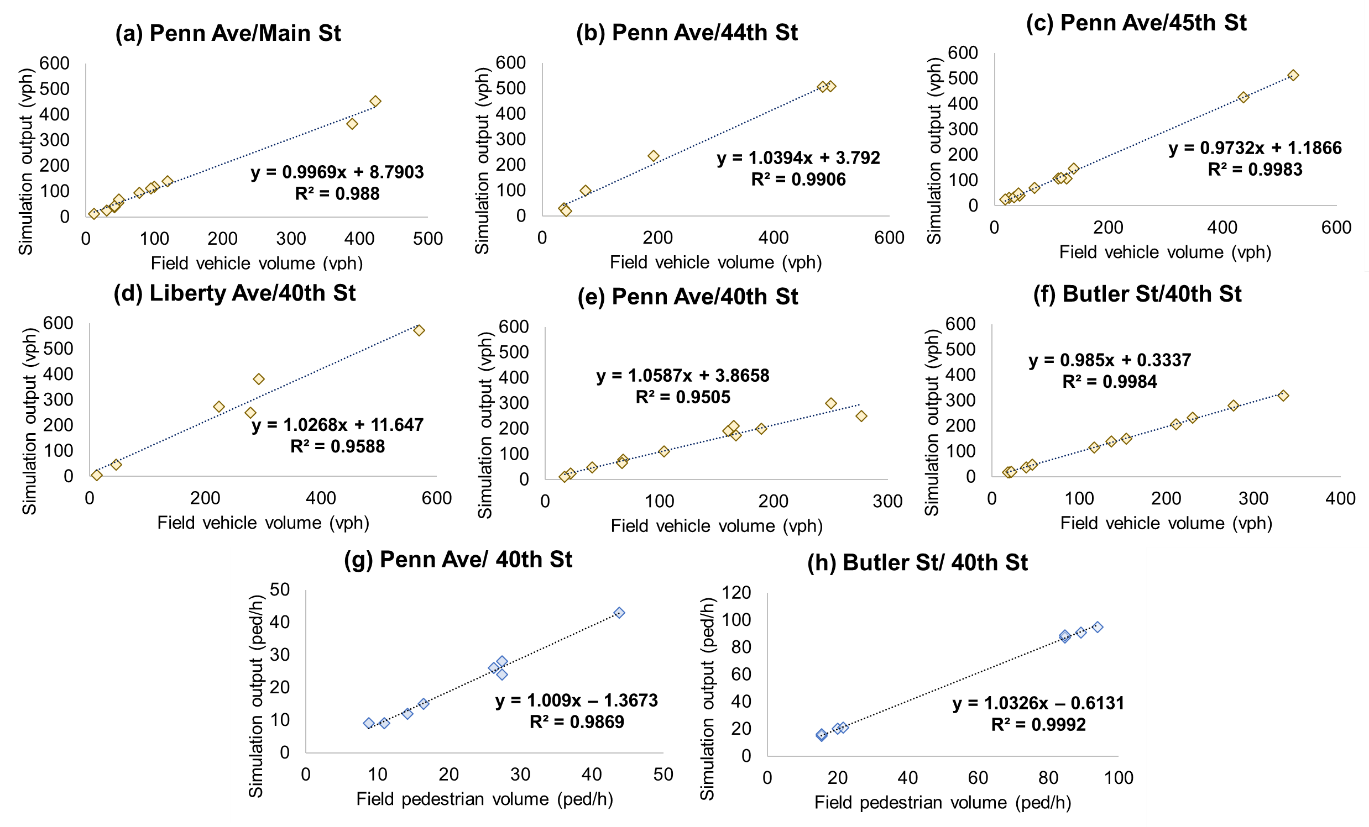
The Vissim simulation model of the analyzed network has been properly calibrated and validated (Figure 4). The turning movement counts calibration for each intersection, for both vehicular and pedestrian demand is shown in Figure 4. The model was further calibrated by using the GEH statistic, which compared the input volumes from the field to the output volumes generated by running the simulation. The GEH statistic consistently remained below four (a recommended threshold value (Silgu et al., 2022) for all movements at every intersection.
As previously indicated, the second phase of the methodology entailed gathering field data and evaluating the accuracy of two APVDSs. Following this, pedestrian calls were categorized, and vehicle volumes were recorded for various scenarios. These pedestrian calls and vehicular data were then inputted into Vissim for further analysis.
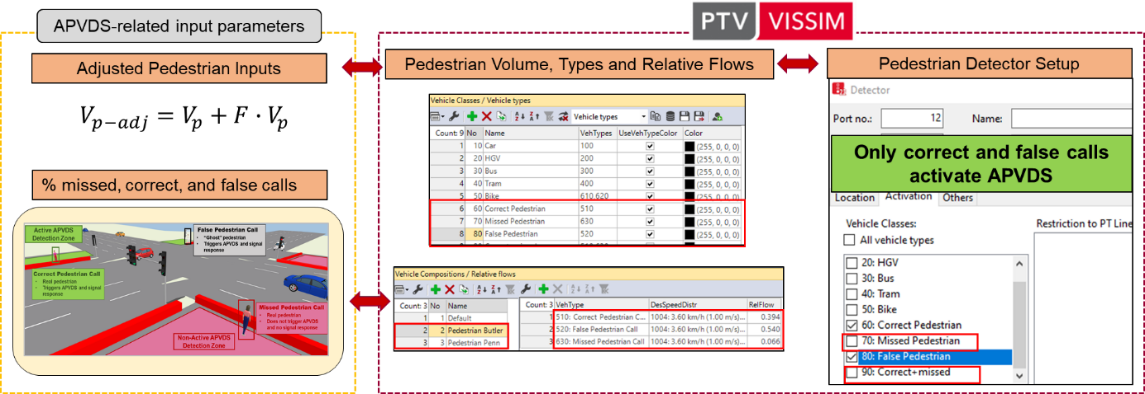
Figure 5 displays the three pedestrian classes defined within Vissim, designated as follows: 1. Correct pedestrian calls, 2. False pedestrian calls, and 3. Missed calls. Subsequently, within the vehicle compositions or relative traffic flows, the average percentage of each type of pedestrian call was delineated within the respective flow category (see Figure 5). Given the differing average percentages of correct, false, and missed calls for the two analyzed APVDSs, distinct relative flow categories were established: one for the each APVDS (see Figure 5). It is essential to acknowledge that false or ‘ghost’ pedestrians are video ‘events’ typically triggered by permanent objects, reflections, or shadows. Hence, when allocating pedestrian volumes to each pedestrian crosswalk, the field volumes (Vp-adj) were adjusted to account for the proportion of false calls (F), as illustrated in Figure 5. Put simply, false pedestrians were incorporated as additional pedestrians that would not undergo subsequent evaluation.
Surrogate Safety Assessment Model
The Surrogate Safety Assessment Model was developed to estimate frequency and severity of various types of conflicts by utilizing simulated trajectories (Gettman & Head, 2003). SSAM is well-established tool used in many studies (Gettman & Head, 2003; Stevanovic et al., 2015). Two key parameters utilized by the model are Post-Encroachment Time (PET) and Time-to-Collision (TTC). Post-Encroachment Time measures the minimum interval between when one vehicle leaves a conflict point and another vehicle arrives at the same point. If PET values fall below the default threshold in SSAM, there is a potential risk of collisions. Figure 6 illustrates the details of PET and TTC.
Time-to-Collision (TTC) represents the minimum time remaining before two vehicles collide if they continue on their current paths and maintain their speeds. Similarly, when TTC values are below the default threshold in SSAM, there is a heightened risk of collisions. It is worth mentioning that SSAM uses default values of 1.5 seconds and 5 seconds for TTC and PET, respectively. These values were found to be the thresholds that provide the highest risk safety analysis through SSAM (Alzoubaidi et al., 2023; Gettman et al., 2008). Thus, these were the thresholds used by the authors in this study.

Experimental setup
Many scenarios could have been created to evaluate the impact of APVDSs' accuracy on surrogate safety. However, the authors have focused on three major criteria shown in Figure 7. It should be mentioned that in the push-button scenarios, it is assumed that every pedestrian arriving at the intersection will press the push button; therefore, there is not any missed calls. On the other hand, pedestrian recall serves pedestrians once every cycle regardless of their physical presence at the intersections.

Twenty scenarios (5 pedestrian treatments × 2 vehicle demand periods × 2 VDS types) were prepared and tested (Figure 7 ). Each of the scenarios was run with five different random seeds to obtain statistically valid representations of the results. All simulation runs were executed with a 10 Hz simulation resolution for one hour (evaluation time) and five minutes (warm-up time). Trajectory files (.trj) were exported from Vissim and processed in SSAM to estimate surrogate safety measures. The trajectories related to pedestrian and vehicle conflicts were filtered in SSAM software based on the intersection they belong to.
To ensure accuracy and robustness in the analysis, various metrics were considered. These included the number of conflicts, as well as the time-to-collision (TTC) and post-encroachment time (PET). Additionally, the simulations were designed to account for different traffic volumes and pedestrian demand to reflect real-world conditions accurately.
Results and Discussion
The evaluation was conducted using some of the surrogate safety measures (number of conflicts, TTC, PET) and some well established performance metrics such as average pedestrian delay for overall pedestrians (correct and missed) and missed pedestrians.
On the left side of Figure 8 , the average total number of vehicle-pedestrian conflicts is presented, along with average number of right and left turnig vehicle conflicts with pedestrians. It is evident that the lowest conflicts occur with the Recall treatment at Butler/40th, an intersection equipped with VDS that generates many false calls. Conversely, at intersections with overall lower pedestrian demand and more missed calls, the APVDS treatments perform better in terms of conflict mitigation. The average number of conflicts we reported specifically refers to vehicle-pedestrian conflicts.
Another reason pedestrian recall and PB_NPR yield the best results is because, in our simulation, the pedestrian green phase does not extend for the full duration of the maximum green for the concurrent vehicle phase. Consequently, some vehicles turn without being stopped due to pedestrian presence. In scenarios with pedestrian recycle, the flashing ‘don't walk’ interval can occur twice with shorter walk times. However, it is important to note that the absence of conflicts in simulation does not guarantee that pedestrians would not jaywalk in reality. Simulated environments, while useful for controlled analysis, cannot fully capture the complex behaviors and decision-making processes of pedestrians in real-world settings.
Additionally, pedestrian volumes at the studied locations should be considered: approximately 20 pedestrians per hour at Penn and 40 pedestrians per hour at Butler. Given these volumes, the occurrence of 3-7 conflicts per number of pedestrians crossing seems significant. The conflicts include both crossing conflicts involving right-turning vehicles and pedestrians, as well as permissive left turns where applicable (Figure 8).

On the right side of Figure 8 , the maximum speed during conflicts is shown. This represents the highest speed of either vehicle throughout the conflict (i.e. while the TTC is below the specified threshold). It can be observed that the highest maximum speed occurs at Butler/40th in the PB_PR scenario, closely followed by the PB_NPR scenario. At Penn/40th, the APVDS_NPR and APVDS_PR scenarios exhibit the highest maximum speeds, making them the less safe in terms of conflict speed.
For instance, when we examine pedestrian delay for missed and overall pedestrians at the Penn/40th intersection (see Figure 9), we observe delays exceeding 100 seconds. Such significant delays are concerning because, according to both the HCM 2000 and the NCHRP Guide to Pedestrian Analysis from 2022, delays of this magnitude suggest a high likelihood of pedestrians resorting to jaywalking (Reilly, 1997; Ryus et al., 2022) (Table 2). In real-world scenarios, pedestrians facing long wait times might become impatient and choose to cross the street unsafely, increasing the risk of accidents.
|
LOS |
Control delay |
Likelihood of non-compliance |
|---|---|---|
|
A |
0–10 |
Low |
|
B |
10–20 |
Low |
|
C |
20–30 |
Moderate |
|
D |
30–40 |
Moderate |
|
E |
40–60 |
High |
|
F |
>60 |
Very high |
To fully understand the impacts of APVDS on surrogate safety, it is important to also consider the delays experienced due to missed pedestrian calls. These missed pedestrians occur only in APVDS scenarios, as it is assumed that all pedestrians press the push button in PB scenarios (Figure 9). The delay for missed pedestrians is high in the APVDS scenarios, exceeding 150 seconds at the Penn/40th intersection (as shown in Figure 9). Understandably, this delay is considerably lower at the Butler/40th intersection, where the system has a lower rate of missed pedestrian calls. Consequently, the overall pedestrian delay is comparable across all pedestrian signal treatments at the Butler/40th intersection.

Before delving into the PET and TTC results, it is important to note that the orange ‘X’ symbol in Figure 10 and Figure 11 represents the mode, while the blue circle represents the median for each scenario. It can be observed that the mode and median values are generally similar for both TTC and PET. When the mode (the most frequent value) and the median (the central value) are close or similar, this typically suggests that the dataset is not heavily skewed to one side (left or right). This may indicate that the data is normally distributed or, at the very least, roughly symmetric.
Figure 10 shows average TTC in seconds across different scenarios. At both intersections, TTC values generally tend to be lower during peak traffic demands compared to off-peak, indicating that collisions are more likely during busier times.
At Butler/40th, the APVDS_NPR and APVDS_PR treatments have higher TTC values during off-peak hours. The PB_NPR treatment shows the lowest TTC during off-peak hours, indicating higher collision risk compared to other treatments. During peak hours, the Recall treatment shows the highest TTC, while APVDS_PR has the lowest, indicating varied effectiveness based on traffic volume. The relatively low performance of PB_NPR during off-peak hours at Butler/40th is notable and warrants further investigation.
At Penn/40th, Recall treatment also exhibits high TTC values during off-peak hours, similar to Butler/40th, indicating consistent performance across different locations. The high TTC of Recall treatment across both intersections and traffic demands suggests it is particularly effective and reliable.
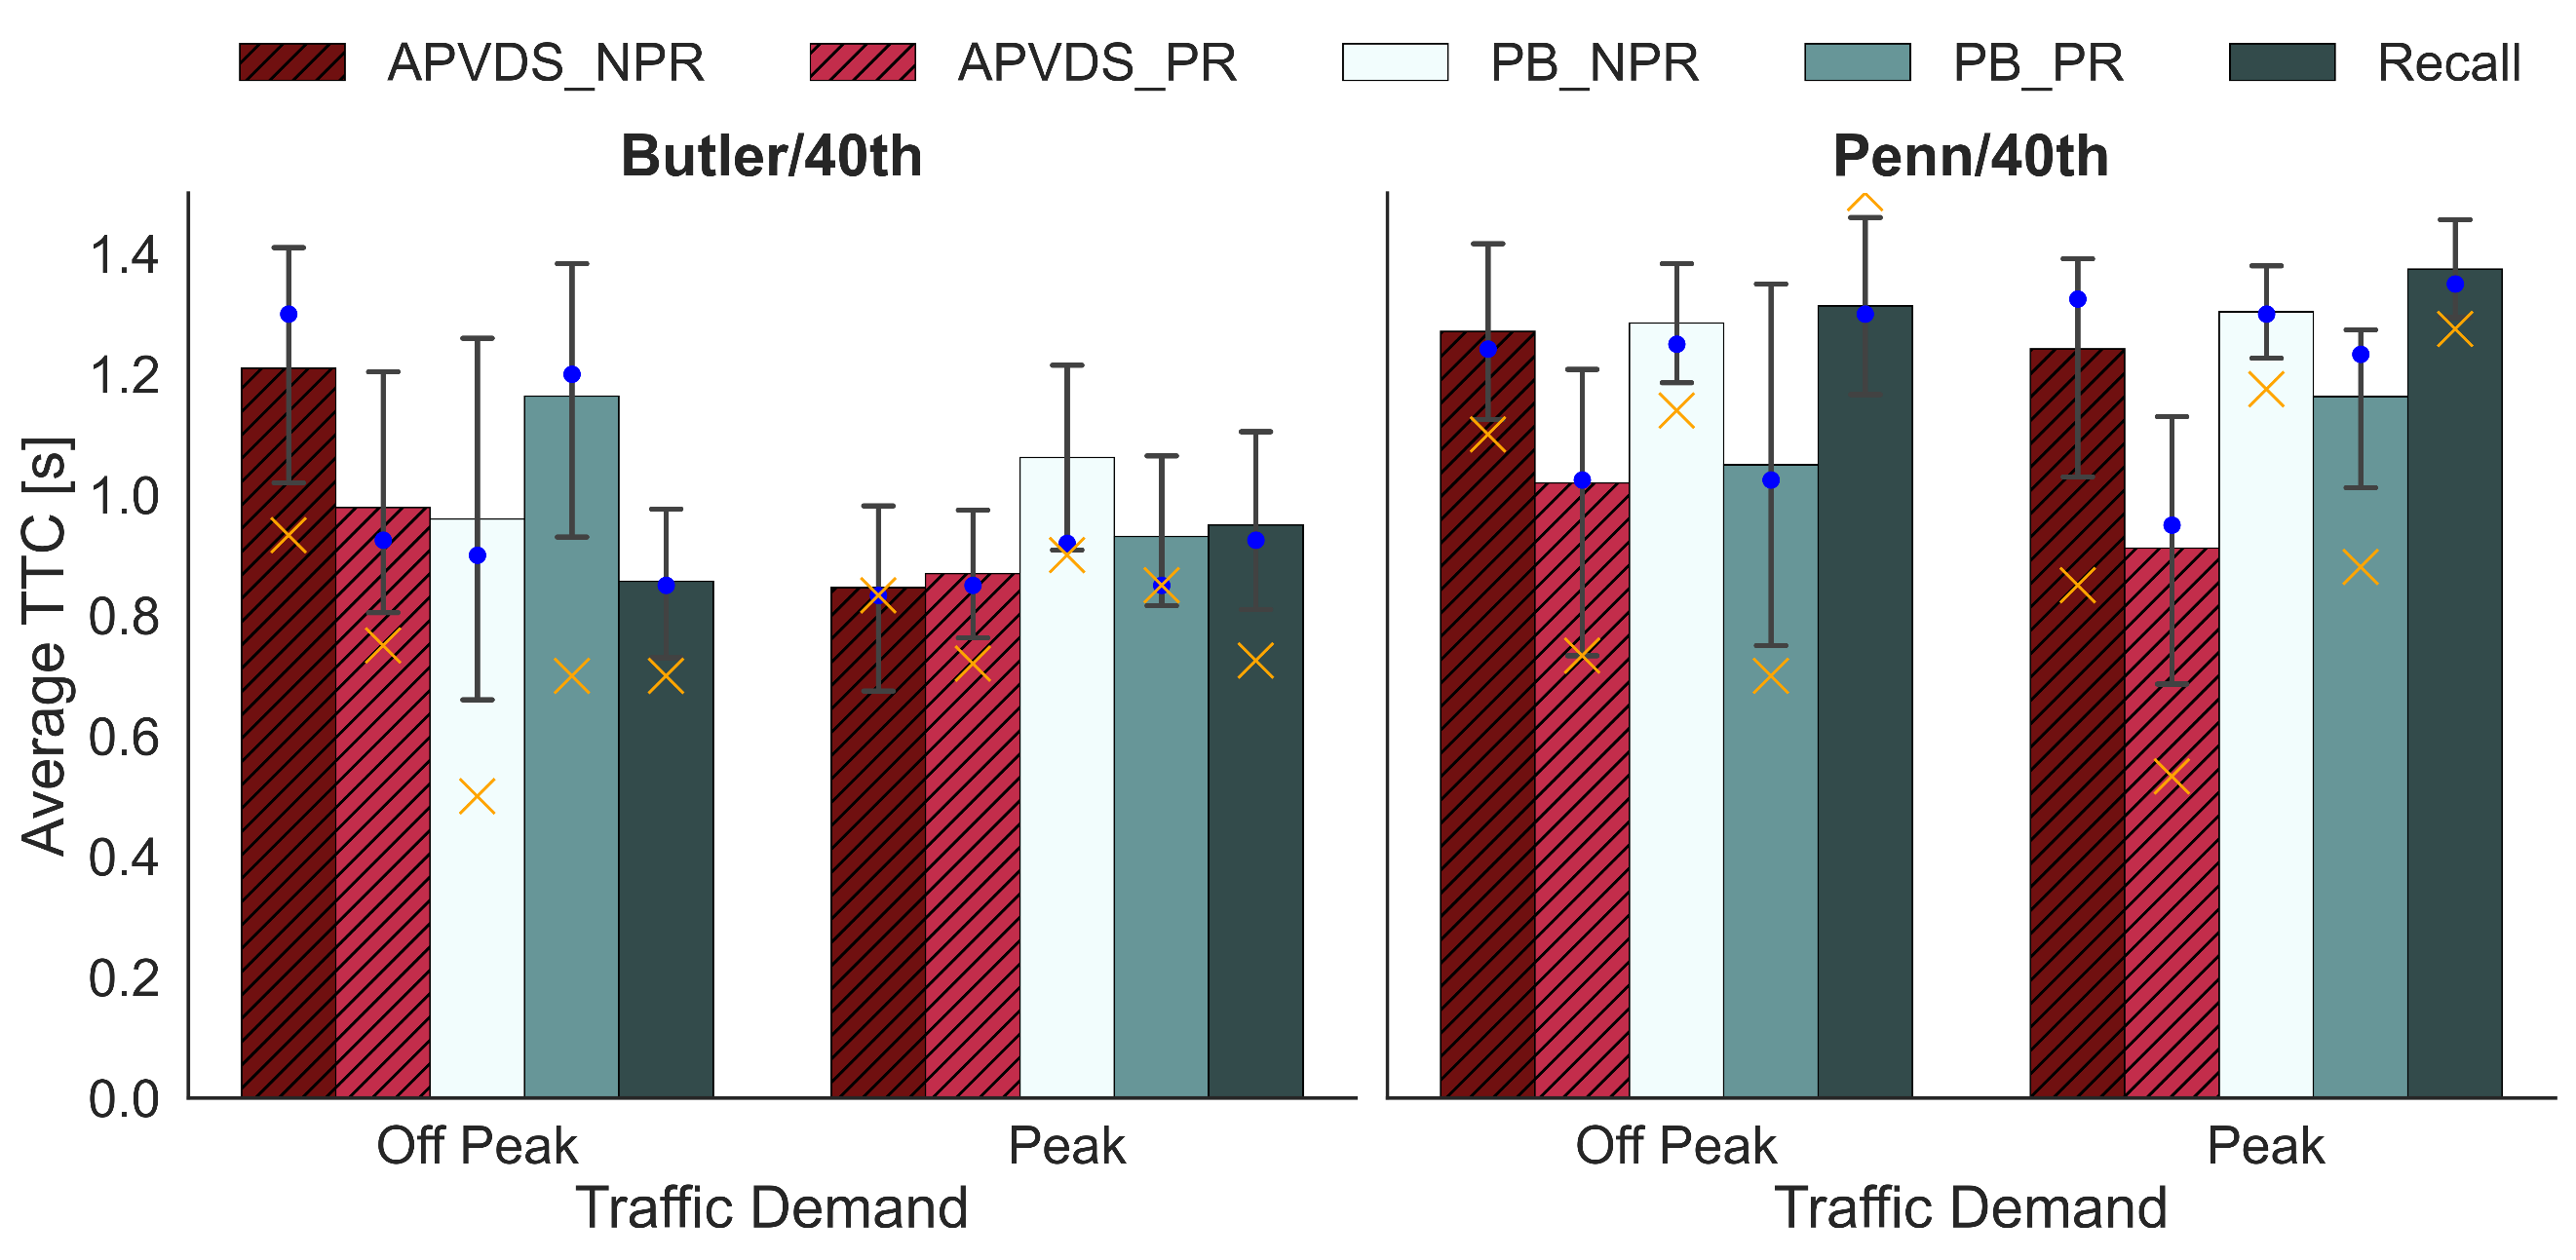
Figure 11 shows the average Post-Encroachment Time (PET) in seconds for different pedestrian timing treatments at two intersections: Butler/40th and Penn/40th. PET is a crucial safety measure representing the time interval between a vehicle and a pedestrian crossing the same point; higher PET values indicate safer conditions as they reflect greater separation between vehicles and pedestrians.
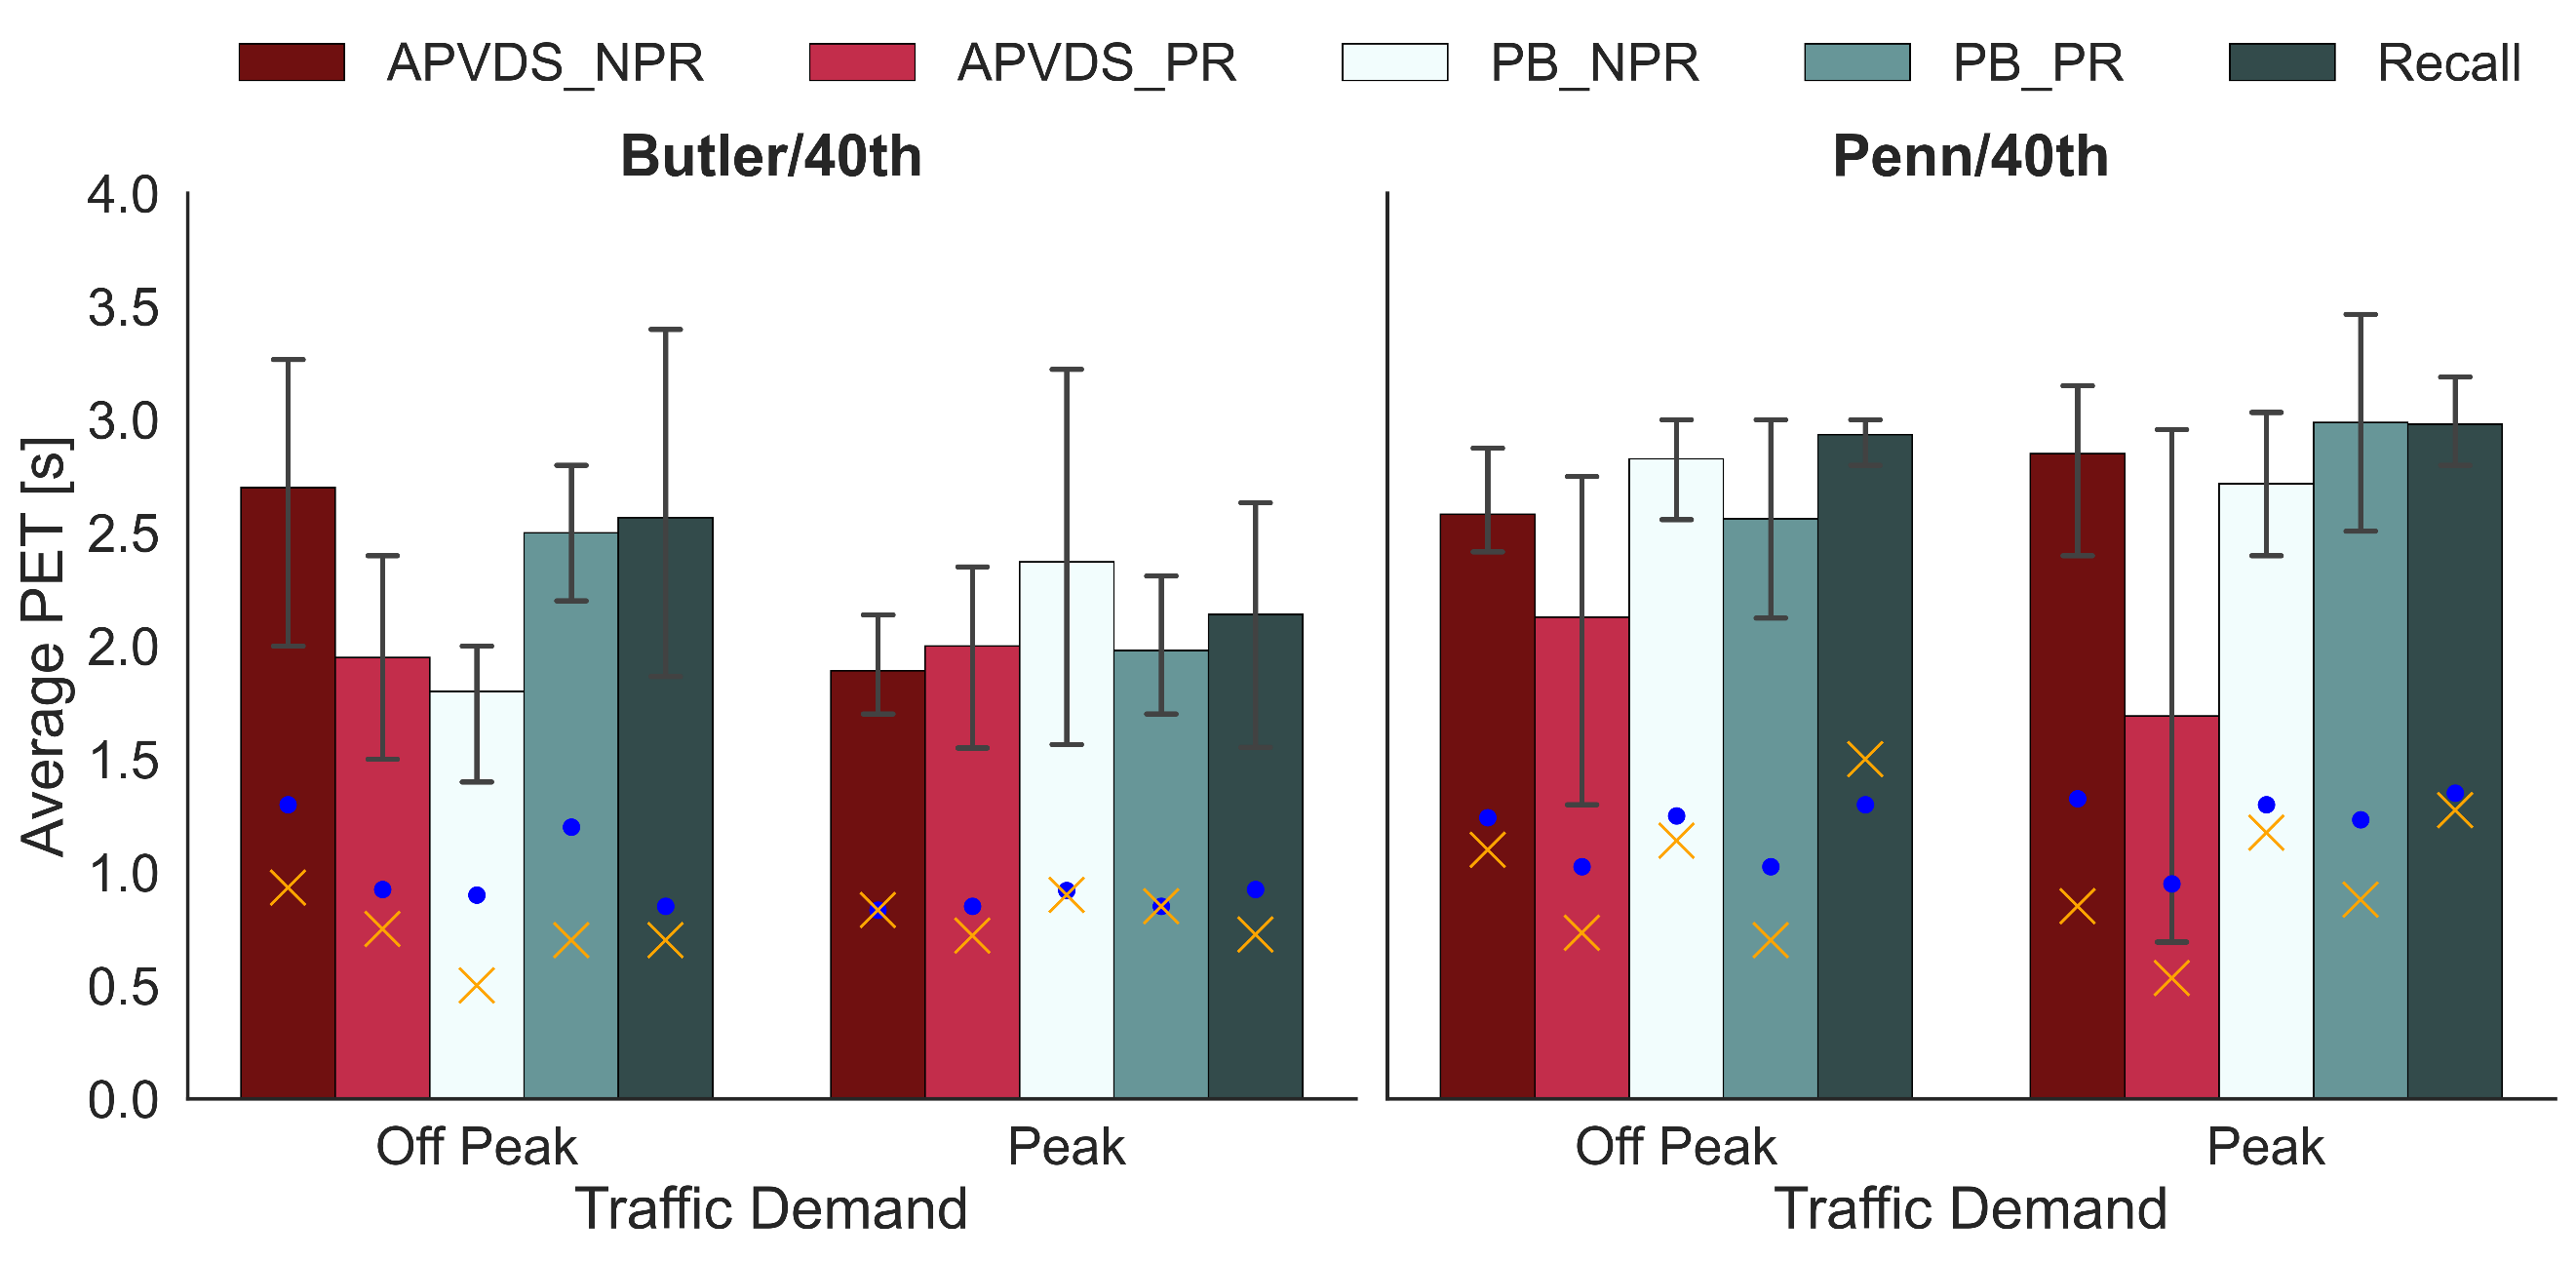
However, the differences in PET values between the intersections also highlight that intersection-specific factors can influence the effectiveness of pedestrian timing treatments. For instance, variations in traffic volume, pedestrian flow, signal timing configurations, and physical layout could all impact how well a particular treatment performs. Transportation agencies should consider the unique characteristics of each intersection, including traffic patterns, pedestrian behavior, and physical design, to optimize safety outcomes.
Conclusions
This study presents a thorough evaluation of inaccuracies in automated pedestrian detection within a high-fidelity microsimulation environment, focusing on their implications for safety measures at signalized intersections. It marks the first instance in literature where both missed and false pedestrian calls were adequately simulated and assessed, offering crucial insights into pedestrian safety at signalized intersections. Through extensive evaluation, the following key findings were established:
This research addresses a gap in the existing literature by introducing a novel methodology to evaluate various APVDS systems alongside alternative pedestrian signal treatments. Its practical significance lies in aiding transportation agencies in assessing APVDS safety through microsimulation. The primary limitation of this study is that the results cannot be generalized to all APVDSs, as they may have different missed and false call percentages compared to those considered in this study. Future research should explore the safety aspects of different automated pedestrian systems. Additionally, it should consider the percentage of pedestrians who do not press the push button and compare field-observed SSMs with the outputs from SSAM.
Declaration of competing interests
The authors report no competing interests.
Ethics statement
Not applicable.
Funding
No external funding was used in this research.
Declaration of generative AI use in writing
The authors declare that no generative AI was used in this work.
CRediT contribution statement
Slavica Gavric: Conceptualization, Methodology, Writing—original draft, Writing—review & editing.
Ismet Goksad Erdagi: Conceptualization, Methodology, Writing—review & editing.
Aleksandar Stevanovic: Conceptualization, Funding acquisition, Supervision, Writing—review & editing.