Assessing the Ghanaian driver's susceptibility to distraction engagement
Abstract
Driving requires managing multiple tasks in a dynamic environment. Yet, drivers frequently engage in non-driving activities, such as using mobile phones or adjusting in-vehicle technology, which distracts from essential vehicle controls. Evidence shows that such distractions impair performance and increase the risk of crashes and critical incidents. Understanding why drivers become distracted and identifying factors that contribute to distraction is crucial for developing effective interventions. This study examined the forms, instances, and predictors of distraction among Ghanaian drivers to propose actionable solutions. A sample of 257 private and commercial/professional drivers were recruited via personal contacts and social media and at bus terminals. The study examined voluntary and involuntary distractions using the Susceptibility to Driver Distraction Questionnaire (SDDQ) and four driving scenarios. Bivariate correlation and independent samples t-tests were used to assess relationships and differences among driver types, while hierarchical multiple regression identified key predictors of distraction. Results showed a positive correlation between self-reported distraction and voluntary distractions, with a negative correlation for involuntary distractions. Significant differences were found in the likelihood of mobile phone use between driver types in various driving contexts. Additionally, gender, age, past mobile-phone-related crash experiences, driving context (urban or motorway), attitude, injunctive norms, and involuntary distraction were significant predictors of distraction. These findings confirm the utility of the SDDQ in predicting distraction and emphasise the need for context-specific information when studying distraction.
1. Introduction
Driving is a complex activity performed in a constantly evolving environment. It involves performing multiple subtasks simultaneously (e.g., route finding, route following, velocity control, collision avoidance, rule compliance, and vehicle monitoring) (Brown, 1986; Sutanto et al., 2022a). Despite this complexity, however, drivers often engage in non-driving tasks that can take their attention (i.e., minds and eyes) off the road and their hands-off crucial vehicle controls (e.g., steering wheel and gear controls) (Brown, 1986; Regan & Hallett, 2011; Regan & Oviedo-Trespalacios, 2022). There is growing evidence that driver distraction is a significant contributing factor to crashes, crash outcomes, and critical incidents (Chu et al., 2022; Hasan et al., 2022; Karl et al., 2023; Lin & Hsu, 2022; Sajid Hasan et al., 2022; Sutanto et al., 2022b; Wu et al., 2022; Xing et al., 2023). Driver distraction also impairs driving performance, reduces vehicle control, and increases driver reaction time (García-Herrero et al., 2021). Many studies have reported that distracted drivers are more likely to engage in unsafe driving behaviours and commit driving lapses and errors, including failure to yield, right-of-way violations, speeding, etc. (Huisingh et al., 2015; Useche et al., 2018; Garcia-Herrero et al., 2020, cited in García-Herrero et al., 2021).
The term driver distraction has been defined variously. For instance, Lee et al. (2008) define it as “the diversion of attention away from activities critical for safe driving toward a competing activity” (p.34). Notably, the varied definitions emphasise that the driver diverts attention from core driving tasks to a competing activity, which may be driving-related or non-driving-related, from inside or outside the vehicle. The interested reader is referred to Regan and Hallett (2011) for a comprehensive discussion.
Although the contribution of distraction to crashes is generally underreported, distraction-related crashes constitute a significant proportion of motor vehicle incidents (Karl et al., 2023). Lee (2014) reveals that distracted driving accounts for 25% of severe vehicle crashes. Even though this figure may be underestimated (Gordon, 2008), it illustrates the magnitude of the problem of distracted driving. Previous naturalistic driving studies (Klauer et al., 2006; Olson et al., 2009) have also suggested that distracted driving is responsible for 22% of car crashes and 71% of truck crashes.
Driver distraction may stem from the driver’s deliberate engagement in distracting activities, cognitive limitations, traffic, and environmental conditions (Feng et al., 2014). Previous studies have identified four main types of distraction: visual distraction, which involves taking the eyes off the road (i.e., diverting attention towards things we see); auditory distraction, which hinders the effective use of hearing (i.e., diverting attention towards things we hear); physical or manual distraction, which entails taking the hands off the wheel (i.e., diverting attention towards things we feel); and finally, cognitive distraction, which means losing concentration on driving (i.e., diverting attention towards things we think about) (García-Herrero et al., 2021; Regan, 2010; World Health Organization, 2011). Regan (2010) identified two additional types: olfactory and gustatory distractions. Notably, Regan’s categorisation is based on the sensory modality influencing attention diversion to competing activities. Broadly, these types of distraction may be classified as in-vehicle distractions/internal (e.g., using mobile phones, interacting with in-vehicle assistive and entertainment systems, etc.) or on-road distractions/external (e.g., reading roadside advertisements, observing crash scenes, digital billboards, etc.) (García-Herrero et al., 2021; Marulanda et al., 2015).
Driver distraction can be either voluntary or involuntary. Voluntary distraction typically arises from a positive assessment of engaging in a competing activity, previous behaviour, confidence in managing distraction, the perceived risks associated with distractions, and tendencies towards sensation-seeking. Conversely, involuntary distraction pertains to a driver’s perceived ability to suppress responses to prominent stimuli, which are known to capture attention automatically. As argued by Feng and colleagues, in the instance of involuntary distraction, a driver may still be distracted by a stimulus or competing task even though they have no intention to engage with or respond to it (Feng et al., 2014; Marulanda et al., 2015).
The Susceptibility to Driver Distraction Questionnaire (SDDQ) (Feng et al., 2014; Marulanda et al., 2015) measures drivers’ self-reported engagement in distraction by distinguishing between their susceptibility to voluntary and involuntary distractions. Understanding the underlying reasons for distraction engagement and individuals’ susceptibility to various distractions is essential for developing effective countermeasures to mitigate distraction (Feng et al., 2014; Marulanda et al., 2015).
Previous studies have categorised distracted driving as an increasing global concern within the transport system, despite ongoing educational and enforcement efforts to address it (Oviedo-trespalacios et al., 2018; World Health Organization, 2011). Existing studies highlight a significant disparity in mobile phone use (hands-free and hand-held) by drivers, a primary form of driver distraction, with higher rates observed in low and middle-income countries compared to high-income countries (Wilkinson et al., 2015; Pheko et al., 2013; Vera-Lopez et al., 2012; Young et al., 2010, cited in Oviedo-trespalacios et al., 2018; World Health Organization, 2011). However, the magnitude of the issue surrounding driver distraction and its contribution to risky driving behaviour is not well understood (World Health Organization, 2011).
Oviedo-Trespalacios et al. (2018) predict that “mobile phone use while driving may either increase or at least remain stable over time, given the multiple ways in which they are utilised in daily life” (p. 2). They argue that a better understanding of mobile phone use (and, invariably, distraction engagement) is still necessary to guide efforts to prevent distraction while driving. Thus, this study aims to answer the following questions: (1) What types of distractions are most prevalent among various driver types? (2) Do driver types significantly differ in their likelihood of using mobile phones (auditory distraction) across different driving environments and contexts? (3) What is the contribution of SDDQ constructs (attitude, perceived control, norms, and involuntary distraction) in explaining distracted driving behaviour beyond demographic and situational variables? Insights from these questions would facilitate the proposal of practical interventions that align with the scale, forms, and instances of distraction engagement in the country, considering that distracted driving leads to poor performance and a high risk of traffic crashes (Oviedo-trespalacios et al., 2018).
The remainder of the paper proceeds as follows: the next section discusses the Ghanaian driving context and distraction engagement, followed by the study data and methods, the results, discussions, study limitations and future research, and conclusion.
2. The Ghanaian driving context and distraction engagement
In 2012, Ghana enacted the Road Traffic Regulations (L.I. 2180), which prohibit the use of mobile phones (hands-free and hand-held) while driving (Regulation 107). However, data on mobile phone use whilst driving (i.e., distracted driving) in Ghana is lacking, and there is no specific information on distraction involvement (e.g., mobile phone-related crashes) in traffic incidents. Nonetheless, Ghana’s official road traffic statistics collect data on driver inattention during crash investigations. Regan et al. (2011) define driver inattention as insufficient or no focus on activities essential for safe driving. Driver inattention and driver distraction are interconnected concepts; driver distraction is regarded as a form of driver inattention. Distraction can lead to inattentive driving and is, therefore, a significant contributory factor to serious traffic incidents, including crashes (Klauer et al., 2006).
Previous studies in Ghana, including Donkor et al. (2018), Dotse et al. (2019), and Mesic et al. (2023), have observed an increase in distracted driving (particularly mobile phone use) among drivers in Ghana. Donkor et al. (2018) noted that commercial drivers in Ghana are highly aware of the L.I. 2180 ban on mobile phone use while driving but do not comply, demonstrating low compliance. The commercial drivers reported using mobile phones while driving to inform colleague drivers of road events and incidents. More than one-quarter of the drivers believe that mobile phone use is not distracting. Ironically, nearly 15% of the surveyed drivers have been involved in a crash or near-crash due to mobile phone use while driving.
Data from the National Road Safety Authority (2024) indicate that 680 (29.6%) individuals were killed and 4,517 (32%) injured in 2022 due to driver inattention, making it the second leading cause of fatalities, after driver speeding, which accounted for 861 (37.5%) traffic deaths and 4,324 (30.7%) traffic injuries. A prior study by Dotse et al. (2019) revealed that commercial drivers often lose focus on the road, becoming absent-minded while preoccupied with other concerns, such as family issues and passenger distractions. Driver inattention is the second most significant driver error linked to traffic deaths and injuries in Ghana.
The issue is exacerbated by the mixed traffic land use in Ghana, where pedestrians and motorists share the same road space. Increasing pedestrian distraction in Ghanaian cities (Sam et al., 2023) poses a significant risk for already distracted drivers. Data from the National Road Safety Authority (NRSA) further indicate that in 2022, 463 (60%) pedestrians were killed while crossing the road, with 135 (17.5%) others killed while walking along it. Additionally, 1,106 (54.7%) and 439 (21.7%) pedestrians were injured while crossing or walking along the road, respectively, during the same period. Mid-year data (January-June 2024) from the Motor Traffic and Transport Department of the Ghana Police Service reveal that 1,219 pedestrian knockdowns have been recorded in Ghana (Tengma, 2024).
3. Data and methods
3.1. Participants
The sample comprised 257 Ghanaian drivers (157 Commercial/professional and 100 private) (valid entries) surveyed via the KoboToolbox data collection platform between November and December 2023. The private drivers were recruited via in-person contacts and electronic invitations on social media (Facebook, LinkedIn, and WhatsApp platforms), and commercial/professional drivers were recruited at popular bus terminals in Accra. The main selection criterion was possessing a valid driving license and driving thrice weekly. The participants were mainly males (n=221 or 86%), reflecting the Ghanaian driving population, aged 36.58 years (SD= 9.53) and driving 35 hours weekly on average (many of the surveyed private drivers drive personal vehicles or company-assigned cars in relation to their occupation). During the survey, the majority (87.6%) had ≥ five years of driving experience and no past distraction-induced crashes (80.2%).
3.2. Measures
The study utilised the Susceptibility to Driver Distraction Questionnaire (SDDQ) to investigate the sampled drivers’ voluntary and involuntary distraction engagement (Feng et al., 2014). The SDDQ has three (3) sections with 39 items measuring six (6) different constructs or subscales: (1) self-reported distraction engagement, (2) attitudes toward distractions, (3) perceived control of driving while engaged in distractions, (4) injunctive and (5) descriptive social norms associated with (voluntary) distraction engagement, and (6) susceptibility to involuntary distractions.
The first construct, engagement in distraction while driving, comprises seven items on a 5-point Likert scale to assess the self-reported frequency of distraction engagement, e.g., When driving, I hold phone conversations, manually interact with a phone (e.g., sending text messages), and adjust the settings of in-vehicle technology (e.g., radio channel or GPS). The scale was assigned points from 1 (never) to 5 (very often), and the points were then averaged across the seven distractions to create an overall self-reported distraction engagement score.
The second section of the SDDQ investigates facilitators of voluntary distraction. It covers the following constructs based on the theory of planned behaviour: attitude (e.g., I think it is alright for me to drive and hold phone conversations), perceived control (e.g., I believe I can drive well when I hold phone conversations), perceived descriptive norms (e.g., Most drivers around me drive and hold phone conversations) and injunctive norms (e.g., Most people who are important to me think it is alright for me to drive and hold phone conversations). Descriptive norms refer to an individual’s belief about other people’s behaviours, while injunctive norms describe the perceived expectations of an individual’s behaviour (Ajzen, 1991). The four constructs probe for the same list of distractions used in the first construct, except for ‘daydream’, as drivers cannot voluntarily engage in daydreaming (Feng et al., 2014). Responses to the items in the four constructs are measured using a 5-point Likert scale, from strongly disagree (1) to strongly agree (5). A score for each of the four constructs is calculated by averaging the responses to the six distractions.
The final section of the SDDQ investigates susceptibility to involuntary distraction (6th construct) based on drivers’ self-reported ability to suppress stimuli brought about by technologies (i.e., phone and radio), passengers, external distractions, and daydreaming. Distraction in these items is hypothesised to originate from the content of the stimuli (e.g., music or audio alert) rather than the action itself. For example, for the item “While driving, I find it distracting when I listen to music”, the act of turning on music is voluntary (i.e., having the radio “on” or “off”). However, once the music is being played, the driver may be paying attention to the music involuntarily. Responses to the items in this construct are measured on a 6-point Likert scale of strongly disagree (1) to strongly agree (5) and never happens. For scoring purposes, responses across all eight items are averaged, excluding responses of ‘never happens’ (Feng et al., 2014).
3.3. Other measure (driving context/driving task demand)
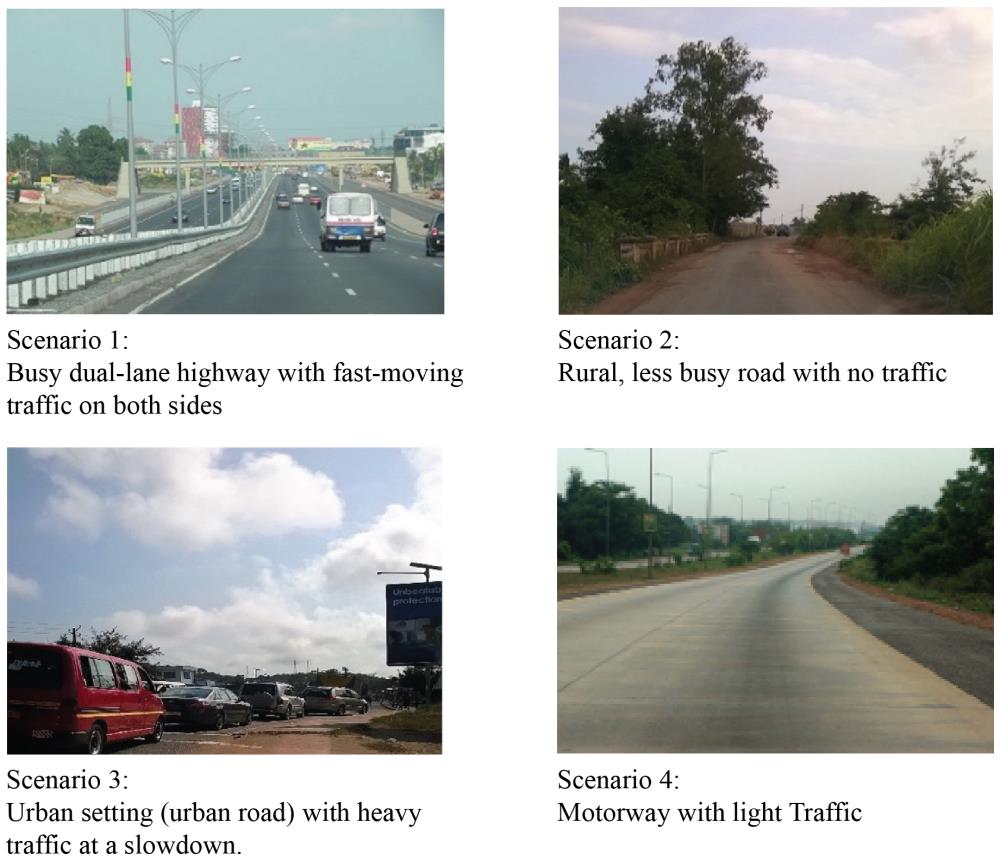
Given that the SDDQ questions do not provide specific contexts or situations for the distractions surveyed (Chen et al., 2016), the study included specific driving contexts (traffic environments of varying complexity). Previous studies maintain that drivers’ decision to engage in distraction or non-driving activities and the amount of attentional capacity they may have in dealing with driving environment stimuli is influenced by the driving context, which may impact the level of perceived risk associated with engaging in the secondary task and the amount of stimuli present in the environment (Chen et al., 2016; Marulanda et al., 2015). Thus, aside from the SDDQ items, four (4) driving scenarios based on Ghana’s traffic and road conditions were created (using pictures of different road environments with diverse traffic activities/contexts and thus different workload situations; see appendix) to assess the probability/extent and instances of distracted driving among the study participants. Participants were to imagine driving in the four road/traffic scenarios and indicate how likely they would be to use a mobile phone (e.g., texting and calls) on a 5-point Likert scale as follows: 1- very unlikely, 2- unlikely, 3- neutral, 4- likely, and 5- very likely.
Scenario 1: You are driving on a busy dual-lane highway with fast-moving traffic on both sides.
Scenario 2: You are driving on a rural, less busy road. There seems to be no traffic.
Scenario 3: You are driving in an urban setting (urban road). Traffic is heavy but at a slowdown.
Scenario 4: You are driving in a motorway setting. Traffic is light.
Previous studies, including Oviedo-Trespalacios et al. (2018), used similar driving scenarios to examine drivers’ perceived crash risk, driving comfort, difficulty, ability, and likelihood of engaging in a voice call and texting.
3.4. Analyses
Analyses proceeded as follows: firstly, an average score was calculated separately for each construct/subsection, ignoring any item with a “never happens” response. The following constitute the range of possible scores for the SDDQ constructs: self-reported distraction engagement (7-35), Attitude, perceived control, perceived descriptive norms, injunctive norms (6-30), and involuntary distraction (8-40). Higher scores indicate a higher degree of (or susceptibility to) performing the act. For example, a higher score on self-reported distraction engagement suggests a higher degree of susceptibility to distraction. Bivariate correlations and independent samples t-tests were conducted to investigate associations among driver type and forms of distraction. In contrast, hierarchical regression models examined the variables that predict distraction engagement. All analyses were performed using SPSS version 29.
4. Results
4.1. SDDQ reliability analysis
A reliability analysis was conducted on the SDDQ variables (Table 1). The Cronbach alpha statistics revealed acceptable (moderate to high) internal consistencies of the six (6) SDDQ constructs: Self-reported distraction engagement: 0.63; attitude: 0.71; perceived control: 0.79; injunctive social norms: 0.75; descriptive social norms: 0.77; and involuntary distraction: 0.83. The items “Daydreaming” (in the case of the “self-reported distraction engagement” construct) and “Manually interacting with a phone” (in all constructs except Involuntary distraction) were deleted to improve construct reliabilities. These items were further excluded from calculating the composite score for each construct. Table 1 further reveals that “adjusting the settings of in-vehicle technology” was essential in explaining all the constructs except descriptive social norms and involuntary distraction.
4.2. Correlations between SDDQ subsections/constructs
Table 2 presents the Pearson correlations between the SDDQ constructs. Self-reported distraction engagement while driving was positively correlated with the potential facilitators of voluntary distraction (r = .56, p<.001). That is, drivers who reported engaging in distraction while driving deemed themselves capable of driving while distracted and, as such, held a positive attitude towards distraction (r = .52, p<.001), perceived a higher level of control (r =.48, p<.001), and a higher level of approval toward distracted driving from other drivers (r =.20, p<.001) and significant others (family and peers) (r =.36, p<.001).
Moreover, self-reported distraction engagement was negatively correlated with involuntary distraction (r = -.34, p>.001), implying that drivers distracted by external stimuli are less capable of controlling distraction engagement. Table 2 further reveals that the voluntary distraction score was negatively correlated with the involuntary distraction score (r = -.32, p>.001). For instance, involuntary distraction correlated negatively with attitude (r = -.31, p>.001), perceived control (r = -.25, p<.001), injunctive norms (r = -.14, p<.001), and descriptive norms (r = -.18, p<.001). These results imply that drivers who perceived external stimuli as distracting were likelier to hold a negative attitude toward distraction engagement and perceive themselves as less capable of driving when distracted.
| SDDQ constructs | 1 | 2 | 3 | 4 | 5 | 6 | 7 |
| 1 Distraction engagement | - | .527** | .487** | .209** | .364** | -.340** | .568** |
| 2 Attitude | .527** | - | .691** | .019 | .529** | -.319** | .804** |
| 3 Perceived control | .487** | .691** | - | .080 | .504** | -.255** | .828** |
| 4 Injunctive social norms | .209** | .019 | .080 | - | .062 | -.142* | .411** |
| 5 Descriptive social norms | .364** | .529** | .504** | .062 | - | -.182** | .747** |
| 6 Involuntary distraction | -.340** | -.319** | -.255** | -.142** | -.182** | - | -.328** |
| 7 Voluntary distraction | .568** | .804** | .828** | .411** | .747** | -.328** | - |
4.3. Driver type and type/forms of distraction
An independent-sample t-test compared private and commercial drivers’ mean self-reported, voluntary, and involuntary distraction engagement scores. The results showed no significant difference in the distraction scores for the driver types. However, there was a significant difference in the perceived control scores for private drivers (M= 14.06, SD= 4.85) and commercial/professional drivers [M= 15.82, SD= 4.22; t(255)=-3.07, p<.05]. The magnitude of the differences in the means was small (Cohen’s d= .3).
Moreover, as presented in Table 3, the study explored the five prominent voluntary driver distractions. The bivariate correlation analysis between driver type and the five voluntary driver distractions found that private drivers more strongly engage in adjusting in-vehicle technology (physical/manual distraction) (r=0.78, p=.01) and reading roadside advertisement (visual distraction) (r=0.78, p=.01) compared to commercial/professional drivers. Commercial/professional drivers were distracted mainly by adjusting in-vehicle technology (r=0.73, p=.01). Taken together, adjusting in-vehicle technology (physical/manual distraction) was the prominent form of distraction among the study sample.
| Driver type | Form of distraction | ||||
| Hold phone conversation (auditory distraction) | Adjust in-vehicle technology (physical/manual distraction) | Read roadside advertisement (visual distraction) | Check roadside accident scene (visual distraction) | Chat with passengers (auditory distraction) | |
| Private | .71** | .78** | .78** | .75** | .45** |
| Commercial/Professional | .52** | .73** | .58** | .65** | .44** |
Further, the study explored the surveyed drivers’ perceived likelihood of using mobile phones (auditory distraction) while driving in the four driving contexts or scenarios examined (Table 4). Table 4 suggests that generally, the drivers are more likely to use the mobile phone in cognitively less demanding driving contexts: a rural, less busy road (M=3.08, SD=1.39) and an urban road with heavy traffic (but at a slowdown) (M=3.07. SD=1.52). They are less likely to use their mobile phones in a busy road environment with fast-moving traffic.
| Driving scenario | M (SD) | Min, Max |
| Busy dual-lane highway with fast-moving traffic on both sides | 1.64 (1.12) | 1,5 |
| Rural, less busy road | 3.08 (1.39) | 1,5 |
| Urban road with heavy traffic but at a slowdown | 3.07 (1.52) | 1,5 |
| Motorway with light traffic | 2.05 (1.31) | 1,5 |
An independent samples t-test was further conducted to compare the means of perceived likelihood of using mobile phones while driving per each driving context or scenario for private and commercial/professional drivers. The results showed significant differences in the mean of perceived likelihood of using mobile phones while driving in a rural, less busy road for private drivers (M= 3.36, SD= 1.43) and commercial/professional drivers [M= 2.90, SD= 1.34; t(255)=2.62, p<.05], and in an urban road with heavy traffic for private drivers (M= 3.46, SD= 1.45) and commercial/professional drivers [M= 2.82, SD= 1.51; t(255)=3.37, p<.001]. The magnitude of the differences in the means was small (Cohen’s d= .4).
4.4. Predictors of distraction engagement
Three hierarchical regression models were estimated to predict distraction engagement (Table 5). Gender, age, education, driver type, driving experience and driving hours per week, vehicle transmission type, type of vehicle occupant conveyed, and past mobile phone-related crash experience were entered in Step 1 (Model 1); the four driving contexts or scenarios were entered in Step 2 (Model 2), and the SDDQ variables were entered in Step 3 (Model 3) to assess their contributions to the prediction of distraction engagement. The change in R-squared was utilised as the primary parameter to compare the predictors, indicating how much additional variance in the dependent variable is explained by the new predictors.
Model 1 accounted for 15% of the variance in distraction engagement, with gender, age, and past mobile phone-related crash experience being significant predictors. Adding the four hypothetical driving contexts (Model 2) contributed an additional 10.3% to the variance, with urban and motorway driving contexts or scenarios being significant predictors. Finally, adding the five (5) SDDQ variables (Model 3) improved the model by contributing 23.9% to the variance in distraction engagement, with attitude, injunctive norms, and involuntary distraction being significant predictors. The entire model accounted for 49.2% of the variability.
5. Discussion
The study assessed the forms, instances, and predictors of distraction engagement among Ghanaian drivers. In addition to mobile phone use while driving, the study examined other sources of driver distraction engagement.
5.1. SDDQ variables
The SDDQ variables exhibited good internal consistency among the construct items consistent with previous studies (Chen et al., 2016; Feng et al., 2014). By implication, the SDDQ is reliable in assessing distraction engagements involving voluntary and involuntary attributes contributing to distractions, helpful in developing strategies for distraction mitigation, and thus crucial for understanding the underlying reasons for distraction engagements by distinguishing between voluntary and involuntary aspects of distraction (see Feng et al., 2014).
5.2. Correlations between SDDQ subsections
One important finding was that distraction engagement while driving positively correlated with the facilitators of voluntary distraction (attitude, perceived control, injunctive, and descriptive social norms) but negatively correlated with involuntary distraction. This result corroborates previous studies (Chen et al., 2016; Feng et al., 2014) and the theory of planned behaviour (TPB) (Ajzen, 1991). The findings mean that drivers who self-reported driving distracted held positive attitudes and beliefs about distraction, deemed themselves capable of driving distracted, and had favourable approval from their peer drivers and family and friends (i.e., significant others). The finding suggests that remedial action should target drivers’ attitudes, perceived control, and influence from significant others to address distraction engagement effectively.
The negative relationship between distraction engagement and involuntary distraction suggests that drivers distracted by external stimuli may have difficulty driving effectively when distracted (or managing distraction engagement). By implication, a very high level of engagement with driving may leave no workload for involuntary distraction. However, this finding contradicts the study by Feng et al. (2014), which found no correlation between the two constructs.
Consistent with previous studies (e.g. Feng et al., 2014), we found that the voluntary distraction score was negatively correlated with the involuntary distraction score. Further, the facilitators of voluntary distraction were negatively correlated with involuntary distraction, implying that drivers who perceived external stimuli as distracting were likelier to hold a negative attitude toward distraction engagement.
5.3. Driver type and distraction forms
Unlike previous studies, we found no significant difference in the distraction scores for private and commercial/professional drivers. A recent study by Razzaghi et al. (2024) found a significant difference in distraction between private and professional drivers (taxi drivers in their case). They found higher mean distraction scores among taxi and professional drivers than private drivers. A growing body of studies contends that professional drivers experience tremendous physical and psychological strain and stress from extensive driving periods and occasional altercations with passengers, which heightens unsafe and distracted driving among them (Dotse et al., 2019; Razzaghi et al., 2024).
However, the study found higher perceived control among commercial/professional drivers than among private drivers, corroborating Razzaghi et al. (2024) finding that commercial/professional drivers are more confident in their driving ability (i.e., their higher perceived control or ability against distracted driving) more than other drivers due to more driving experience leading to less attention among them. A similar study in Ghana by Donkor et al. (2018) observed that distracted driving among commercial drivers was positively associated with driving experience. By implication, commercial/professional drivers are distraction-prone given their higher perceived control and perhaps the stressful nature of their jobs, coupled with demanding passengers (Burgel & Elshatarat, 2019; Razzaghi et al., 2024).
The study also found that physical/manual distraction (adjusting in-vehicle technology) is a major source of distraction for both private and commercial drivers, implying that the sampled drivers generally interact with in-vehicle technology while driving. García-Herrero et al. (2021) maintain that technology-based distraction is a prominent distraction type proven to divert drivers’ attention off the road and compromise safety. By implication, distraction-mitigating countermeasures should target reducing driver’s in-traffic engagement with in-vehicle technology via the restrictions imposed by current intelligent transport systems (ITS) and advanced driver assistance systems (ADAS). Some ITS experts have recommended deploying artificial intelligence (AI)-powered driver monitoring technology, detection alert systems, and intelligent transport systems to mitigate distraction engagement. The interested reader is referred to Pickering et al. (2007)'s discussion on automotive human-machine interface technologies and techniques to reduce driver distraction and that of Sutanto et al. (2022a) on technology for reducing distracted driving in developing countries. Sutanto et al. (2022a), however, observed that the intended safety benefit of these distracted-driving prevention technologies depends on the frequency of use by the driver.
Moreover, we found that private drivers were likelier to use mobile phones while driving on rural, less busy roads and urban roads with heavy traffic. Razzaghi et al. (2024) also reported higher mobile phone use (holding phone conversations) among private drivers than among taxi (i.e. commercial) drivers, consistent with the current study findings. The present finding also implies that distraction engagement is driving-context-specific, particularly predominant in cognitively low-demanding driving contexts, such as rural, less busy roads and urban roads with heavy traffic. This is consistent with previous studies, including Marulanda et al. (2015). Chen et al. (2016) maintain that providing situational driving context helps respond more accurately to driver behaviour.
5.4. Predictors of distraction engagement
The results of the hierarchical regression analysis corroborate the importance of the SDDQ (and invariably the TPB) in predicting self-reported distraction engagement. As observed earlier, adding the TPB-based SDDQ constructs significantly explained more variance (23.9%) in distraction engagement than the two previous models estimated. This increased variance implies that the SDDQ constructs may better explain many of the effects of the significant variables in the previous models (see Chen et al., 2016).
Another important finding was that gender, age, past mobile phone-related crash experience, urban and motorway driving contexts, attitudes, injunctive norms, and involuntary distractions are crucial predictors of distraction engagement among the study sample.
5.4.1. Gender and age effects on distraction engagement
The study found that gender and age were negatively correlated with distraction engagement. In their study, Chen et al. (2016) found that male respondents reported a higher engagement in driver distraction than their female counterparts. Feng et al. (2014) also found significant gender differences in (voluntary) distraction scores, with males having higher scores than females. Similarly, Chen and colleagues also reported that age was a significant factor in self-reported distraction engagement in that young adults reported higher levels of distraction engagement than middle-aged and older respondents. A recent study also concluded that distracted drivers are likelier to be younger (Alketbi et al., 2020), which aligns with what is known about young drivers engaging in more risky driving behaviours and violations. Regarding mobile phone use while driving, Lyon et al. (2021) reveal that younger drivers report the highest levels of engagement compared to any other age group. Young drivers are also vulnerable to distraction, given their relative inexperience behind the wheel (World Health Organization, 2011).
5.4.2. Past mobile-related crash experience and distraction engagement
As expected, the study found that drivers’ past mobile phone-related crash experiences are negatively correlated to distraction engagement. Thus, drivers with a prior history of mobile phone-related crashes are less likely to engage in distracted driving. The experience may have instilled in them the need to drive without distraction, including mobile phone use. Further studies are, however, needed to establish the context and magnitude of the relationship. The contribution of past mobile phone-related crash experience to explaining self-reported distraction engagement in the current study was modest (16%) but needs to be validated in different contexts. The study envisages that the more recent the experience, the less likely the driver will be willing to engage in distracted driving.
5.4.3. Driving context (urban and motorway driving) and distraction engagement
It also came to light that driving on an urban road with heavy traffic but at a slowdown and in a motorway setting with light traffic were associated with a higher probability of distraction engagement, bringing into focus the discussion of the driving context/ environment in distraction engagement (Marulanda et al., 2015; Oviedo-trespalacios et al., 2018). Oviedo-Trespalacios et al. (2018) observed that demanding driving contexts are negatively related to the likelihood of mobile phone multitasking. As Marulanda et al. (2015b., p.355) rightly observed, “drivers’ decision to engage in a non-driving task and the amount of attentional capacity they may have in dealing with stimuli in the driving environment largely depend on the context, which may influence the level of perceived risk associated with engaging in a secondary task, and the amount of stimuli present in the environment”. They maintain that “providing context is therefore extremely useful in supporting drivers to answer questions about their distraction engagement and attentional capacities more accurately” (p.355).
5.4.4. Attitude and distraction engagement
The present study found that attitude was the most crucial predictor of distraction engagement. Previous studies also found that attitude significantly predicted distraction engagement (Chen et al., 2016) and the intention to engage in text messaging behaviours (reading and sending text messages) while driving (Prat et al., 2015). Consistent with these studies, Sam (2022b) also observed the critical role attitude plays in the intention to act (in this case, the intention to cycle for work and school trips).
5.4.5. Injunctive social norms and distraction engagement
As indicated earlier, the study found a positive relationship between injunctive social norms (i.e., perceived expectations of an individual’s behaviour or what the driver ought to do) and self-reported distraction engagement. This means that drivers engage in distracted driving to the extent that significant others (peers and significant others) approve of the behaviour. This finding contradicts previous findings, including Chen et al. (2016), where descriptive social norms (individual’s belief about other people’s behaviours- what is common in society) are believed to predict self-reported distraction engagement, which suggests that drivers may be influenced by what their peers do on the road (descriptive social norms) rather than what they perceive they ought to do (injunctive social norms). Notably, a recent systematic review of the impact of descriptive and injunctive norms on engagement in mobile phone use while driving in younger drivers (Nicolls et al., 2022) found that both descriptive and injunctive social norms play essential roles in influencing behaviour. The above discussion (though inconclusive) generally highlights the importance of social norms in influencing behaviour. It thus warrants further investigation as they may have important implications for remedial action/intervention. Hence, further studies are needed to examine the extent of the influence of descriptive and injunctive social norms on driver distraction engagement.
5.4.6. Involuntary distraction and distraction engagement
Finally, the study found a negative correlation between involuntary distraction and self-reported distraction engagement, contrary to Feng et al. (2014). Feng and colleagues argue that susceptibility to involuntary distraction is related to a driver’s attentional capacity. This suggests that drivers who deem themselves less likely to suppress potentially distracting stimuli while driving are less likely to drive distracted. Although Feng and colleagues found no association between involuntary distraction and distraction engagement, they observed that the magnitude of the correlations increased with increasing age.
However, in this study, the other SDDQ variables (perceived control and descriptive social norms) did not predict distraction engagement among the study sample, contrary to previous studies, including Chen et al. (2016), Prat et al. (2015) and theory of planned behaviour (Ajzen, 1991). The two variables may have been affected by the strong contributions of attitude (27.6%) and injunctive social norms (18.1%) to explaining variance in self-reported distraction engagement among the study sample indicative of the relative variability of the SDDQ variables. It is, thus, crucial to indicate that the contribution/importance of the SDDQ variables (particularly perceived control) does vary across situations and actions (i.e., context-dependent) (Ajzen, 1991).
6. Study limitation and future research
The study exposed the crucial roles of driver characteristics (including age, gender, past distracted driving experience, and attitude), driving context, and peer and significant others’ (dis)approval on driver distraction engagement. However, the study has some limitations that are worth mentioning. For instance, it is widely acknowledged that self-reported measures are susceptible to social desirability biases, which could have resulted in respondents underreporting their behaviour (i.e., providing socially desirable responses). However, anonymising the study resulted in reasonably valid responses consistent with anecdotal evidence in the country.
Furthermore, although the study did not directly survey drivers’ mobile phone use, responses to the SDDQ imply actual mobile phone use while driving. In line with this, previous studies in Ghana have reported an increase in distracted driving, particularly the prevalence of mobile phone use among Ghanaian drivers (Donkor et al., 2018; Dotse et al., 2019; Mesic et al., 2023). Future studies could present drivers with images of driving scenarios and ask how they would respond in each situation or assess images of behaviour based on risk and acceptability.
The study could have been more geographically representative due to the non-random sampling method and online data collection. This suggests that the respondents may not accurately reflect the general driving population and Ghana’s diverse geographical contexts. However, conducting substantial surveys at the bus terminals mitigated the potential adverse effects of using the online data collection tool. To ensure the generalisability of the study’s findings (which the present study cannot claim), future research should utilise a more representative sample that aligns with the country’s driving population and geographical distribution, employing probabilistic sampling techniques and a face-to-face data collection approach.
Lastly, considering the gender imbalance, conclusions regarding the influence of gender on distraction engagement should be approached with caution. Yet previous studies have shown that gender is an essential predictor of driver distraction engagement.
7. Conclusion
The aim of the present study was to examine the types of distractions most prevalent among various driver types, whether these driver types significantly differ in their likelihood of using mobile phones across different driving environments and contexts, and the contribution of SDDQ constructs in explaining distracted driving behaviour beyond demographic and situational variables. The study results suggest that gender, age, previous experience with mobile phone-related crashes, driving context, attitude, injunctive norms, and involuntary distractions influence engagement in distraction. In other words, driver distraction engagement is more influenced by the driver’s characteristics, the driving context, the approval or disapproval of the driver’s peers and significant others, and the ability to manage external distracting stimuli. The study confirms the SDDQ’s effectiveness in predicting both voluntary and involuntary distraction engagement. Moreover, the study’s insights underscore the significance of providing context-specific information related to driving when examining distraction engagement.
The study’s findings have important implications for personalised strategies and interventions to mitigate self-reported distraction engagement. As Donkor et al. (2018) rightly observed, future prevention efforts for distracted driving in Ghana will require targeted enforcement and education for motorists.
Firstly, there is an urgent need to enforce Regulation 107 of the Road Traffic Regulations (L.I. 2180), which prohibits using mobile phones and other forms of distraction while driving. The Motor Traffic and Transport Department of the Ghana Police Service and the National Road Safety Authority should initiate awareness campaigns about the dangers of distractions while driving and promote countermeasures such as “no texting while driving” apps and the reduction of advertisements near busy roadways. The relevant sanctions for violating Regulation 107 should also be publicised to increase their deterrent effect (Bates et al., 2012, 2020; Sam, 2022a; World Health Organization, 2011).
Beyond enforcement, the findings also indicate the necessity for public engagement, the creation of awareness, and education (particularly for motorists) regarding the traffic risks associated with distracted driving. This should emphasise the study’s findings on the predictors of distraction engagement, such as driving context (road environment), driver characteristics, peer influence, and the ability to manage external distracting stimuli.
CRediT contribution
Enoch F. Sam: Conceptualization, Data curation, Formal analysis, Investigation, Methodology, Writing—original draft, Writing—review & editing.
Data availability
The data are available on request to the authors.
Declaration of competing interests
The authors report no competing interests.
Ethics statement
The study was performed in line with the University of Education, Winneba (UEW) Research Ethics Policy (2018), which provides an overarching framework regarding ethical conduct and research of UEW involving human and non-human subjects.
Funding
No external funding was used in this research.
Declaration of generative AI use in writing
The authors declare that no generative AI was used in this work.
Editorial information
Handling editor: Mette Møller, Technical University of Denmark, Denmark
Reviewers: Andrea Paliotto, University of Florence, Italy; Thomas Streubel, Volvo Cars, Sweden
Submitted: 29 October 2024; Accepted: 8 May 2025; Published: 2 June 2025; Updated: 11 October 2025 (a typo in the title corrected).
Appendix
| Construct | No. of items | Construct Mean (S.D.) | Construct Cronbach Alpha | Item | Mean (S.D.) |
| When driving, I | |||||
| Self-reported distraction engagement | 7 | 17.95 (3.75) | 0.63 | Hold phone conversation | 2.65 (0.99) |
| Manually interact with a phone | 1.76 (0.94) | ||||
| Adjust the settings of in-vehicle technology | 3.43 (0.99) | ||||
| Read roadside advertisement | 2.66 (0.99) | ||||
| Continually check roadside accident scenes if there are any | 2.62 (0.94) | ||||
| Chat with passengers if you have them | 3.13 (1.02) | ||||
| Daydream | 1.70 (0.87) | ||||
|
I think it is all right to drive and |
|||||
| Attitude towards distractions | 6 | 14.89 (4.11) | 0.71 | Hold phone conversation | 1.94 (1.02) |
| Manually interact with a phone | 1.54 (0.81) | ||||
| Adjust the settings of in-vehicle technology | 2.97 (1.18) | ||||
| Read roadside advertisement | 2.66 (1.15) | ||||
| Continually check roadside accident scenes if there are any | 2.84 (1.14) | ||||
| Chat with passengers if you have them | 2.95 (1.14) | ||||
|
I believe I can drive well even when I |
|||||
| Perceived control of driving while engaged in distractions | 6 | 15.14 (4.55) | 0.79 | Hold phone conversation | 2.25 (1.16) |
| Manually interact with a phone | 1.63 (0.82) | ||||
| Adjust the settings of in-vehicle technology | 3.02 (1.19) | ||||
| Read roadside advertisement | 2.58 (1.12) | ||||
| Continually check roadside accident scenes if there are any | 2.65 (1.09) | ||||
| Chat with passengers if you have them | 3.01 (1.20) | ||||
|
Most drivers around me drive and |
|||||
| Injunctive social norms associated with distraction engagement | 6 | 20.41 (4.12) | 0.75 | Hold phone conversation | 3.61 (1.20) |
| Manually interact with a phone | 2.64 (1.24) | ||||
| Adjust the settings of in-vehicle technology | 3.95 (1.08) | ||||
| Read roadside advertisement | 3.02 (0.89) | ||||
| Continually check roadside accident scenes if there are any | 3.26 (0.87) | ||||
| Chat with passengers if you have them | 3.92 (0.94) | ||||
|
Most people who are important to me think it is all right for me to drive and |
|||||
| Descriptive social norms associated with distraction engagement | 6 | 14.21 (4.13) | 0.77 | Hold phone conversation | 1.94 (0.96) |
| Manually interact with a phone | 1.59 (0.76) | ||||
| Adjust the settings of in-vehicle technology | 2.82 (1.19) | ||||
| Read roadside advertisement | 2.39 (0.96) | ||||
| Continually check roadside accident scenes if there are any | 2.57 (1.08) | ||||
| Chat with passengers if you have them | 2.90 (1.11) | ||||
|
While driving I find it distracting when |
|||||
| Susceptibility to involuntary distraction | 7 | 20.77 (6.39) | 0.83 | my phone is ringing | 3.18 (1.28) |
| I receive an alert from your phone | 3.11 (1.44) | ||||
| I am listening to music | 2.70 (1.36) | ||||
| I am listening to talk on radio | 2.82 (1.38) | ||||
| There are roadside advertisements | 2.79 (1.28) | ||||
| There are roadside accident scenes | 3.29 (1.24) | ||||
| A passenger speaks to me | 2.87 (1.14) | ||||
| Variable | Step | B | Beta | R2 | ∆R2 |
| Gender | 1 | -2.455 | -.232** | .150 | .150** |
| Age | -.099 | .028** | |||
| Highest education attained | .086 | .027 | |||
| Driver type | -1.100 | -.143 | |||
| Vehicle transmission type | .009 | .003 | |||
| Driving experience | .018 | .004 | |||
| Driving hours per week | .002 | .071 | |||
| Type of vehicle occupant conveyed | .650 | .106 | |||
| Past mobile phone-related crash experience | -1.497 | -.160* | |||
| Driving on busy dual-lane highway with fast-moving traffic on both sides | 2 | .191 | .056 | .253 | .103** |
| Driving on a rural, less busy road | .299 | .113 | |||
| Driving on an urban road with heavy traffic but at a slowdown | .384 | .157* | |||
| Driving in a motorway setting with light traffic | .410 | .144* | |||
| Attitude | 3 | .251 | .276** | .492 | .239** |
| Perceived control | .087 | .106 | |||
| Injunctive social norms | .165 | .181** | |||
| Descriptive social norms | .039 | .043 | |||
| Involuntary distraction | -.101 | -.184** |