Estimating Intersections' Near-Crash Conflicts With the Drone-Based Image-Recording Data
Abstract
Recognizing the fact that the information from historical crash data cannot sufficiently reflect the risk level of target intersections under the current driving populations, some traffic safety researchers proposed to use various surrogate measures of safety (SMoS) from either roadside video records or simulation results for estimating near-crash conflicts and performing proactive safety assessment. Along the same line of research but taking advantage of the high-quality drone-based image-recording data (DIRD), this study presents a new effective surrogate variable, named ‘Extra Brake Required to Avoid a Crash’ (EBRAC), which offers a convenient, reliable, and direct tool for traffic professionals to perform the same analyses and risk rankings for resource allocation. The proposed new surrogate variable, featuring its direct relevance to road users’ maneuvers, e.g. braking from high-precision time-varying braking rate information uniquely available from the DIRD, has reflected crash-prone contributors attributed to driving behaviors and intersections’ overall environments. Hence, after proper field calibration, the proposed method based on EBRAC is directly applicable for estimating near-crash conflicts at other intersections in the same region without further adjustment or employing other advanced statistical techniques to integrate the information from multiple safety surrogates. The effectiveness of the proposed method with the new safety surrogate has been evaluated with field data from five intersections and 20 approaches; the results confirm that its performances, evaluated with two popular statistical tests, are either comparable to or better than the two state-of-the-art methods.
1. Introduction
To optimize the allocation of limited resources for improving safety at candidate intersections, traffic safety professionals have invested substantial effort in developing effective methods for assessing safety and prioritizing intersections based on their risk levels. In developing such methods and conducting the essential analysis, an intersection’s crash history has been widely viewed by the traffic community as essential data (AASHTO, 2014). The random fluctuating nature of crash data reflected in the historical pattern and the lack of sufficient information to reflect the risk-prone behaviors of the current driving populations for the design of countermeasures, however, renders some safety researchers to pursue various alternatives for the same purposes (Zheng et al., 2014). The design of various types of surrogate variables with the traffic conflict technique (TCT) to capture near-crash conflicts is one of the state-of-the-art methods increasing popularity in the traffic safety community. For instance. It has been used for safety assessment and improvement for decades in Sweden (Laureshyn & Várhelyi, 2018), the Netherlands (Kraay et al., 2013), and Canada (Brown, 1994; Cooper, 1984; Sayed & Zein, 1999; Zheng et al., 2014). Note that among various definitions of ‘conflict’ among a wealth of studies, this study applies the definition that was defined collectively by the experts from the safety research community (Amundsen & Hyden, 1977). Specifically, this study has applied the definition from the consensus of scholars and practitioners in 1977 – ‘A traffic conflict is an observable situation in which two or more road users approach each other in space and time to such an extent that there is a risk of collision if their movements remain unchanged.’ (Amundsen & Hyden, 1977)
The notion of TCT, firstly proposed in General Motors Laboratory (Perkins & Harris, 1967, 1968) and enhanced in various follow-up studies (Migletz et al., 1985; Zegeer & Deen, 1977), is to deploy human observers to identify unsafe vehicle maneuvers within a target intersection. Recognizing the subject nature of observations by the roadside observers and the resulting biases on the risk assessment, some researchers proposed the use of surrogate variables (Allen et al., 1978; Hayward, 1971; Laureshyn et al., 2010; Minderhoud & Bovy, 2001; Ozbay et al., 2008; Saccomanno et al., 2008) to measure near-crash conflicts which could, to some extent, reflect the intersection’s risk level if measured reliable and precisely.
Most surrogate variables reported in the literature are time-varying in nature, varying with the trajectories and interactions between a pair of vehicles, and mostly fluctuating within a normal range, but may evolve to unsafe conditions of a crash if swinging to the extreme level. Most of such surrogate variables for safety assessment in state-of-the-art studies can be characterized into the following categories:
-
Time-to-Collision (TTC) is the time required for two vehicles to collide if they continue their present speeds and path, also denoted as Time-to-Accident (TA) in the work by Hayward (1971). Other extensions along this line include the Modified TTC (MTTC) (Minderhoud & Bovy, 2001), Time-Exposure TTC (TET), and Time-Integrated TTC (TIT) (Ozbay et al., 2008).
-
Post-Encroachment Time (PET) is the time gap between the departure of the first vehicle from the common spatial zone (conflict area) and the arrival of its immediate follower (Allen et al., 1978). Its modified version has been applied to evaluate conflicts at roadway crossings with oblique angles (Laureshyn et al., 2010).
-
Deceleration Rate to Avoid Collision (DRAC), also known as the Required Braking Rate (RBR) the follower must exercise to avoid a crash when its vehicle is on the collision course with another (Saccomanno et al., 2008).
Notably, different surrogate variables, depending on their target measurements, can only capture the type of near-crash conflicts from their respective perspective. Hence, to fully reflect all possible conflicts over time and reliably quantify the risk level of the intersection of interest, a body of traffic researchers have proposed various methods to best use the information collectively revealed from the selected safety surrogates. Most of such proposed methods are developed along the following two lines:
-
Analysis of the joint probability that applies the probability theory to project the crash frequency, based on the information reflected in each surrogate variable and their relations with the others (Wang & Stamatiadis, 2014; Zheng et al., 2018, 2019; Zheng and Sayed, 2019; Tarko, 2019). For example, Zheng and Sayed (2019), grounded in the extreme value theory (Songchitruksa & Tarko, 2006; Zheng et al., 2024), proposed a method with bivariate extreme value theory that can infer the unobservable crashes by fitting and extrapolating the multivariate distributions on conflicts defined by multiple surrogate variables.
-
Mapping of the safety indices that generates a single index for risk assessment by assigning proper scores for different measurements associated with a surrogate variable. For example, the Swedish Traffic Conflict Technique applies not only TTC but also the speed data to produce the final safety index (Laureshyn & Várhelyi, 2018). Ismail et al. (2011) proposed several methods that use the mapping function or scoring matrices to produce the Severity Index generated from various surrogate variables.
Note that despite the theoretical appeal of such surrogate-based methods for risk assessment, their effectiveness is conditioned on the quality and precision of the available data. Although the advent of new technologies offers a more reliable way such as automatic identification for extracting required measurements from roadside-mounted cameras (Autey et al., 2012; Ismail et al., 2009, 2010; Oh et al., 2009; Saunier et al., 2010; Saunier & Sayed, 2007, 2008; Sayed et al., 2012; Songchitruksa & Tarko, 2006; Zaki et al., 2014), such data from the recorded images often cannot offer the desirable level of quality and precision, due to homography constrained by insufficient or imprecise references, occlusion of vehicles, and lens distortion (Ismail et al., 2013).
Another alternative to have the information for estimating such conflicts is to employ microscopic traffic simulations (Gettman et al., 2008). Such simulation-output data, despite the popularity in the state of the practice (Hummer et al., 2010; Kim et al., 2018; KLJ, 2018), are reliable only if the employed microscopic traffic simulation program has been rigorously calibrated with the field data to faithfully reflect the target driving populations’ car-following and lane-changing behaviors. However, the efforts involving data collection and rigorous parameter calibration may exceed the workload and cost associated with the direct measurement of surrogate variables from the typical roadside cameras. Moreover, the behavioral mechanisms embedded in most existing microscopic traffic simulation software are proposed mainly for traffic delay and queue analysis, but not developed with the required details and precision to yield the fidelity sufficient for estimating the likelihood of having a crash or near-crash conflict. Nonetheless, some indices, due to their practicability in the fields, have been applied to real-world decades later. For example, DRAC, originally developed by the simulation community (Archer, 2005; Darzentas et al., 1980; Saccomanno et al., 2008), has been applied in the real world by traffic safety experts due to technology advancements, e.g. conflict study for urban signalized intersections in Zheng et al. (2019) and Fu and Sayed (2021).
1.1. Drone-based image-recoding data (DIRD)
Unmanned Aerial Vehicles, or drones, featuring their functions to eliminate occlusion and imprecision caused by the obliqueness of side-mounted cameras, have emerged as a useful and reliable technology for various transportation applications. The high mobility, area-wide vision, and nearly orthogonal shooting angle offered by drones allow transportation professionals cost-effective means to acquire reliable, and high-precision data over a wide range around a target transportation system. In reviewing the literature, it is noticeable that drone data have been best used in the area for vehicle detection and the extraction of traffic states (e.g. speed) (E. N. Barmpounakis et al., 2016; Ke et al., 2017, 2018; Khan et al., 2017; Xu et al., 2017), followed by the studies for traffic flow analysis (E. Barmpounakis et al., 2020; E. Barmpounakis & Geroliminis, 2020; Coifman et al., 2004), including lane-changing behavior, traffic monitoring, and traffic surveillance. The DIRD has also been increasingly used in traffic safety, accident scene investigation (Ardestani et al., 2016; Pérez et al., 2019), and risk assessment of roadway segments such as on freeways merging areas, and hazardous obstruction identification, etc. (A. Y. Chen et al., 2020; P. Chen et al., 2017; Gu et al., 2019; Sharma et al., 2017; L. Zhang et al., 2013; S. Zhang & Sze, 2024). However, such an effective technology and its produced high-precision data, DIRD (Huang et al., 2023), or other aerial-based data collection (Zheng et al., 2024) have not yet been fully utilized in intersections safety assessments, and identification of near-crash patterns for the design of proper countermeasures.
1.2. Research objectives
In light of DIRD’s precision and reliability and the effectiveness of the Traffic Conflict Technique with various surrogates for safety analysis, the objectives of this study are to first shed the light on the DIRD’s effectiveness for measuring existing safety surrogates in the literature and then propose a new surrogate variable for estimating near-crash intersection conflicts. The proposed new safety surrogate, named ‘Extra Brake Required to Avoid a Crash’ (EBRAC), can circumvent the need to apply additional methods for integrating information from multiple surrogate variables, and offer a direct yet effective way for reliable assessment of a target intersection’s risk level by best taking advantage of high-precision information uniquely available from the DIRD’s digitized results.
The next section will first describe the procedures for computing safety surrogate variables with DIRD. This is followed by a detailed presentation of the properties of the proposed EBRAC. The procedures for intersection risk assessment constitute the cores of the following section. The results of a case study are presented to demonstrate the effectiveness of the proposed EBRAC for estimating near-crash conflicts and for ranking risk levels among candidate intersections. Concluding comments and future research tasks are summarized in the last section.
2. Computation of safety surrogate variables with DIRD
The procedure to compute the safety surrogate measures, using DIRD, consists of the following three major stages: (1) field-data collection, (2) digitalized data generation, and (3) extraction of measurements for safety surrogate variables. A brief description of key tasks conducted at each stage is presented in sequence with the DIRD from an intersection (i.e. MD 198 and MD 650).
2.1. Field-data collection
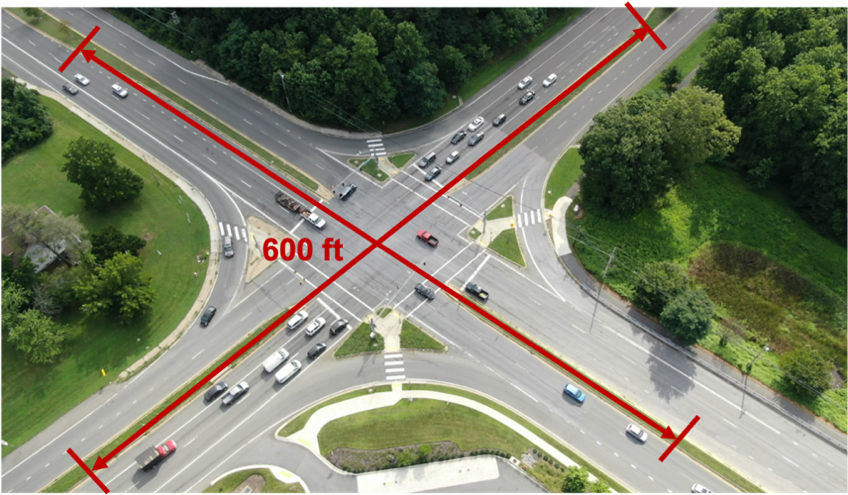
To cover as large an area as possible with the precision sufficient to capture subtle changes in a vehicle’s maneuvers, drones shall be deployed above the intersection with an angle greater than 45 degrees and the height capped by 400 (ft) as regulated by FAA (2021). By doing so, the approximate coverage width is 600 (ft) for each approach. Figure 1 shows an example (i.e. MD 198 at MD 650) of the drone-based field data.
2.2. Digitalized data generation
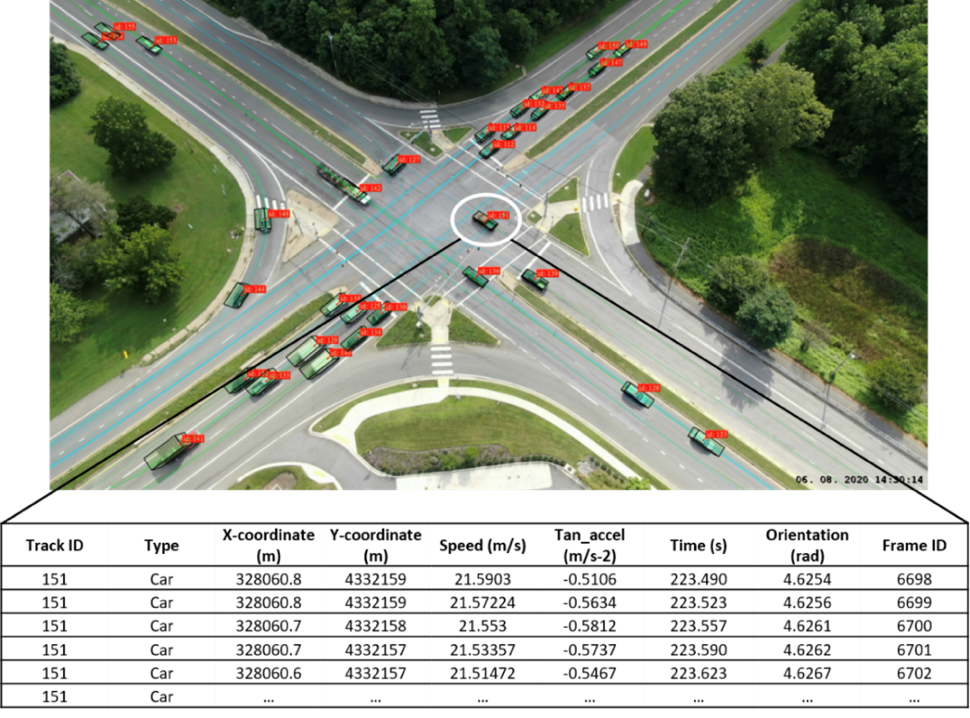
With the collected field data, one can proceed to digitalize the data to a sufficient precision level for measuring safety surrogates (RCE systems, 2019). The data for the intersection safety analysis and computation of most such surrogate variables includes (1) vehicle type; (2) time-dependent position of vehicles; (3) time-dependent speed of vehicles; (4) vehicle’s time-dependent tangential acceleration rate; and (5) vehicle’s time-dependent orientation. The sampling frequency of the video image is 30 (fps) with an increment of 0.0334 (sec). Figure 2 illustrates an example of video processing and data digitalization for a target intersection.
2.3. Extraction of data for safety surrogate measures
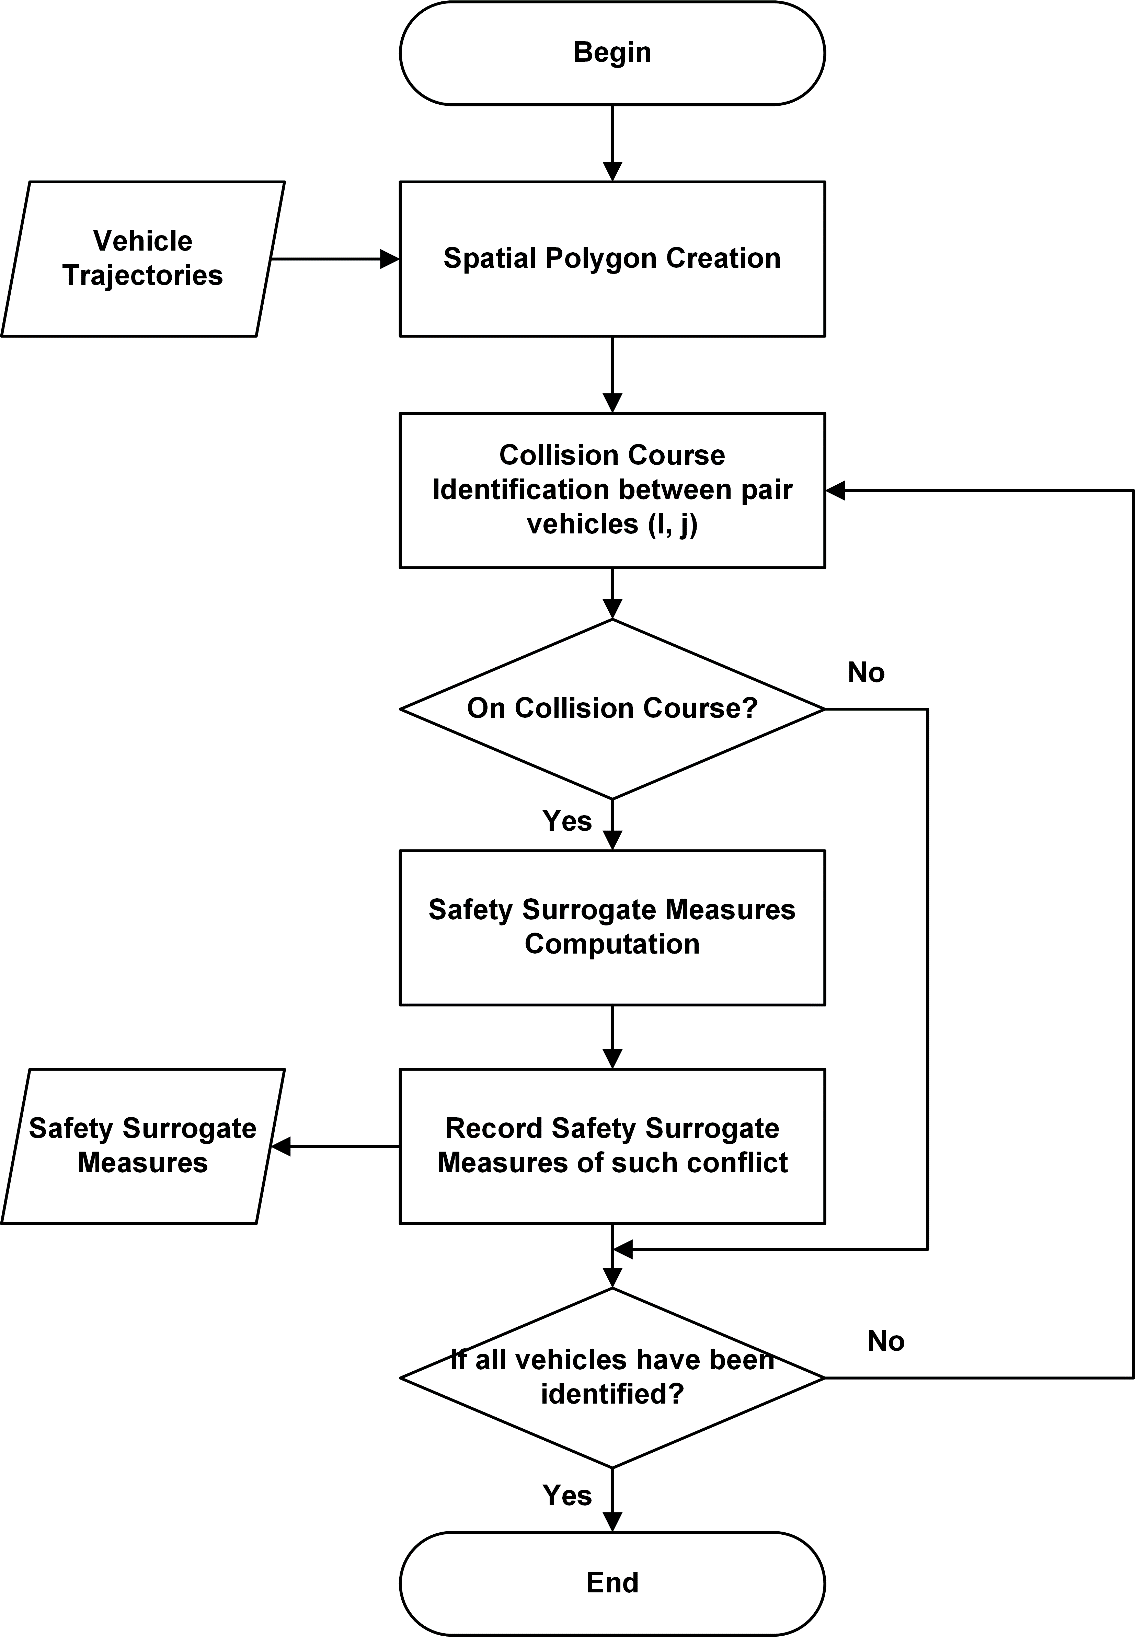
Figure 3 shows the operational flowchart for using the time-dependent vehicle’s motion variables to compute the safety surrogate variables for intersection safety analysis.
2.3.1. Spatial polygon creation
The original digitalized data from DIRD presents each vehicle with a single point, representing the centroid x-coordinate and centroid y-coordinate of the vehicle. Considering the presence of different vehicle types in the traffic stream, the study margins the vehicle’s file by treating each vehicle as rectangular with its dimension consistent with the standard size of each vehicle type (see Figure 4).
2.3.2. Collision course identification
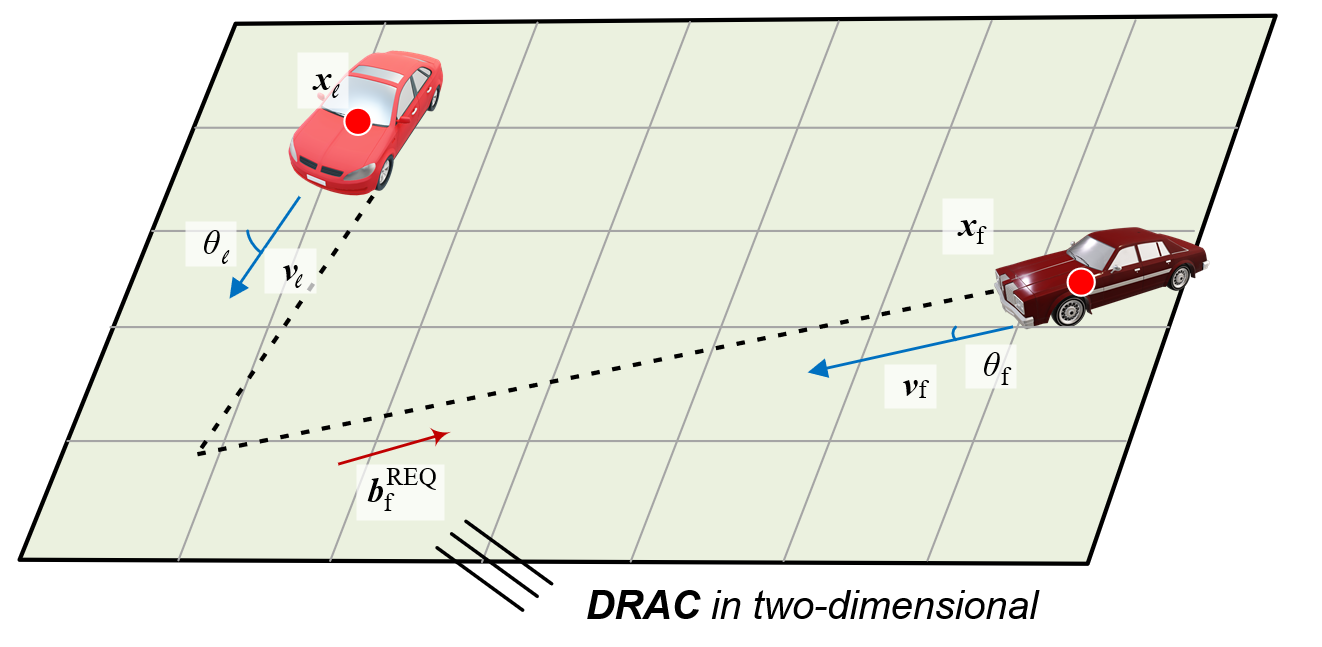
Note that in computing most safety surrogate variables (e.g. TTC and DRAC), each pair of vehicles for analysis should be on a collision course (Tarko, 2019). Such two vehicles, at time are on a collision course when there is a line connecting the following and the leading vehicles parallel to their relative velocity if both vehicles and respectively) do not change their velocities (Tarko, 2019). Thus, the collision course identification, as shown in Figure 5, can be identified with Eq. (1):
where and are the relative velocities of the following and leading vehicles along the x-axis and y-axis; represents how long the vector of the relative speed, , extends from an edge point of the following vehicle; and indicates one of the four boundaries used to define the leading vehicle. Note that the time variable is dropped for brevity hereafter if without ambiguity.
![Figure 4. Collision course between a pair of vehicles (adopted from [b@415407])](https://tsr.international/TSR/article/download/26744/version/36390/24464/75319/e000084_266146.png)
2.3.3. Safety surrogate variables computation
Note that since most surrogate variables computed from DIRD are two-dimensional in nature, those widely used surrogate variables, such as TTC and DRAC, should be carefully computed. In addition to those two widely used variables, this study further proposes a new surrogate, Extra Brake Required to Avoid a Crash (EBRAC), which can better take advantage of the DIRD for intersection safety assessment. To facilitate the following discussion, the key notations associated with safety surrogate variables are listed in Table 1.
| Notation | Description |
| The shortest distance to a collision between the leading and the following vehicles | |
| Relative velocity (vector) of the leading and the following vehicles | |
| Velocity (vector) of the following vehicle | |
| Velocity (vector) of the leading vehicle | |
| Velocity (vector) of the following vehicle given to avoid a crash | |
| Speed (scalar) of the following vehicle | |
| Speed (scalar) of the leading vehicle | |
| | | | Speed (scalar) of the following vehicle given to avoid a crash |
| Traveling distance of the following vehicle in a collision course | |
| Orientation of the following vehicle | |
| Orientation of the leading vehicle | |
| Minimum deceleration rate of the following vehicle to avoid a crash, DRAC | |
| Actual deceleration rate of the following vehicle |
Time-to-collision (TTC). TTC is defined as the remaining time to incur a crash if two vehicles maintain the same speed on a collision course without further actions. Using the information from DIRD, one can define TTC with Eq. (2):
where and denote the shortest distance to a collision and the relative velocity, respectively, between the leading and the following vehicles.
Deceleration Rate to Avoid a Crash (DRAC). DRAC is defined as the minimum deceleration rate to which the following vehicle needs to apply to avoid a crash with the leading vehicle. The work in Saccomanno et al. (2008) has developed DRAC’s one-dimensional form. This study firstly requests for a two-dimensional version of DRAC which can be computed from the fundamental kinetics of motion when all velocities are projected onto the same direction. Considering the orientation of the following vehicle, one can compute with Eq. (3):
where the traveling distance for the following vehicle to reach the conflict point can be calculated by using the information from TTC as shown in Eq. (4); and the speed of the following vehicle to avoid a crash, defined as the crash-free speed (CFS) and denoted as should equal the speed of the leading vehicle projected to the direction of the following vehicle (see Figure 5). One can compute the CFS with Eq. (5) by using the orientation of the following vehicle and the leading vehicle acquired from the DIRD:
Therefore, two-dimensional DRAC can be computed with Eq. (6)
Notably, Eq. (6) is consistent with literature applying 1-dimensional DRAC to rear-end risks (Saccomanno et al., 2008) as long as terms in cosine are forced to zero.
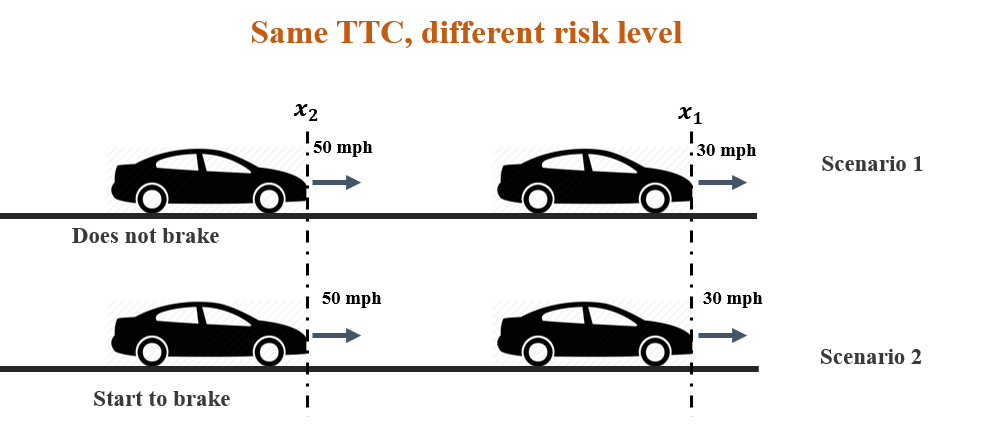
Extra Brake Required to Avoid a Crash (EBRAC). It is recognized that the two widely used safety surrogate variables (i.e. TTC and DRAC) are proposed within the constraints of most available empirical data which often lack reliable information for computing each vehicle’s acceleration/deceleration. As such, those surrogate variables may induce either miss-detections or false alarms with respect to the detection of conflicts for potential crashes. For instance, the two scenarios illustrated in Figure 6 would output the same TTC for each pair of vehicles, yet Scenario 1 should be viewed as unsafe due to the lack of braking action by the following vehicle.
To circumvent such limitations, some studies suggest grading different TTC under various traffic conditions, such as the Swedish Traffic Conflict Technique scores TTC differently under different speeds (Laureshyn & Várhelyi, 2018). Alternatively, this study presents a new surrogate variable, EBRAC, by taking advantage of the uniquely available information from the high-quality DIRD. By applying the actual brake rate computed from the DIRD, EBRAC, defined as “the difference between the actual brake rate of the following vehicle and its minimum required deceleration rate to avoid a crash (DRAC) with the leading vehicle”, can be formulated as follows:
where is the actual brake rate of the following vehicle at time t; and is the deceleration rate of the following vehicle to avoid a crash (DRAC).
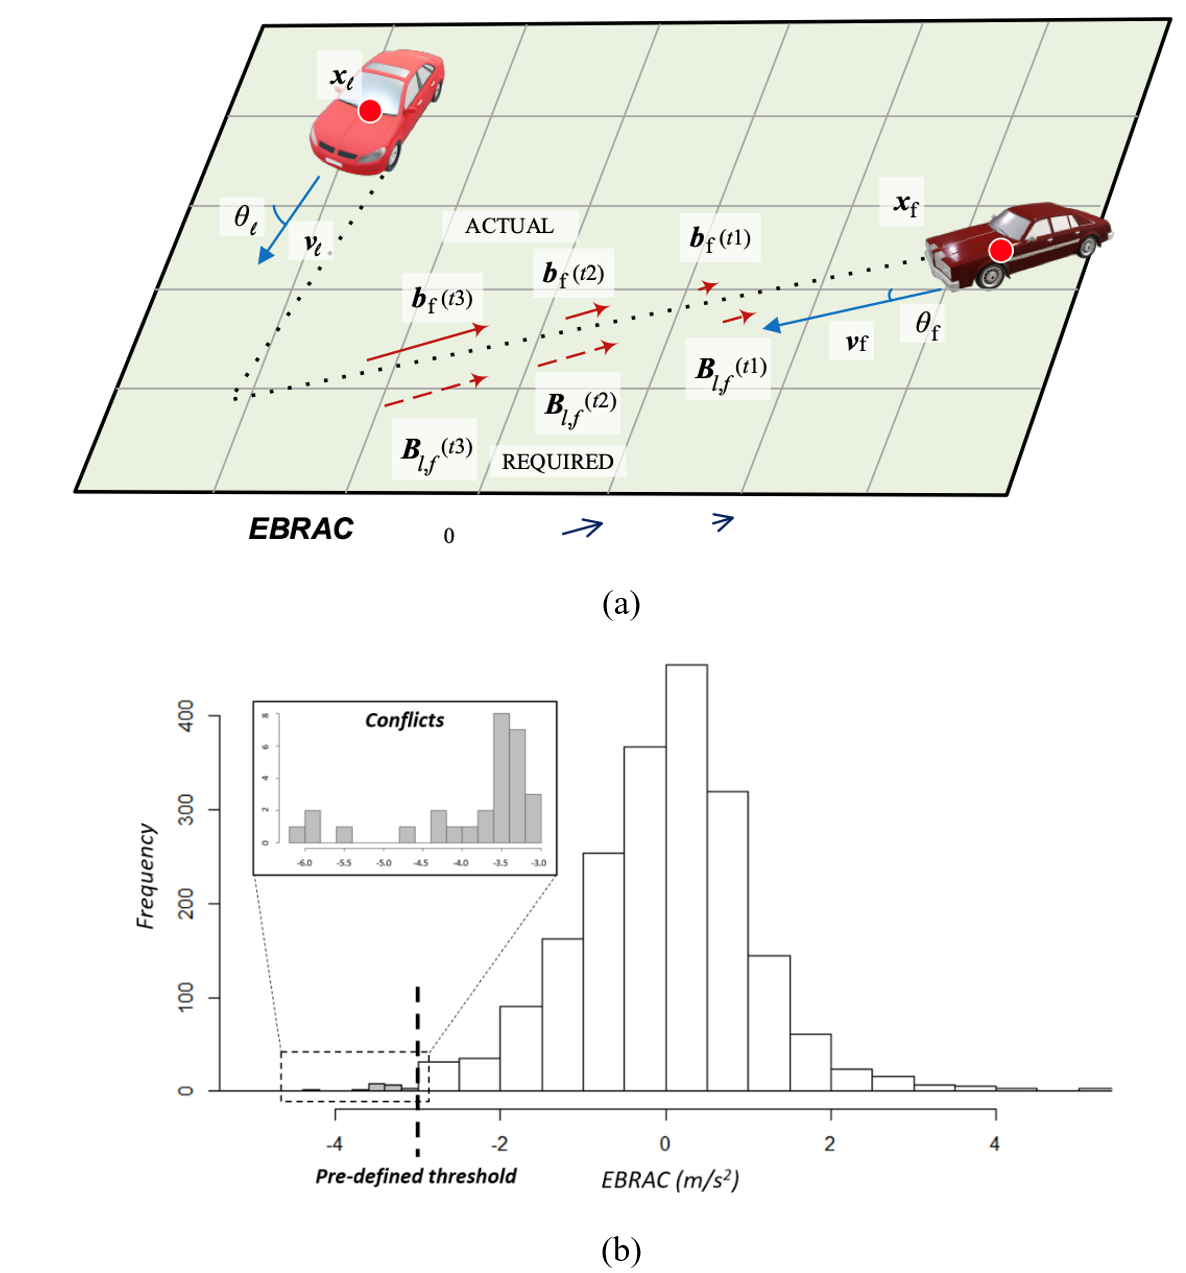
It can be observed that two vehicles are away from a collision when if either the leading vehicle accelerates or the following vehicle decelerates. In contrast, two vehicles are moving toward the collision when Figure 7(a) depicts the time-dependent EBRAC values, highlighting an insufficient braking response initially triggered by the vehicles at t1, which worsens at t2 before the road users ultimately navigate out of the unsafe situation. Figure 7(b) shows the distribution of the proposed EBRAC, computed from the DIRD at an intersection over 60 minutes, which is centered at zero during normal operations. Note that the small sample points shown in a gray color represent those potential conflicts (or near-crashes) from the observed vehicle interactions, where their EBRAC values at the time points of their interaction are below the predefined threshold.
To more effectively measure the risk between vehicles in a collision course, one can take the two following actions to facilitate the computation of EBRAC:
-
Select only those toward collisions and
-
Select those vehicle pairs with TTC lower than the threshold to filter out those pairs with sufficient reaction time to take the necessary brake action, as used in the existing studies (Hogema & Janssen, 1996)
Integrating Eq. (7) with the computations of DRAC (Eqs. (3)-(6)) and considering only vehicle pairs toward collisions, one can finalize the computation of EBRAC with Eq. (8):
3. Properties of EBRAC with DIRD
3.1. Motions of physics
The proposed EBRAC seemly has the same physics dimension as DRAC, but the fundamental differences are:
-
While DRAC has the dimension of deceleration, it is derived solely from speed and position data in the field, not from directly observed deceleration. In contrast, EBRAC utilizes high-precision deceleration data collected by drones, providing a more accurate reflection of braking behavior.
-
DRAC represents the required actions of road users but does not directly incorporate their immediate responses. In comparison, EBRAC captures the time-varying actions of road users and their adherence to the required actions, offering a dynamic view of their responses.
3.2. Time-dependent properties
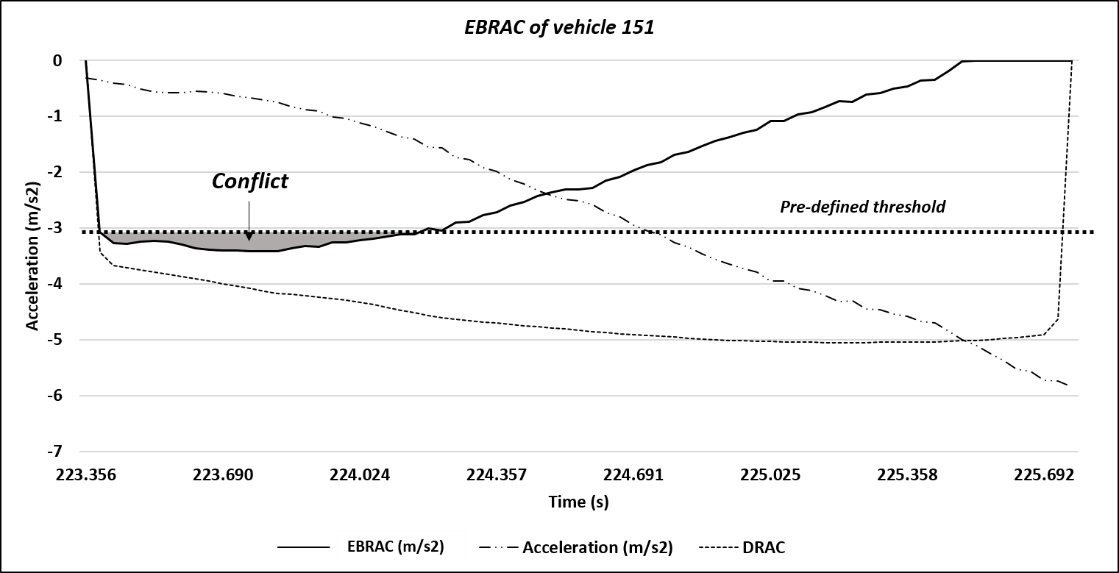
Figure 8 illustrates a time-dependent EBRAC by using the same example presented previously. Likewise, a conflict is identified if the EBRAC between a pair of vehicles is below a predefined threshold. One can observe from Figure 8 that vehicle 151 is trapped in a collision course and it is identified as incurring a conflict by EBRAC at t = 223.36 (sec). Then at t = 223.69 (sec), the driver sensed the risk and started to increase the brake rate, and at about t = 224.30 (sec) the collision course was no longer at risk, because the reaction of the driver was sufficient to terminate the event (i.e. its EBRAC exceeded the pre-defined threshold). Such a sequence of actions is normally within a small time interval, and the resulting EBRAC intuitively reflects the collective manifestation of various involving factors, including the right-of-way violation, short perception-reaction time, braking capability of vehicles, and drivers’ aggressiveness. In brief, the proposed EBRAC has the following desirable properties for safety assessment:
-
EBRAC excerpts the merits of existing indicators. As shown in Eq.(8), at drivers’ inaction before reaction, it has the characteristic of DRAC, meanwhile the threshold (T’) of two-dimensional TTC, takes the role in the initial screening.
-
EBRAC generates a more precise period of conflict. As shown in Figure 8, after t = 224.30s, conventional DRAC still regards the condition as unsafe since it does not consider the driver’s reaction. As a result, DRAC could not call the end of the conflict until around = 225.7s; and
-
Most surrogate measures, such as DRAC and TTC, have higher thresholds to indicate an unsafe environment under wet pavement. However, EBRAC has the possibility that such may not be the case since it is the differences between ‘actual brake’ and ‘required brake (DRAC)’, so any danger from the wet pavement such that bio-mechanical deterioration will reflect by rise EBRAC itself, but may not be the threshold. More evidence may be needed, such as collecting data on wet pavement conditions.
3.3. Boundary between conflicts and crashes
Some SMoS can be extended to more sophisticated methods such as Extreme Value Theory (EVT) for TTC as the boundary between a crash and an ordinary conflict is at TTC = 0 which has a clear cut between crashed or not. However, EBRAC does not have such properties since once a conflict is not recoverable and becoming a crash, its EBRAC will deviate further from zero.
4. Procedures for intersection risk assessment
With the digitalized DIRD and the proposed safety surrogate variable, EBRAC, one can apply the following procedures for the analysis and ranking of candidate intersections for safety assessment.
Step-1: Identify the time-varying events from vehicle interactions and denote those as conflicts when their associated safety surrogate variables exceed the pre-specified thresholds. Highway Safety Manual (AASHTO, 2014) has documented that about 90% of drivers decelerate at rates greater than when facing an unexpected object. To reflect the required braking actions by the drivers, the optimal threshold for use in the conflict detection with EBRAC shall lie between -3.4 to 0.0 which can be precisely calibrated with field data.
Step-2: Quantify an intersection’s risk level by collecting its estimated “hourly number of conflicts.”
Step-3: Select the threshold of EBRAC that yields the highest correlation between the “hourly number of conflicts” and the historical crash frequencies.
Step-4: Evaluate the effectiveness of the calibrated EBRAC for intersection risk analysis with historical crash records, such an evaluation can first be done with respect to each approach (i.e. considers only the vehicles’ interactions from the same approach of vehicles), and then extended to the entire intersection (i.e. considers all the vehicles’ intersections within the functional area of an intersection (AASHTO, 2014)).
Step-5: Evaluate the EBRAC’s effectiveness with the following two popular statistical tests:
Correlation test: Evaluate the effectiveness of EBRAC based on the correlation between “hourly number of conflicts” and historical crash frequency information (Allen et al., 1978; Brown, 1994; Migletz et al., 1985; Ozbay et al., 2008; Zegeer & Deen, 1977; Zheng et al., 2019); and
Ranking test: Evaluate the effectiveness of EBRAC with the Spearman rank correlation between the resulting ranks of the estimated “hourly number of conflicts” and the actual ranks revealed from the historical crash frequency information (Brown, 1994; Gettman et al., 2008; Migletz et al., 1985; Wang & Stamatiadis, 2014).
Note that the proposed EBRAC and its parameter after successfully going through the above evaluation procedures (i.e. Steps-3 and Step-4) shall be ready to apply at other candidate intersections in the same region.
5. Case study
This section first presents the proposed EBRAC’s applications at a set of intersections, using the critical information uniquely available from DIRD, and then compares its performance with two benchmark models for the analysis and ranking of the intersection risk assessment.
5.1. Study site selection
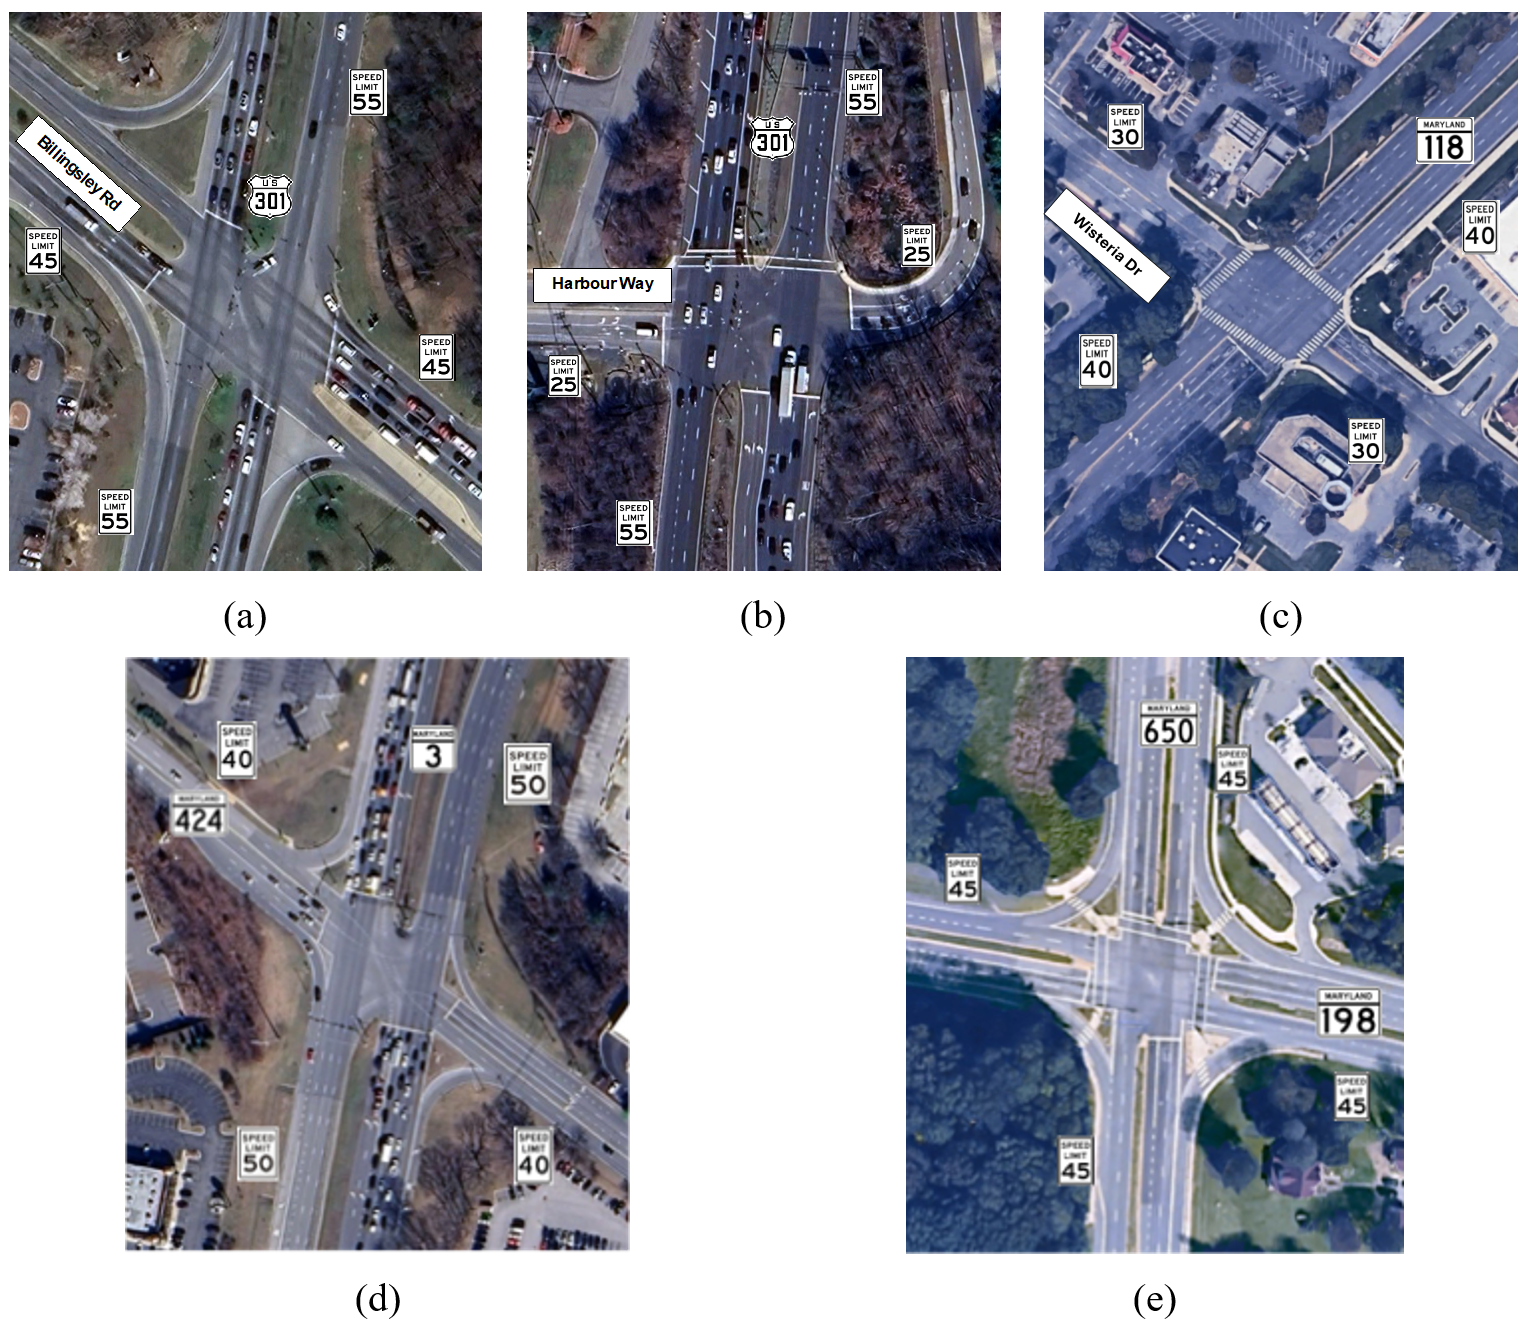
This study, to demonstrate the application of the proposed model, includes five intersections selected based on crash data and annual average daily traffic (AADT) obtained from Maryland’s Open Data Portal (Maryland Department of State Police, 2024; Maryland Open Data Portal, 2024). The associated information and the recorded traffic volume from drones for each approach of each intersection are shown in Table 2. The geometries and speed limits of five intersections are demonstrated in Figure 9, covering the combinations of high-speed main street and high-speed minor street, high-speed main street and low-speed minor street, as well as medium-speed main street and medium-speed minor street.
| Site | Intersection | Traffic volume (veh/hr) | Crash frequency (# crashes/year) | ||||||||
| Intersectiona | Approachb | Intersection | Approach | ||||||||
| From North | From South |
From East |
From West |
From North |
From South | From East |
From West |
||||
| 1 | US301@ Billingsley Rd. |
3,550 | 1,022 | 1,097 | 682 | 528 | 8.33 | 3.33 | 2.67 | 1.67 | 0.67 |
| 2 | US301@ Harbour Way |
4,190 | 2,349 | 2,184 | 204 | 451 | 10.20 | 3.40 | 6.00 | 0.60 | 0.20 |
| 3 | MD118@ Wisteria Dr. |
2,261 | 1,151 | 718 | 429 | 483 | 2.80 | 1.20 | 0.80 | 0.40 | 0.40 |
| 4 | MD3@ MD424 |
5,979 | 2,469 | 2,506 | 749 | 439 | 15.40 | 7.00 | 7.00 | 0.60 | 0.80 |
| 5 | MD198@ MD650 |
1,983 | 383 | 525 | 649 | 484 | 4.00 | 0.80 | 1.00 | 1.00 | 1.20 |
5.2. Calibration and evaluation of EBRAC
Similar to other safety surrogate variables, the effectiveness of EBRAC varies with the calibration and selection of its parameter. The threshold for EBRAC, ranging from to in this study to identify unsafe operations (i.e. conflict) are analyzed; and the results for the intersection assessment are presented in Table 3. For instance, there are 8 conflicts detected by EBRAC with a threshold of among all vehicles traveling from North of Site 1.
As shown in Table 3, the number of conflicts detected by EBRAC with different thresholds and the historical crash frequency are highly correlated, ranging from 0.881 to 0.897. Noticeably, the threshold of for EBRAC has the highest statistically significant correlation coefficient in the approach-based assessment. Similar results can be observed for the intersection-based assessment, where the threshold of yields the highest correlation between the crash history and estimated conflicts. As such, the EBRAC with the threshold of is used for assessing and ranking the risk of candidate intersections in the ensuing section.
| Background | EBRAC with DIRD, # conflicts (hr-1) |
|||||
| Site | Intersection | Crash frequency (# crashes/year) |
Threshold (-3.4 m/s2) |
Threshold (-3.0 m/s2) |
Threshold (-2.6 m/s2) |
|
| Approach-based assessment | ||||||
| 1 | US301 @ Billingsley Rd | From North | 3.33 | 7 | 8 | 12 |
| From South | 2.67 | 4 | 4 | 7 | ||
| From East | 1.67 | 8 | 14 | 29 | ||
| From West | 0.67 | 1 | 1 | 3 | ||
| 2 | US301 @ Harbour Way | From North | 3.40 | 7 | 15 | 26 |
| From South | 6.00 | 16 | 22 | 31 | ||
| From East | 0.60 | 2 | 4 | 5 | ||
| From West | 0.20 | 1 | 2 | 3 | ||
| 3 | MD118 @ Wisteria Dr | From North | 1.20 | 5 | 7 | 11 |
| From South | 0.80 | 1 | 3 | 5 | ||
| From East | 0.40 | 1 | 1 | 3 | ||
| From West | 0.40 | 3 | 3 | 5 | ||
| 4 | MD3 @ MD424 | From North | 7.00 | 9 | 16 | 24 |
| From South | 7.00 | 16 | 23 | 26 | ||
| From East | 0.60 | 0 | 0 | 1 | ||
| From West | 0.80 | 1 | 2 | 2 | ||
| 5 | MD198 @ MD650 | From North | 0.80 | 0 | 1 | 1 |
| From South | 1.00 | 0 | 2 | 3 | ||
| From East | 1.00 | 1 | 3 | 6 | ||
| From West | 1.20 | 1 | 5 | 6 | ||
| Pearson Correlation | 0.894 | 0.897 | 0.881 | |||
| P-value | <0.001*** | <0.001*** | <0.001*** | |||
| Intersection-based assessment | ||||||
| 1 | US301 @ Billingsley Road | 8.3 | 36 | 44 | 81 | |
| 2 | US301 @ Harbour Way | 10.2 | 37 | 55 | 95 | |
| 3 | MD118 @ Wisteria Drive | 2.8 | 22 | 25 | 37 | |
| 4 | MD3 @ MD424 | 15.4 | 52 | 72 | 103 | |
| 5 | MD198 @ MD650 | 4.6 | 15 | 24 | 34 | |
| Pearson Correlation | 0.946 | 0.986 | 0.928 | |||
| P-value | 0.015* | 0.002* | 0.023* | |||
5.3. Effectiveness for safety assessment risk ranking
To evaluate the effectiveness of the proposed EBRAC for risk assessment and ranking of candidate intersections, this study has compared its performance with the following two state-of-the-art models:
-
The bivariate extreme value model (Zheng et al., 2019) generates the predicted number of crashes based on the joint probability of multiple surrogate measures (i.e. TTC and DRAC). The adoption of extreme value theory allows for extrapolating crash probabilities from the distribution of observed traffic conflicts. Within a bivariate framework, an event characterized by the joint behavior of two SMoS , is considered extremal when either or exceeds specified thresholds; and
-
The Multistep Integration Method (Ismail et al., 2011) generates each conflict indicator value from various SMoS using their respective pre-defined mapping functions, . Subsequently, a representative value is derived from the set of individual mappings across different conflict indicators.
5.3.1. Approach-based assessment
Table 4 shows the comparison results for the approach-based assessment, revealing the following key findings:
-
The predicted crash frequency, severity index, and the number of conflicts produced from all models are all highly correlated with the crash frequency (ranging from 0.702 to 0.897) and are all statistically highly significant (p<0.001).
-
The ranking performances of all models with respect to the five candidate intersections are all highly correlated with the ranking results with crash frequency (i.e. rank correlation coefficients of 0.686, 0.830, and 0.838, respectively for Bivariate EVT (Zheng et al., 2019), Multistep Integration (Ismail et al., 2011), and the proposed EBRAC). Notably, with the DIRD, the correlations between crash history and predicted crashes with the Bivariate EVT are higher than those reported in the literature (from 0.159 to 0.429). Such improvements are likely attributable to the high quality of drone data that can circumvent some data measurement noises.
-
The ranking effectiveness of the proposed EBRAC model, as shown in Table 4, is comparable to the results of the Multistep Integration (Ismail et al., 2011) and outperforms the Bivariate EVT (Zheng et al., 2019), as evidenced by the results of Spearman’s Rank Correlation analysis. Certainly, both models have their merits for use in the approach-based assessment, but the proposed EBRAC offers a new alternative that can best take advantage of quality data from DIRD for convenient yet effective applications.
| Background | Bivariate EVT [@415419] |
Multistep integration [@415376] |
Proposed EBRAC with DIRD |
||||||
| Intersections | Approaches | Crash frequency (# crashes/year) |
# crashes (year-1) | Severity Index | # of conflicts (hr-1) | ||||
| US301 @ Billingsley Rd |
From North | 3.33 | 5 | 11.55 | 4 | 182.80 | 7 | 8 | 6 |
| From South | 2.67 | 6 | 15.58 | 3 | 119.60 | 8 | 4 | 9.5 | |
| From East | 1.67 | 7 | 8.64 | 6 | 239.80 | 5 | 14 | 5 | |
| From West | 0.67 | 15 | 1.94 | 16 | 98.60 | 13 | 1 | 18 | |
| US301 @ Harbour Way |
From North | 3.40 | 4 | 10.46 | 5 | 315.20 | 3 | 15 | 4 |
| From South | 6.00 | 3 | 16.65 | 2 | 242.80 | 4 | 22 | 2 | |
| From East | 0.60 | 16.5 | 1.56 | 17 | 52.80 | 20 | 4 | 9.5 | |
| From West | 0.20 | 20 | 2.29 | 15 | 96.20 | 14 | 2 | 15 | |
| MD118 @ Wisteria Dr |
From North | 1.20 | 8.5 | 2.97 | 13 | 212.00 | 6 | 7 | 7 |
| From South | 0.80 | 13 | 5.98 | 8 | 109.60 | 12 | 3 | 12 | |
| From East | 0.40 | 18.5 | 3.67 | 12 | 66.00 | 18 | 1 | 18 | |
| From West | 0.40 | 18.5 | 1.32 | 18 | 79.40 | 16 | 3 | 12 | |
| MD3 @ MD424 |
From North | 7.00 | 1.5 | 4.93 | 9 | 446.20 | 1 | 16 | 3 |
| From South | 7.00 | 1.5 | 17.00 | 1 | 371.00 | 2 | 23 | 1 | |
| From East | 0.60 | 16.5 | 8.45 | 7 | 118.60 | 9 | 0 | 20 | |
| From West | 0.80 | 13 | 3.82 | 11 | 93.20 | 15 | 2 | 15 | |
| MD198 @ MD650 |
From North | 0.80 | 13 | 0.00 | 19.5 | 55.00 | 19 | 1 | 18 |
| From South | 1.00 | 10.5 | 0.00 | 19.5 | 75.20 | 17 | 2 | 15 | |
| From East | 1.00 | 10.5 | 2.81 | 14 | 110.80 | 10 | 3 | 12 | |
| From West | 1.20 | 8.5 | 4.14 | 10 | 110.00 | 11 | 5 | 8 | |
| Pearson Correlation Coefficient | 0.702 | 0.881 | 0.897 | ||||||
| P-value | <0.001*** | <0.001*** | <0.001*** | ||||||
| Spearman Rank Correlation Coefficient | 0.686 | 0.830 | 0.838 | ||||||
| P-value | <0.001*** | <0.001*** | <0.001*** | ||||||
5.3.2. Intersection-based assessment
Table 5 presents the comparison results between three models under the intersection-based assessment, some interesting findings are summarized below.
-
Under the constraints of limited sample size, the produced measurements from the three models are highly correlated with the historical crash frequency data (0.760, 0.811, and 0.986, respectively, for Bivariate EVT, Multiple Integration, and EBRAC), but only the proposed EBRAC shows a statistically significant correlation (at 0.05 level).
-
The proposed EBRAC, having the Spearman rank correlation coefficient of 0.900, outperforms the other two benchmark models (0.700 and 0.700). The discrepancy in the Spearman correlation coefficient between these three models is statistically significant.
-
In addition, the top 3 intersections of higher crash frequency are ranked consistently by the proposed EBRAC, indicating its effectiveness even for the application of a limited sample size.
The better performance of the proposed EBRAC at the intersection-level risk assessment can be attributable to:
-
The calibration of the state-of-art models in the literature, due to the limited vision coverage available from the mounted cameras for data collection, is mostly focused on individual approaches, instead of the entire intersection; and
-
The proposed EBRAC with the precise movements of vehicles over the entire intersection can identify all conflicts within and between intersection approaches from the behavioral aspects, including some high-risk maneuvers, such as head-on or angle crashes during the signal transition, left-turn during a permitted phase, and right-turn-on-red.
| Background | Bivariate EVT [@415419] |
Multistep Integration [@415376] |
Proposed EBRAC with DIRD |
|||||
| Intersections | Crash frequency (# crashes/year) |
# Crashes (year-1) | Severity Index | # of conflicts (hr-1) | ||||
| US301 @ Billingsley Road | 8.30 | 3 | 40.61 | 1 | 703.0 | 4 | 44 | 3 |
| US301 @ Harbour Way | 10.20 | 2 | 35.91 | 3 | 910.8 | 2 | 55 | 2 |
| MD118 @ Wisteria Drive | 2.80 | 5 | 25.98 | 5 | 757.2 | 3 | 25 | 4 |
| MD3 @ MD424 | 15.40 | 1 | 37.80 | 2 | 1155.0 | 1 | 72 | 1 |
| MD198 @ MD650 | 4.60 | 4 | 29.86 | 4 | 406.2 | 5 | 24 | 5 |
| Pearson Correlation Coefficient | 0.760 | 0.811 | 0.986 | |||||
| P-value | 0.136 n.s. | 0.096 n.s. | 0.002* | |||||
| Spearman Rank Correlation Coefficient | 0.700 | 0.700 | 0.900 | |||||
| P-value | 0.188 n.s. | 0.188 n.s. | 0.037* | |||||
6. Discussion
6.1. Braking—human maneuver on vehicles
The development of TCT has led to various SMoS beyond TTC and PET. Although those indices showing time and space proximities have shown effectiveness by validating through crash data (Laureshyn, 2023), the SMoS that has the deepest connection to the human-machine interface had been DRAC showing the required action on braking. This study has further developed along the same line by firstly constructing a two-dimensional DRAC that allows its application to general orientation but not limited to rear-end and head-on potentials. The high-quality data from drone-generating road users’ instantaneous deceleration rates further allow the comparison of the required action (DRAC) and actual action (instantaneous deceleration), forming a simple approach to work directly on the human-machine interface.
In this regard, the authors would like to further argue that SMoS founded on space and time proximities may not be sufficient to describe the complete picture. Recently, there have been views to search ‘simple’ indicators, including various dimensions (e.g. Laureshyn, 2023; Laureshyn et al., 2017). Such a view is logical when the original video sources are subject to homography and distortion (Ismail et al., 2013; Junghans et al., 2024); however, when the direct human maneuver is observable, it would be more resourceful to apply such observations as SMoS.
6.2. Limitations
Although some advancements can be achieved by constructing SMoS, there are several limitations that have not been fully resolved:
-
Swerving: apart from braking, another way to navigate away from danger is swerving around to avoid the collision course. The implicit assumption of possible maneuver is braking in applying EBRAC-related analysis, but steering has not yet been considered.
-
Steering angle: the direction of velocity, as a vector, is the assumed direction of travel. However, the use of Ackermann geometry to indicate the direction of travel (RCE, 2024) in a mechanical sense has not been integrated with the proposed EBRAC analysis. False alarms may be called when turning movements are apparent.
-
Action of the leader: the leader’s action is assumed to follow its current direction with the same speed. On one hand, the steering angle issue not only applies to the follower but also to the leader. On the other hand, acceleration and deceleration should also be accounted for, given the possibility of computing them is not subject to the quality of contemporary data, which has not been considered in this study.
7. Conclusions
Recognizing the random nature of the historical crash data and the lack of up-to-date information to reflect the risk of the current driving population, this study has proposed an effective and convenient method along the line of studies, Traffic Conflict Technique (TCT), for intersection risk assessment. The proposed method with its safety surrogate variable, Extra Brake Required to Avoid a Crash (EBRAC), has taken advantage of high-precision information uniquely available from the Drone-based Image-recording data (DIRD) to estimate the frequency of an intersection’s near-crash conflicts. Such surrogate measure accounts for road users’ direct maneuver- the deceleration in response to the required brake.
Since the resulting EBRAC over a target period with the extensive yet precise information from DIRD has reflected the collective impacts of all contributing factors (e.g. from driving behaviors to pavement conditions) to near-crash maneuvers, it is directly applicable, after proper calibration, to different intersections in the same region without further adjustment under different environmental conditions, or relying on other sophisticated methods to integrate all information reflected in different safety surrogates.
The effectiveness of the proposed methodology has been evaluated with a case study involving five intersections and 20 approaches. Based on the results of two widely used statistics, the DIRD can indeed produce better accuracy than with the data from the roadside cameras for measuring the safety surrogate variables adopted in the literature. The proposed EBRAC with the uniquely high-quality DIRD can also yield performance comparable to or even better than the two state-of-the-art methods for ranking the risk level with respect to individual approach or the entire intersection level.
Future research along this line includes: (1) developing a severity index that can measure the crash severity embedding the proposed EBRAC; (2) enhancing the proposed EBRAC with DIRD by taking advantage of multiple aspects of driving behavioral data (e.g. lateral acceleration), and (3) constructing a traffic control module based on the proposed EBRAC to proactively improve the intersection safety. Additionally, in this study phase, the property of EBRAC has been investigated. Since acceleration/deceleration information is applied, in theory it should be more informative than other SMoS in estimating risks. However, integrations of EBRAC with other SMoS have not been studied in this study phase and combinations of SMoS (such as Swedish TCT’s speed and TTC plot in Laureshyn & Várhelyi, 2018) may also be a research direction.
Acknowledgments
The extended abstract version of this study has been presented as a poster at the 36th conference of International Cooperation on Theories and Concepts in Traffic safety (ICTCT), held in Catania, Italy, on 26–27 October 2023.
The authors would like to express sincere thanks to Dr. Chang, Gang-Len for his comments on earlier versions of this paper. Additionally, the authors also thank for the support from Minseok Kim and Dr. Sung Yoon Park in the Traffic Development and Safety Division (TDSD) of the Maryland State Highway Administration.
CRediT contribution
Yen-Lin Huang: Conceptualization, Data curation, Formal analysis, Investigation, Methodology, Resources, Software, Validation, Visualization, Writing—original draft, Writing—review & editing. Yen-Hsiang Chen: Conceptualization, Formal analysis, Investigation, Methodology, Resources, Visualization, Writing—original draft, Writing—review & editing.
Declaration of competing interests
The authors declare that they have no known competing financial interests or personal relationships that could have appeared to influence the work reported in this study.
Ethics statement
This study can be exempted from requiring ethical approval as all the vehicles collected from aerial view are anonymous.
Funding
This research was partially funded by the Maryland Department of Transportation State Highway Administration.
Editorial information
Handling editor: Aliaksei Laureshyn, Lund University, Sweden
Reviewers: Carl Johnsson, Lund University, Sweden
Lai Zheng, Harbin Institute of Technology, China
Appendix
To show the exposure is not the sole contributor to the crashes and the surrogate measures are not singly passing the relations to crashes, this study has further investigated the relations between exposure and crash as the very baseline.
As shown in Table A1, if the volume counts represent levels of exposure, its Spearman rank correlation coefficient with the crash frequencies is 0.808 (see the cells highlighted in orange), whereas, in the same dataset, the proposed EBRAC is more informative, i.e. 0.838. In this study, Spearman rank correlation coefficient is the appropriate tool due to small dataset, but the conclusion can be more affirmative if extensive studies such as Gettman et al. (2008) with detailed regression models are conducted in future studies.
| Spearman Rank Correlation Coefficient | Exposure: recorded traffic volume (veh/hr) | Conflict: # of conflicts by EBRAC (hr-1) | Crash: crash frequency (# crashes/year) |
| Exposure: recorded traffic volume (veh/hr) | 1.000 | 0.695 | 0.808 |
| Conflict: # of conflicts by EBRAC (hr-1) | 0.695 | 1.000 | 0.838 |
| Crash: Crash Frequency (# crashes/year) | 0.808 | 0.838 | 1.000 |