Assessment of safety orientation in driving skills aligned with performance: a data-triangulation approach
Abstract
Accurate assessment of Subjective Driving Skills (SDS) is crucial for improving road safety, as direct methods are often biased and do not align well with actual driving performance. This study aimed to develop an unbiased SDS assessment method aligned with driving performance. The specific objectives are (1) reducing bias in SDS assessments, (2) verifying alignment between assessed safety orientation and ground driving performance, and (3) exploring the influence of socio-demographic factors on safety orientation. A combined questionnaire and photographic speed survey were conducted among 389 experienced car drivers in Mangalore, India. Factor analysis, a Double Lane Change (DLC) test conducted on the ground with a test vehicle equipped with Inertial Measurement Unit (IMU) sensors, correlation analysis and multiple linear regression were performed. Factor analysis confirmed the two-factor structure: Perceptual-Motor (PM) and safety skills. Further, PM and safety skills scores were calculated using factor loadings, and safety orientation was determined from their difference. DLC results showed that the assessed safety orientation aligned with the ground performance. Correlation and regression analyses showed that male drivers perceived slightly higher PM skills than female drivers. PM skills decreased with age, while safety orientation increased. Academic education had no significant effect on safety skills or safety orientation. While on-road exposure improved PM skills, weekly driving distance reduced safety orientation. Formally trained drivers had slightly higher safety skills and safety orientation than lay-instructed drivers. These findings provide several valuable insights for enhancing road safety. They suggest that safety programs address overconfidence in male drivers, incorporate road safety awareness into educational curriculums, and offer enhanced training for all experienced drivers. Younger drivers may benefit from targeted safety campaigns, while professional drivers could require specialised safety programs. Regular safety assessments and refresher courses are crucial for maintaining safety awareness, particularly for drivers with higher weekly driving distances.
1. Introduction
Road traffic crashes cause around 1.19 million deaths annually, costing most countries 3% of their GDP (WHO, 2023). Humans, roads, vehicles, and the environment contribute to road traffic crashes. Human factors contribute to more than 90% of road traffic crashes, individually or in interaction with other factors (Pakgohar et al., 2011; Su et al., 2023). A vital accident prevention strategy related to human factors is the degree of driver training (Goniewicz et al., 2016). Most driver training programs aim to enhance driving skills, including Perceptual-Motor (PM) skills (fluency in vehicle handling) and safety skills (accident-avoidance skills such as paying attention to other road users and conforming to the speed limits), among learners and novice drivers (Beanland et al., 2013). In addition to training programs, on-road driving exposure improves driving skills such as hazard perception (Jackson et al., 2009), visual attention (Lehtonen et al., 2014), and task attention (Gotardi et al., 2019). However, driving skills enhancement varies among drivers based on their training and on-road driving experience, including frequency, years, and mileage. Training and on-road exposure variations influence Subjective Driving Skills (SDS), which affects driving patterns (Singh & Kathuria, 2024). Hence, evaluating SDS will help enhance the training methods to improve road safety.
The assessment of SDS involves a questionnaire survey (Groeger & Grande, 1996; Mckenna et al., 1991; Svenson, 1981), where drivers rate their strengths or weaknesses in various driving skills components (e.g., Fluent lane-changing in heavy traffic). These questionnaire surveys consider PM and safety skills as driving skills without differentiation and were termed the Driving Skills Inventory (DSI). Lajunen & Summala (1995) enhanced the DSI from previous studies and differentiated the PM and safety skills as a two-factor structure in Finland. The two-factor structure of SDS is stable in many countries, including Australia (Lajunen, Carry, et al., 1998), Turkey (Sümer et al., 2006; Warner et al., 2013), Finland, Sweden, Greece (Warner et al., 2013), Germany (Ostapczuk et al., 2017), China (Xu et al., 2018) and India (Singh & Kathuria, 2024). Further, several studies (Lajunen et al., 2022; Martinussen et al., 2014; Ostapczuk et al., 2017; Öztürk et al., 2024; Singh & Kathuria, 2024; Sümer et al., 2006; Tekeş et al., 2020; Warner et al., 2013; X. Zhang et al., 2023; Z. Zhang et al., 2019) have investigated the correlation between SDS and self-reported incidences of accidents, penalties, traffic violations, and speed levels. The studies found that improved safety skills reduce the number of accidents, penalties, traffic violations, and speed levels. On the other hand, increased PM skills have the opposite effect since it leads to a belief of higher competence in handling vehicles. Consequently, the perception of increased PM and decreased safety skills leads to risky driving. Sümer et al. (2006) recommend that PM and safety skills be considered together to examine their effects on accidents and risky driving. In line with this, Lajunen et al. (2022) used safety orientation in driving skills (difference between safety and PM skills scores) as a single measure of drivers’ emphasis on safe driving. The authors found that increased safety orientation in driving skills reduces deliberate aberrant driving behaviours. Further, researchers have also explored the influence of socio-demographic factors, including age, gender, and on-road driving exposures, on SDS and found mixed results (Erkuş & Özkan, 2019; Lajunen, Carry, et al., 1998; Lajunen et al., 2022; Lajunen, Parker, et al., 1998; Lajunen & Summala, 1995; Martinussen et al., 2014; Öztürk et al., 2024; Sümer et al., 2006; Tekeş et al., 2020; Üzümcüoğlu et al., 2020; Wu et al., 2018; Xu et al., 2018; Z. Zhang et al., 2019). Consequently, the factors attributed to the mixed findings from the literature could be (1) Variation in cultural differences across countries (Üzümcüoğlu et al., 2020), (2) Differences in data collection methods, including online, offline, and postal surveys (Martinussen et al., 2014; Ostapczuk et al., 2017; Xu et al., 2018), (3) Focus on specific sample groups, such as young drivers (Tekeş et al., 2020), car drivers (Wu et al., 2018), bus drivers (Singh & Kathuria, 2024; Z. Zhang et al., 2019), shared e-bike riders (X. Zhang et al., 2023), and (4) Inaccurate evaluations of SDS due to biased assessment methods (De Craen et al., 2011; Sundström, 2008). However, assessing SDS should align with drivers’ performance (Martinussen et al., 2014; Sundström, 2008). Hence, biased assessment of SDS must be addressed to avoid unfair outcomes.
Two main methods exist for assessing SDS based on how drivers rate their driving skills (Sundström, 2008). In the first method, drivers rate their skills compared with their peers or average drivers (Lajunen, Parker, et al., 1998; Martinussen et al., 2014; Singh & Kathuria, 2024; X. Zhang et al., 2023). These types of social comparison assessments are affected by self-enhancement bias, i.e., drivers often believe they are more skilled than their peers or average drivers (Groeger & Grande, 1996; Marottoli & Richardson, 1998; Mckenna et al., 1991; Svenson, 1981). In the second method, drivers rate their performance by identifying weak and strong components across different components of driving (Lajunen et al., 2022; Öztürk et al., 2024; Tekeş et al., 2020; Üzümcüoğlu et al., 2020). Self-enhancement bias does not affect these assessments due to not comparing peer or average drivers. However, these assessments are affected by social desirability bias, i.e., the tendency to answer questions that others will view favourably (Sundström, 2008; Yılmaz et al., 2022), due to the direct assessment of driving skills (Tronsmoen, 2008).
From the literature, the following research gaps are identified. First, the conventional methods of assessing SDS are prone to self-enhancement and social desirability biases. Second, assessed SDS were not verified with the actual driving performance. Third, there is a limited exploration of the influence of socio-demographic variables on safety orientation.
This study aimed to develop an unbiased SDS assessment method aligned with driving performance. The first objective is to assess SDS by rectifying biases through indirect evaluation. The second objective is to cross-verify the assessed safety orientation with driving performance. The third objective is to study the influence of socio-demographic variables such as age, gender, education, training methods, driving profession, and on-road driving exposures on safety orientation. Consequently, this paper contributes to the field by providing a validated approach to accurately measure drivers’ self-assessed driving skills relative to their actual performance.
The rest of this paper is organised as follows. Section 2 describes the proposed method of assessing SDS and testing the effect of safety orientation on driving performance. Section 3 and Section 4 present the results and discussion, respectively. Section 5 describes the conclusions, limitations of the study, and future works.
2. Methodology
The proposed method of assessing SDS uses a combined questionnaire and a photographic speed survey. The questionnaire aimed to assess perceived PM skills, while the photographic speed survey aimed to evaluate safety skills. Since the data collection was in two formats, the proposed method was named the Data-triangulated Driving Skills Inventory (DTDSI). An exploratory factor analysis was performed to understand the factor structure of the responses for the questionnaire and the photographic speed survey. A Double Lane Change (DLC) test was conducted to examine the effect of perceived safety orientation on driving performance. A correlation and multiple linear regression analysis were performed to study the influence of socio-demographic variables on SDS and perceived safety orientation. The procedure for experiment design, subjective skills assessment, DLC test, correlation and regression analysis is outlined below.
2.1. Experiment design
This section discusses the participants, questionnaire preparation, and photographic-speed survey preparation.
2.1.1. Participants
The study was conducted in Mangalore, India, and involved 389 car drivers with valid Indian driving licenses. The sample size(n0) was calculated using Cochran’s Equation (Israel, 2013), as shown in Equation 1. This study considers a 95% confidence level (Z = 1.96), a margin of error (e) of 0.05, a population variability (p) of 0.5, an assumed population size exceeding one million and does not consider non-response rates. The calculated sample size was 385, making the sample size of 389 car drivers in this study adequate to meet the statistical requirements. Further, as the first study (to the authors’ knowledge) to assess SDS using a combined questionnaire and a photographic-speed survey, convenience sampling was chosen for data collection. This method allows for fast and cost-effective data collection from readily accessible populations (Marshall, 1996; Swarna Stefy Grace et al., 2020). To address potential sampling selection bias inherent in convenience sampling, the study ensured broad representation by including participants from diverse locations, such as industries, academic institutions, and taxi stands. Permission was obtained from industry partners and academic institutions to recruit active drivers. The survey was interviewer-administered, and participants were not compensated. Ethical approval was granted through a permission letter from the institute detailing the study’s purpose and confidentiality measures. Participants received oral information about the study and a copy of the letter if interested. Personal identifiers were removed, and each response was assigned a unique driver ID (e.g., D001) to ensure anonymity and confidentiality. Table 1 displays the percentage of participants categorised under each socio-demographic variable, including gender, age, driving profession, frequency, education, training method, years of driving experience, and weekly driving distance. The study focused on understanding the driving pattern of professional versus non-professional drivers; therefore, participants’ professions, such as manager and student, were not recorded. Further, most of the participants drive frequently (i.e., 87% drive almost daily or occasionally in a week), while professional, female, and 60+ aged drivers were imbalanced. However, the sample aligns with the trend reported by the Regional Transport Office, Mangalore, where 27% of car driving licenses were issued to females and 7% to professionals between 2009 and 2022. Similarly, fewer 60+ drivers reflect findings that driving decreases with age due to safety concerns (Bauer et al., 2003).
where
n0 = sample size
Z = Z-score for the confidence level
p = proportion of the population
q = 1 – p
e = level of precision.
| Variable | N | % | |
| 1. Gender | Male | 329 | 85 |
| Female | 60 | 15 | |
| 2. Age group (in years) | 18–25 | 65 | 17 |
| 26–35 | 147 | 38 | |
| 36–45 | 113 | 29 | |
| 46–60 | 57 | 14 | |
| > 60 | 7 | 2 | |
| 3. Driving profession | Professional | 46 | 12 |
| Non-professional | 343 | 88 | |
| 4. Driving frequency | Almost daily | 203 | 52 |
| Occasionally in a week | 136 | 35 | |
| Occasionally in a month | 50 | 13 | |
| 5. Education | Non-graduates | 55 | 14 |
| Graduates | 122 | 31 | |
| Postgraduate | 212 | 55 | |
| 6. Training method | Formally trained | 249 | 64 |
| Lay-instructed | 140 | 36 | |
| 7. Years of driving a car | 1–3 | 46 | 12 |
| 3–5 | 60 | 16 | |
| 5–10 | 122 | 31 | |
| > 10 | 161 | 41 | |
| 8. Weekly driving distance | > 100 km | 113 | 29 |
| 50–100 km | 129 | 33 | |
| < 50 km | 147 | 38 |
2.1.2. Questionnaire preparation for assessing PM skills
PM skills involve two key components: perception and action. Perception refers to the ability to gather and interpret relevant environmental information, while action involves coordinating movements based on this perceptual input. Skilful perception-action decoupling, which involves dissociating perception from action, is essential to perform perceptual-motor tasks, such as returning a tennis serve. Thus, accurate environmental information perception is crucial for successful action completion (Azam et al., 2024). In the driving context, perception refers to drivers’ understanding of the driving environment, while action involves controlling the vehicle. To self-assess the PM skills of drivers, the DSI (Lajunen & Summala, 1995), widely used in the literature, considers various challenging driving environments, such as navigating unfamiliar cities, managing skids, driving at night, and overtaking. However, the DSI hinders perception-action decoupling, making it challenging for drivers to perceive the environment and assess their PM skills effectively. For example, the item “performance in a critical situation” in the DSI asks drivers to rate their performance on a scale from “very weak” to “very strong”. The non-specific nature of the situation, combined with the direct assessment response scale, leads drivers to evaluate their general performance rather than enabling them to perceive the environment effectively. Supporting this, Lajunen & Özkan (2021) argued that “the DSI is not an objective measure of driver skills, but rather an instrument for investigating a driver’s view of his or her skills.”
The current study assesses drivers’ PM skills by enabling them to perceive specific driving situations clearly before evaluating their vehicle control abilities. Table 2 lists the questionnaire items (Q1 to Q14) designed to self-assess drivers’ PM skills using a five-point Likert scale ranging from “Strongly Disagree” to “Strongly Agree.” The items and the response scales are designed to align with perception-action decoupling, allowing drivers to first perceive the environment before evaluating their vehicle control abilities. For example, in item Q8, “I feel easy to control the vehicle in the event of road damages or potholes,” the distinction between “I feel easy to control the vehicle” and “in the event of road damages or potholes” reflects perception-action decoupling. This structure encourages drivers first to perceive the specific situation (i.e., road damages or potholes) and then assess how these conditions impact their vehicle control. Additionally, a “Strongly Agree” response indicates that a driver perceives a higher level of PM skills, whereas “Strongly Disagree” suggests that the driver perceives a lower level of PM skills. The questionnaire considers specific driving environments, including variations in road conditions, user interactions, distractions, and familiarity with road features (Abd Rahman et al., 2022; Ishibashi Motonori et al., 2007; Ram & Chand, 2016).
A pilot survey was conducted using an online questionnaire of 22 items, subsequently refined for the final version. Based on feedback from the 93 respondents for the pilot survey, the questionnaire was fine-tuned, focusing on reducing response time by improving readability and clarity, and addressing redundancy. Readability improvements involved rephrasing complex statements, such as changing “Navigate through barricades at intersections” to “drive through barricades placed non-uniformly at highway junctions” (Q9) and revising “Maintain a constant distance from the vehicle in front of me” to “maintain a safe distance throughout while driving so closely to a lead vehicle” (Q12). For better clarity, some items were reworded to convey their intent better. For instance, “Navigate the vehicle easily through a group of pedestrians crossing the road near bus stops” was simplified to “pedestrians cross the road by speaking on their phones” (Q10); “Control vehicle by predicting the actions of other drivers” was revised to “react to the unexpected movements of other vehicles at junctions” (Q11); and “Complete or abort the overtaking from the opposite lane” was clarified as “abort the overtaking due to the presence of an opposing vehicle on two-lane highways” (Q13). Redundant items were removed to reduce the response time of the respondents; it was not based on the correlation between the items from the pilot survey. For example, “Merging with mainstream traffic from a side road” was merged with “turn right from a busy traffic main road to a side road” (Q14); “Vehicle control at the slippery road” was combined with “road damages or potholes” (Q8); and “Reverse parking in the appropriate parking space” was integrated with “parallel parking between two cars” (Q3). Following these refinements, the final version of the questionnaire, termed items of vehicle control abilities, comprised 14 items (Q1 to Q14), as presented in Table 2.
2.1.3. Selection of photographs for assessing safety skills
Safety skills refer to accident avoidance skills such as driving carefully, paying attention to other road users, adjusting the speed to the conditions and conforming to the speed limits. The DSI (Lajunen & Summala, 1995) assesses safety skills using non-specific items and a direct response scale, prompting drivers to evaluate their general skills. For example, the item “paying attention to other road-users” in the DSI asks drivers to rate on a scale from “very weak” to “very strong.” However, self-assessment of safety skills should focus on how closely drivers adhere to safe driving practices in specific situations.
The current study evaluates safety skills by comparing drivers’ preferred driving speeds with the maximum safe speeds using driver-perspective photographs of specific situations. The preferred driving speeds reflect how closely drivers adjust their speeds in response to perceived situational complexities, such as road conditions, traffic, and the surrounding environment (de Craen et al., 2008). However, while drivers adjust their speeds based on perceived complexity, it is equally important to account for the maximum safe speed to effectively manage the risk (Oviedo-Trespalacios et al., 2017; Steinbakk et al., 2019). By examining the alignment between preferred and maximum safe speeds, the study assesses drivers’ adherence to safe behaviours, including careful driving, attentiveness to other road users, adjusting speed to conditions, and compliance with speed limits. The maximum safe speed for each photograph was determined using the Delphi method, a structured approach where experts provide decisions or predictions through iterative rounds of consultation (Chalmers & Armour, 2019). In this study, driving school trainers, skilled in assessing scenarios and guiding trainees, were engaged in establishing appropriate maximum safe speeds for each photograph.
The photographs were collected from a dataset (Kumar et al., 2021) and various shared videos with good clarity and focus on driver-perspective views. They depict diverse scenarios across road types, conditions, and user interactions. One of the primary criteria for selecting a photograph was that the road should be free from congestion so that drivers could choose their desired speeds. A preliminary survey was conducted online using 16 identified photographs to check the redundancy. Four photographs were removed based on respondents’ feedback, and the remaining 12, termed situational complexity items, were selected for the final survey (S1 to S12 in Table 2). As a sample, Figure 1a illustrates manoeuvring on a two-lane rural highway while interacting with other vehicles, including a breakdown car (Scenario-1). Similarly, Figure 1b shows manoeuvring at a median opening on a six-lane divided urban highway while interacting with motorised two-wheelers (Scenario-10).

2.2. Assessment of SDS
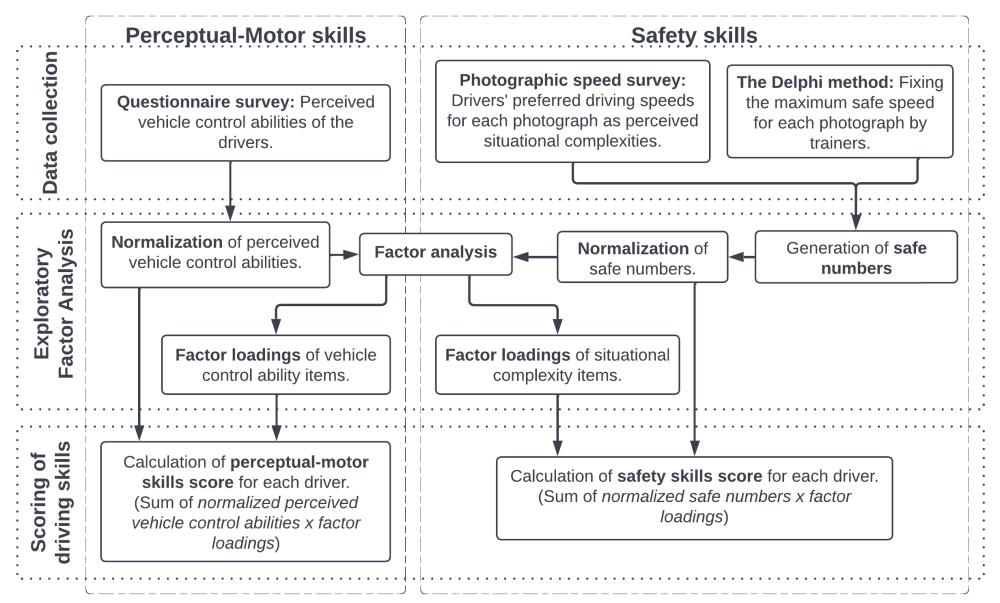
Figure 2 shows the proposed DTDSI method of assessing SDS. The technique involves three main steps. The first step involved collecting data from drivers and driving school trainers through the questionnaire and the photographic speed survey. The second step involved conducting an exploratory factor analysis by integrating questionnaire and photographic survey responses. The final step involved the calculation of SDS scores. The detailed explanation of the steps mentioned above is as follows.
2.2.1. Data collection using the questionnaire and the photographs
The data collected using the prepared questionnaire and selected photographs are presented below.
Data collection from drivers
Drivers first responded to socio-demographic items, followed by vehicle control ability items in the questionnaire. Subsequently, the selected photographs were presented in a transparent A4 file in landscape format. Each photograph was numbered at the top and organised sequentially by road types (two-lane highway, four-lane rural highway, six-lane urban road, and campus road) to establish a logical flow for responding to speed preferences. Participants were given the photograph file and asked to mark their preferred driving speeds for the twelve selected photographs, one at a time. They were instructed to imagine being on an urgent trip while reporting their speeds. This approach aimed to reflect closely on their driving behaviour and prevent them from focusing exclusively on the complexities of the photographs. This may lead to capturing the willingness to drive safely and hazard perception skills (Mcknight & Mcknight, 2003). Therefore, no time limit was imposed during the photographic speed survey to focus solely on the willingness to drive safely and avoid capturing hazard perception skills, as de Craen et al. (2008) suggested.
Data collection from driving school trainers
A Delphi study was conducted with seven selected driving school trainers over multiple rounds to determine the maximum safe speed for each photograph. The trainers had a mean age of 48 years and driving experience of 13 years. In the first round, the twelve selected photographs were presented to the trainers individually, and they were asked to mark the maximum safe speed for each scenario. In subsequent rounds, the trainers were given the same photographs and a statistical summary of the reported speeds for each photograph from the previous round. The statistical summary included a bar chart displaying the reported speeds in ascending order, with a horizontal median line. The x-axis showed driver IDs arranged sequentially according to their reported speeds. The trainers were then allowed to revise their maximum safe speed for each photograph, considering the photograph and the statistical summary from the prior round. This iterative process ensured a consensus on the maximum safe speed for each photograph. This exercise was repeated until the speeds across the candidate trainers converged (i.e. when the maximum safe speed’s standard deviation marked for a scenario was less than 5 km/hr). In this study, the maximum safe speeds for all scenarios converged in the fourth round. All twelve scenarios converged maximum safe speeds ranging from 25 km/hr to 70 km/hr (Mean = 45.83, Standard deviation = 13.79).
2.2.2. Exploratory Factor Analysis
An exploratory factor analysis was used to understand the relationship between perceived vehicle control abilities and situational complexities. To perform the factor analysis, the responses for the questionnaire and the photographic speed survey were numerically coded. The perceived level of vehicle control abilities for each item was rated on a scale from Strongly Disagree (1) to Strongly Agree (5). A rating of 1 indicates very difficult vehicle control, while a rating of 5 indicates very easy vehicle control in a specific situation. On the other hand, for the photographic speed survey, a comparison was made between participants’ preferred driving speed and the maximum safe speed to generate a safe number for each photograph for all the drivers. If the preferred driving speed of a participant and the maximum safe speed were the same, the safe number for the scenario was considered to be zero. The driver loses one point every 5 km/hr above the maximum safe speed. In comparison, for every 5 km/hr below, the driver gains one point since driving 5 km/hr slower than the maximum safe speed can significantly reduce the frequency of accidents (Lewis et al., 2012).
Due to differing questionnaire and photographic speed survey scales, the coded perceived vehicle control abilities and safety numbers were normalised between zero and one before analysis. The exploratory factor analysis was performed using principal axis factor analysis with oblimin rotation using Python programming language. The Kaiser-Meyer-Olkin test assessed sampling adequacy, and the Scree test plot was used to fix the number of factors. The analysis confirmed that perceived vehicle control abilities and situational complexities were two different factors. The items of the vehicle control abilities were loaded under the first factor, and the items of the situational complexities were loaded under factor two. The threshold values were fixed as 0.6 for factor loadings (Kline, 2014) and 0.4 for communalities to retain or eliminate an item for further analysis.
2.2.3. Calculation of PM skills, safety skills, and safety orientation scores
The skills score for each participant (i) was calculated as the sum of the products of the participant’s responses (normalised coded values) and the corresponding factor loadings for each item. The participants’ PM and safety skills scores were calculated using the first and second factored items. The safety orientation score for each participant was calculated by subtracting the PM skills score from the safety skills score, as shown in Equation 2. To ensure equal contribution to the safety orientation score, the participants’ PM and safety skills scores were initially standardised (Mean=0, SD=1).
where
= Safety orientation score for participant
= Standardized safety skills score for participant
= Standardized PM skills score for participant
2.3. Effect of perceived safety orientation on driving performance
The DLC test was conducted to verify the alignment between assessed safety orientation and driving performance. The test involves operational-level tasks such as steering, accelerating, and braking. According to Michon (1985), driving tasks are organised into three hierarchical levels: (1) strategic (general plans such as trip planning and route selection), (2) manoeuvring (controlled action patterns such as obstacle avoidance and gap acceptance), and (3) operational (automatic action patterns such as steering and braking). This study assessed safety orientation by combining manoeuvring-level safety skills and operational-level PM skills. To focus on the safety orientation contributed by PM skills in the operational-level DLC test, safety skills were controlled during driver selection. All 389 participants were initially categorised as low or high safety-oriented, using zero as the threshold (indicating balanced PM and safety skills). Out of 76 drivers willing to participate in the DLC test, 20 drivers (8 low and 12 high safety-oriented) with similar safety skills were randomly selected.
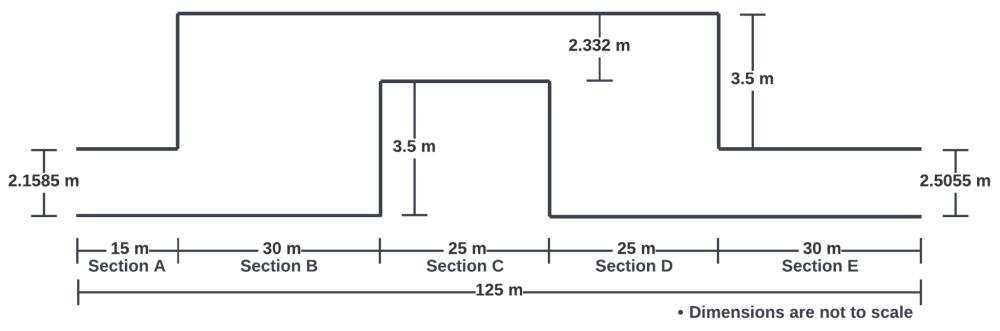
Figure 3 shows the sections and dimensions of the test, which was performed following the guidelines in ISO 3888-1:2018. According to the ISO standard, the width of sections A, C, and E should be adjusted according to the width of the test vehicle. For this study, a Maruti Swift 2022 model passenger car was selected as the test vehicle, and its width (W) was measured as 1.735m. The width of sections A, C, and E were fixed as 2.1585m (1.1xW + 0.25), 2.332m (1.2xW + 0.25), and 2.5055m (1.3xW + 0.25), respectively. The variation in lateral acceleration, captured during lane changes, was used to measure driving performance. Data collection for lateral acceleration relied on smartphone-based IMU sensors (Figure 4a), which have been widely applied in studies of driving behaviour (Mantouka et al., 2021).
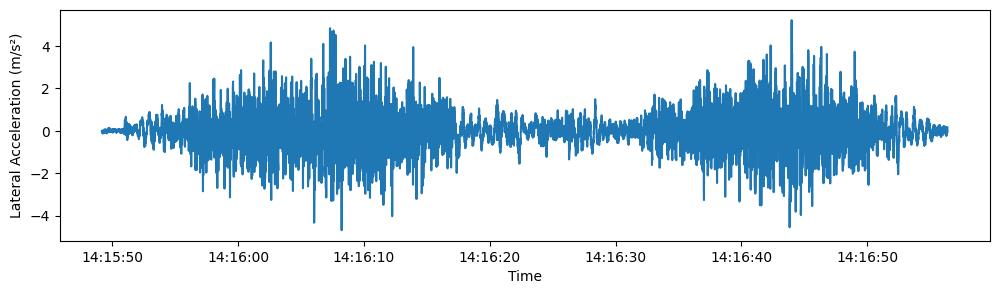
Figure 4b shows a driver performing the DLC test on the playground using the test vehicle. The test vehicle was new to every driver, and they were unaware of their assigned safety orientation group. This ensured that each driver’s performance was unbiased and based solely on their SDS. Further, the drivers performed the DLC test at their speed and convenience, prioritising safety by avoiding high-speed assessments of the vehicle’s lateral stability. From the selected 20 drivers, eight low safety-oriented drivers made two attempts each, resulting in 32 lane changes across sections B and D in Figure 3 (8 drivers × 2 attempts × 2 sections). In contrast, 11 high safety-oriented drivers completed two attempts each, and one driver completed one attempt due to missing data, totalling 46 lane changes. This resulted in 78 lane changes overall. Figure 5 shows the lateral acceleration measured by the smartphone-based IMU sensors during a driver’s attempt at the DLC test. The Mann-Whitney U test was used to compare the two groups using the standard deviation of lateral acceleration during lane changes, as the data was non-parametric.

2.4. Influence of socio-demographic variables on SDS and safety orientation
A correlation analysis and a multiple linear regression were performed to study the influence of socio-demographic variables on PM skills, safety skills, and safety orientation. Since correlation and multiple linear regression typically use continuous variables as predictors, categorical variables were coded numerically to facilitate the analyses. For instance, the training method variable was coded as 1 for lay instruction and 2 for formal training. Ordinal variables, which have a natural order, were coded with numerical values corresponding to their categories (e.g., under driving frequency, 1 = Occasionally in a month, 2 = Occasionally in a week, 3 = Almost daily). For more details on the coding of categorical variables, refer to the notes under Table 4.
3. Results
3.1. Perceived vehicle control abilities and situational complexities
Table 2 shows the mean, standard deviation, skewness, and kurtosis values for the perceived vehicle control abilities (item ID Q1 to Q14) and safe numbers of situational complexities (item ID S1 to S12). The skewness and kurtosis values of the responses for the items ranged from -0.90 to 0.17 and -1.16 to 1.68, respectively. These values fell within the acceptable range of +2 to -2 (Ferguson & Cox, 1993), indicating that the responses from the participants were satisfactory for performing exploratory factor analysis.
3.2. SDS and safety orientation scores
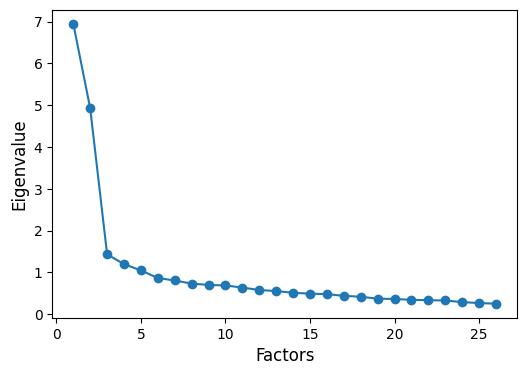
An exploratory factor analysis was performed to examine the factor structure of the proposed DTDSI. The Kaiser-Meyer-Olkin measure of sampling adequacy was 0.91, and Bartlett’s test sphericity was significant (χ2 (162) = 4511.09, p < 0.001), showing that the correlation matrix from the items of the scale is factorable. The scree test plot indicated a clear elbow point (Figure 6), resulting in a two-factor solution. Table 3 shows the factor loadings and communality values for both factors. The items loaded less than 0.6 for factor loading and 0.4 for communalities were removed under each factor. Eight items remained under each factor. The variance explained by the first and second factors were 28.5% and 27.5%, respectively, and the total variance explained by both factors was 56%, which indicates that the factors capture a significant portion of the variability in the data. Cronbach’s alpha for the first and second factors were 0.89 and 0.88, respectively, within the acceptable value of 0.7 (Cortina, 1993), indicating good internal reliability. The factor loadings and normalised responses calculated each participant’s PM and safety skills scores. PM skills scores ranged from 0.35 to 5.89 (Mean = 3.32, SD = 1.24), safety skills scores ranged from 0.89 to 5.23 (Mean = 3.34, SD = 0.71), and the safety orientation scores calculated from PM and safety skills scores ranged from -4.44 to 4.21 (Mean = 0, SD = 1.52).
| Item ID | Item | Mean | SD | Skewness | Kurtosis | Max | Min |
| Q1 | I feel comfortable to drive someone else's car. | 3.07 | 1.13 | -0.06 | -0.74 | 5 | 1 |
| Q2 | I feel easy to perform hill start without rolling back. | 3.87 | 1.01 | -0.84 | 0.10 | 5 | 1 |
| Q3 | I feel easy to perform parallel parking between two cars. | 3.77 | 0.97 | -0.61 | -0.28 | 5 | 1 |
| Q4 | I feel easy to control the vehicle while reading roadside advertisements. | 2.85 | 1.15 | 0.14 | -0.88 | 5 | 1 |
| Q5 | I feel easy to control the vehicle in busy traffic while searching for a parking place. | 3.36 | 1.07 | -0.29 | -0.79 | 5 | 1 |
| Q6 | I feel comfortable driving on busy traffic roads in unfamiliar cities using a map. | 3.47 | 1.05 | -0.48 | -0.59 | 5 | 1 |
| Q7 | I feel comfortable driving in foggy, dusty, smoky, or rainy conditions. | 3.13 | 1.06 | -0.02 | -0.85 | 5 | 1 |
| Q8 | I feel easy to control the vehicle in the event of road damages or potholes. | 3.28 | 1.16 | -0.32 | -0.90 | 5 | 1 |
| Q9 | I feel comfortable to drive through barricades placed non-uniformly at highway junctions. | 3.23 | 1.18 | -0.34 | -0.93 | 5 | 1 |
| Q10 | I feel easy to control the vehicle when pedestrians cross the road by speaking on their phones. | 2.98 | 1.21 | -0.02 | -1.16 | 5 | 1 |
| Q11 | I feel easy to react to the unexpected movements of other vehicles at junctions. | 3.04 | 1.13 | -0.04 | -0.98 | 5 | 1 |
| Q12 | I feel easy to maintain a safe distance throughout while driving so closely to a lead vehicle. | 3.76 | 0.95 | -0.90 | 0.55 | 5 | 1 |
| Q13 | I feel easy to abort the overtaking due to the presence of an opposing vehicle on two-lane highways. | 3.55 | 1.08 | -0.59 | -0.44 | 5 | 1 |
| Q14 | I feel easy to turn right from a busy traffic main road to a side road. | 3.30 | 1.07 | -0.19 | -0.81 | 5 | 1 |
| S1 | Interacting with a breakdown vehicle on a two-lane rural highway. | -1.52 | 2.88 | -0.54 | 0.79 | 6 | -12 |
| S2 | Overtaking a truck on a two-lane rural highway. | 0.77 | 3.11 | 0.17 | 0.49 | 10 | -12 |
| S3 | Maneuvering through bad road conditions on a two-lane rural highway. | -3.27 | 3.20 | -0.30 | 0.35 | 4 | -16 |
| S4 | Maneuvering through a two-lane highway while encountering roadside construction. | -2.12 | 2.31 | -0.60 | 0.86 | 3 | -11 |
| S5 | Manoeuvring on a horizontal curve with a median opening of a four-lane rural divided highway. | 2.56 | 3.87 | -0.23 | -0.12 | 12 | -10 |
| S6 | Interacting with an excavator on a horizontal curve of a four-lane rural divided highway. | -1.16 | 3.39 | -0.20 | 0.51 | 10 | -12 |
| S7 | Presence of animals on a mid-block of a four-lane rural divided highway. | 2.35 | 3.94 | -0.80 | 0.59 | 9 | -12 |
| S8 | Interacting with passenger cars on a six-lane urban divided highway. | -2.49 | 3.62 | -0.24 | -0.08 | 5 | -15 |
| S9 | Interacting with an auto-rickshaw on a six-lane urban divided highway. | -2.10 | 3.06 | -0.67 | 1.68 | 5 | -17 |
| S10 | Interacting with motorised two-wheelers at a median opening at a six-lane urban divided highway. | -0.99 | 3.00 | -0.45 | 0.55 | 6 | -12 |
| S11 | Manoeuvring through a signalised intersection at a four-lane urban divided highway. | -2.46 | 2.96 | -0.56 | 0.84 | 4 | -14 |
| S12 | Interacting with a bicycle and a parked car on a four-lane divided campus road. | -0.58 | 3.22 | -0.56 | 0.26 | 7 | -11 |
| Item ID | Factor loading | Communality | |
| Vehicle control abilities | Situational complexities | ||
| Q8 | 0.78 | 0.02 | 0.61 |
| Q9 | 0.77 | -0.01 | 0.59 |
| Q7 | 0.75 | 0.08 | 0.57 |
| Q10 | 0.75 | 0.02 | 0.56 |
| Q14 | 0.73 | -0.09 | 0.54 |
| Q5 | 0.73 | -0.02 | 0.54 |
| Q11 | 0.73 | 0.01 | 0.53 |
| Q3 | 0.65 | 0.00 | 0.42 |
| Q2 | 0.61 | 0.06 | 0.38 |
| Q6 | 0.61 | 0.07 | 0.38 |
| Q13 | 0.60 | -0.10 | 0.37 |
| Q12 | 0.60 | -0.09 | 0.36 |
| Q1 | 0.51 | 0.00 | 0.26 |
| Q4 | 0.47 | -0.14 | 0.24 |
| S10 | -0.01 | 0.76 | 0.58 |
| S9 | -0.04 | 0.76 | 0.57 |
| S8 | -0.08 | 0.75 | 0.57 |
| S4 | 0.11 | 0.72 | 0.53 |
| S7 | 0.02 | 0.70 | 0.49 |
| S6 | -0.03 | 0.69 | 0.48 |
| S11 | -0.07 | 0.69 | 0.48 |
| S5 | -0.03 | 0.66 | 0.44 |
| S12 | 0.04 | 0.62 | 0.39 |
| S1 | 0.01 | 0.62 | 0.38 |
| S3 | 0.20 | 0.53 | 0.33 |
| S2 | 0.03 | 0.52 | 0.27 |
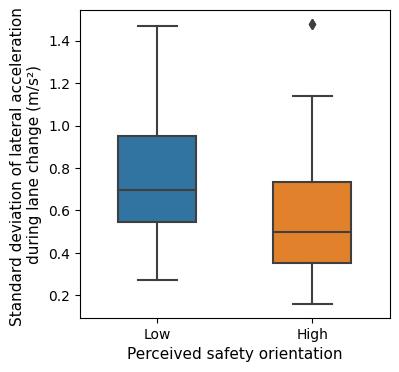
3.3. Effect of safety orientation on driving performance
The selected 20 drivers for the DLC test had lower variability of safety skills (M20 = 3.97, SD20 = 0.43) compared to the primary sample (M389 = 3.34, SD389 = 0.71). Their PM skills (M20 = 3.51, SD20 = 1.12) were comparable to the primary sample (M389 = 3.32, SD389 = 1.24) with comparable variation. This selection ensured a focus on the safety orientation contributed by PM skills in the operational-level DLC test. Figure 7 shows the distributions of the standard deviation of lateral acceleration at lane changes in the DLC test of low- and high-safety-oriented drivers. The shift between the distributions in the median and interquartile range indicates that high-safety-oriented drivers perform smoother lane changes than low-safety-oriented drivers. In addition, the Mann-Whitney U test confirms the statistically significant difference (U 470, p < 0.001) in driving performance between low- and high-safety-oriented drivers.
3.4. Influence of socio-demographic variables on SDS and safety orientation
Table 4 presents the Spearman’s correlation coefficients between SDS, safety orientation, and socio-demographic variables. Perceived PM skills significantly decrease with an increase in education (rs=-0.26, p<0.01) and age (rs=-0.16, p<0.01). Formally-trained (rs=-0.24, p<0.01) and female (rs=-0.23, p<0.01) drivers also perceive slightly lower PM skills than their counterparts. Further, perceived PM skills significantly increase with weekly driving distance (rs=0.24, p<0.01), driving frequency (rs=0.16, p<0.01), and years of driving a car (rs=0.12, p<0.05) and among professional driver (rs=0.24, p<0.01). On the other hand, formally trained drivers have slightly higher significant safety skills (rs=0.15, p<0.01) than lay-instructed drivers. However, no such socio-demographic variable impacted perceived safety skills except the training method. Additionally, perceived safety orientation significantly increases with an increase in education (rs=0.16, p<0.01) and age (rs=0.16, p<0.01). Similarly, female (rs=0.16, p<0.01) and formally-trained (rs=0.27, p<0.01) drivers perceived slightly higher safety orientation than their counterparts. However, being a professional driver (rs=-0.18, p<0.01) and increased weekly driving distance (rs=-0.22, p<0.01) play a significant role in perceiving lower safety orientation. Driving frequency and years of driving a car showed no effect on safety orientation.
| Item | 1 | 2 | 3 | 4 | 5 | 6 | 7 | 8 | 9 | 10 | 11 |
| 1 PM skills | |||||||||||
| 2 Safety skills | -0.12** | ||||||||||
| 3 Safety Orientation | -0.76** | 0.71** | |||||||||
| 4 Gender | -0.23** | 0.01 | 0.16** | ||||||||
| 5 Age | -0.16** | 0.08 | 0.16** | -0.03 | |||||||
| 6 Education | -0.26** | -0.02 | 0.16** | 0.23** | 0.09 | ||||||
| 7 Training method | -0.24** | 0.15** | 0.27** | 0.23** | 0.25** | 0.20** | |||||
| 8 Driving profession | 0.24** | 0.00 | -0.18** | -0.11* | 0.14** | -0.41** | -0.06 | ||||
| 9 Driving frequency | 0.16** | 0.05 | -0.08 | -0.07 | 0.17** | -0.16** | -0.05 | 0.30** | |||
| 10 Years of driving a car | 0.12* | 0.01 | -0.08 | -0.11* | 0.47** | 0.03 | -0.05 | 0.20** | 0.35** | ||
| 11 Weekly driving distance | 0.24** | -0.08 | -0.22** | -0.25** | 0.18** | -0.17** | -0.19** | 0.34** | 0.44** | 0.30** |
Table 5 presents the coefficients (β) of socio-demographic variables from the multiple linear regression models predicting PM skills, safety skills, and safety orientation. In the first model predicting PM skills, the model captured 20% of the variance (R² = 0.20). Significant predictors were driving profession (β = 0.45, p < 0.01), gender (β = -0.32, p < 0.05), age (β = -0.24, p < 0.001), weekly driving distance (β = 0.14, p < 0.05), and years of driving a car (β = 0.12, p < 0.05). Education, training method, and driving frequency were non-significant. The second model predicting safety skills captured only 4% of the variance (R² = 0.04), and the only significant predictor was the training method (β = 0.30, p < 0.05). Gender, age, education, driving profession, driving frequency, years of driving a car, and weekly driving distance were non-significant. In the third model predicting safety orientation, the model captured 14% of the variance (R² = 0.14). Significant predictors included training method (β = 0.49, p < 0.01), age (β = 0.29, p < 0.001), and weekly driving distance (β = -0.25, p < 0.05). Gender, education, driving profession, driving frequency, and years of driving a car were non-significant.
| Independent Variables | Model 1: PM Skills (R² = 0.20) |
Model 2: Safety Skills (R² = 0.04) |
Model 3: Safety Orientation (R² = 0.14) |
| Coefficient (β) | Coefficient (β) | Coefficient (β) | |
| Gender | -0.32* | -0.05 | 0.27 |
| Age | -0.24*** | 0.05 | 0.29*** |
| Education | -0.14 | -0.05 | 0.09 |
| Training method | -0.19 | 0.30* | 0.49** |
| Driving profession | 0.45** | -0.03 | -0.47 |
| Driving frequency | 0.09 | 0.08 | 0.00 |
| Years of driving a car | 0.12* | 0.01 | -0.11 |
| Weekly driving distance | 0.14* | -0.12 | -0.25* |
| Intercept | 0.25 | -0.45 | -0.70 |
4. Discussion
The study developed a questionnaire and a photographic speed survey to assess PM and safety skills. The questionnaire enabled drivers to perceive specific driving situations before evaluating their vehicle control abilities, thus decoupling perception and action. The photographic speed survey allowed drivers to report their preferred driving speeds and compare them with the maximum safe speeds, reflecting their ability to adhere to safe driving behaviours. The responses to the survey were within an acceptable limit of skewness for the factor analysis, although this was not verified in existing studies (Lajunen, Carry, et al., 1998; Lajunen & Summala, 1995; Ostapczuk et al., 2017; Singh & Kathuria, 2024; Sümer et al., 2006; Warner et al., 2013; Xu et al., 2018). Additionally, factor analysis aligned with these previous studies and confirmed the two-factor structure: PM and safety skills. Further, higher safety-oriented drivers performed smoother lane changes at the DLC test, suggesting that the proposed method could effectively assess the PM and safety skills and align with driving performance.
The current study’s correlation analysis between socio-demographics, SDS, and safety orientation revealed various findings, including consistent, mixed, entirely different, and new insights compared with the literature. Further, the study’s multiple regression model results were compared to better understand each factor’s independent effects on PM skills, safety skills, and safety orientation. As the consistent findings, male drivers perceived slightly higher PM skills than female drivers (Lajunen, Carry, et al., 1998; Lajunen et al., 2022; Lajunen, Parker, et al., 1998; Lajunen & Summala, 1995; Martinussen et al., 2014; Sümer et al., 2006; Tekeş et al., 2020; Wu et al., 2018; Xu et al., 2018; Z. Zhang et al., 2019). The regression results confirmed this finding, showing a significant effect that indicates male drivers perceive themselves as more skilled at operating vehicles. Additionally, academic education does not affect safety skills, which is aligned with a previous study (Tekeş et al., 2020). The regression results confirmed this finding, indicating that safety skills cannot be expected to improve with increased academic education. Regarding on-road driving exposure, being a professional driver and an increase in driving frequency, years of driving a car, and weekly driving distance increase PM skills (Lajunen, Carry, et al., 1998; Lajunen et al., 2022; Lajunen & Summala, 1995; Öztürk et al., 2024; Sümer et al., 2006; Tekeş et al., 2020; Üzümcüoğlu et al., 2020; Wu et al., 2018; Xu et al., 2018). The regression results confirmed this finding, except for driving frequency, indicating that increased on-road exposure leads to a stronger belief in drivers’ ability to control a vehicle. On the other hand, on-road driving exposure does not affect safety skills (Erkuş & Özkan, 2019; Lajunen, Carry, et al., 1998; Lajunen, Parker, et al., 1998; Öztürk et al., 2024; Sümer et al., 2006; Üzümcüoğlu et al., 2020; Wu et al., 2018; Xu et al., 2018). The regression results support this, indicating that increased on-road driving exposure does not necessarily improve safety skills.
There are mixed findings regarding the effects of gender and age on safety skills and the impact of education on PM skills. While this study found no significant gender differences in safety skills, which is in line with some previous research (Lajunen, Carry, et al., 1998; Lajunen, Parker, et al., 1998; Lajunen & Summala, 1995; Tekeş et al., 2020; Wu et al., 2018; Xu et al., 2018), other studies (Lajunen et al., 2022; Sümer et al., 2006) reported that female drivers perceive higher safety skills. Similarly, the study found that age does not affect safety skills, consistent with previous studies (Lajunen, Carry, et al., 1998; Lajunen et al., 2022; Lajunen & Summala, 1995; Tekeş et al., 2020; Wu et al., 2018; Xu et al., 2018), whereas other studies (Lajunen, Parker, et al., 1998; Martinussen et al., 2014; Öztürk et al., 2024; Sümer et al., 2006; Z. Zhang et al., 2019) suggest that safety skills increase with age. Regarding education, the correlation analysis revealed that increased academic education decreases perceived PM skills, consistent with a previous study (Sümer et al., 2006). However, the regression analysis indicated that academic education did not significantly affect PM skills, aligned with another study (Tekeş et al., 2020).
In contrast to previous research, the study presented some entirely different findings. Notably, as age increases, the perceived PM skills significantly decrease. The regression analysis confirms this finding, suggesting that younger drivers may have a higher propensity for road accidents due to increased PM skills. This contrasts with earlier studies that reported either no effect of age on PM skills (Lajunen, Carry, et al., 1998; Lajunen et al., 2022; Lajunen & Summala, 1995; Tekeş et al., 2020; Wu et al., 2018; Xu et al., 2018) or PM skills increase with age (Lajunen, Parker, et al., 1998; Öztürk et al., 2024; Sümer et al., 2006). Moreover, the current study found that safety orientation increases with age, suggesting that young drivers are prone to accidents. In contrast, Lajunen et al. (2022) found that age did not affect safety orientation, though their study focused exclusively on young drivers. Similarly, correlation analysis indicated that female drivers had a higher safety orientation, aligned with Lajunen et al. (2022). However, regression analysis did not support this finding.
Finally, the study offered new insights into the factors influencing safety orientation, including academic education, training methods, and on-road driving exposure. Both correlation and regression analyses indicated that driving frequency and years of driving experience do not significantly impact safety orientation. While correlation analysis suggested that safety orientation increases with higher academic education, regression analysis did not confirm this effect. Similarly, professional drivers were found to perceive lower safety orientation in correlation analysis; however, regression analysis showed no significant influence of the driving profession. Both analyses highlighted that higher weekly driving distances significantly decrease safety orientation, indicating that extensive driving experience may not always correlate with safer driving behaviours. However, Elvik (2023) highlights that while the number of accidents increases with distance driven, the crash rate (accidents per unit distance) decreases, following a square root relationship with distance. This reduction in accident involvement rate may result from increased exposure to enhanced critical driving skills, such as hazard perception (Jackson et al., 2009), visual attention (Lehtonen et al., 2014), and task attention (Gotardi et al., 2019). Regarding training methods, correlation analysis suggested that lay-instructed drivers perceive higher PM skills than formally trained drivers, though regression analysis did not support this. Notably, training methods were the only socio-demographic factor significantly influencing safety skills. Both analyses confirmed that formally trained drivers exhibit significantly higher safety skills and safety orientation, emphasising the need for formal training. However, the regression models developed to predict safety skills and safety orientation explain only a very low variance (4% and 14%, respectively), suggesting that additional factors or enhanced training approaches may be necessary to improve safety skills and safety orientation in India. Enhanced training programs should focus on specific skills, such as hazard perception (Prabhakharan et al., 2024), rather than general formal training. Formal training does not necessarily result in a lower crash rate than lay-instructed drivers (Beanland et al., 2013; Elvik et al., 2009; Peck, 2011). Additionally, caution should be exercised with certain types of training, like skid control (Katila et al., 2004), as it may not significantly reduce accidents.
The findings of the study offer several valuable insights to enhance road safety. First, the perception that male drivers have higher PM skills than female drivers suggests that safety programs should address potential overconfidence in male drivers, which can lead to riskier driving behaviour. Additionally, the finding that safety orientation increases with age suggests that younger drivers may benefit from targeted safety campaigns. Since academic education does not directly affect safety skills, integrating road safety awareness into the curriculum at all educational levels can help improve safety. While on-road driving exposure improves PM skills, it does not improve safety skills, highlighting the need for formal safety training for all drivers, regardless of experience. Furthermore, the decreased safety orientation with higher weekly driving distances indicates that longer drivers should undergo regular safety assessments to prevent becoming too comfortable or careless. The lower safety orientation among professional drivers indicates this group’s need for specialised safety programs. Finally, formal training significantly improved safety skills and orientation, making it essential to emphasise structured, comprehensive training.
5. Conclusions
The overall aim of the study was to assess whether SDS was aligned with drivers’ performance. The questionnaire and the photographic speed survey developed in the study were used to assess subjective driving skills as a data-triangulated method. The responses to the survey were within an acceptable limit of skewness for the factor analysis, and factor analysis confirmed the two-factor structure: PM and safety skills. Further, the DLC test found that the proposed method of assessing SDS aligned with driver performance. The correlation and regression analysis were performed to understand the influence of socio-demographic variables on PM skills, safety skills, and safety orientation. This analysis revealed that male drivers perceived slightly higher PM skills than female drivers, which indicates that male drivers are more skilled at operating vehicles than female drivers. As age increases, perceived PM skills significantly decrease, while safety orientation increases, suggesting that younger drivers may have a higher propensity for road accidents. Academic education did not significantly affect safety skills or safety orientation, suggesting that higher academic education does not enhance safety emphasis. On-road driving exposure (including being a professional driver, years of driving, and weekly distance) increases PM, reflecting a stronger belief in vehicle control ability. However, it does not improve safety skills, and higher weekly distances significantly decrease safety orientation, suggesting extensive driving may not correlate with safer behaviours. However, the literature indicates that increased exposure reduces accident rates by enhancing critical skills like hazard perception, visual attention, and task attention. Training methods influence safety emphasis, with formally trained drivers demonstrating slightly higher safety skills and safety orientation. This highlights the need for enhanced training programs in India, focusing on specific skills like hazard perception rather than general training. However, caution is advised with certain training types, such as skid control, as they may not effectively reduce accidents, as per the literature.
The study has certain limitations that must be acknowledged. Firstly, an imbalance in the representation of socio-demographic factors could influence the results; for example, there is an overrepresentation of male participants and an underrepresentation of drivers aged 60 and above. Additionally, the sample was a convenience sample, which may introduce selection bias and limit the generalizability of the findings. For example, although most sample drivers engage in regular driving, their trips are primarily limited to routine commutes for office or academic purposes, excluding taxi drivers. As a result, the sample may not be exposed to a wide range of road types, traffic patterns, or environmental conditions. The questionnaire, meant for the control level, contains partially or fully capturing manoeuvring or strategic-level items. Further, the photographic speed survey may also reflect hazard perception skills, as variation in recognising potential hazards could influence drivers’ speed choices, even without a time limit for response. Another limitation of this survey is that it cannot capture dynamic traffic situations, as it was designed to focus on how drivers respond to specific scenarios for a controlled analysis of their driving behaviour. Finally, the sample size for the DLC test, used to study the alignment of the assessed SDS with driver performance, was limited to only 20 participants.
Future studies could focus on motorcyclists, truck drivers, and bus drivers by adopting a few common questionnaire items, such as controlling the vehicle in the event of potholes or damages. Additionally, the questionnaire items and photograph complexity should be tailored to the unique demands of each vehicle type. The photographic survey could be tested to see whether it captures hazard perception skills. Furthermore, safety skills should be tested alongside the DLC test to assess their impact on driver performance in manoeuvring tasks. Finally, vehicle type factors (e.g., engine, model, transmission) should be considered alongside socio-demographic characteristics, as the PM skills required for specific vehicle control tasks may vary with advancements in vehicle features.
CRediT contribution statement
R. Arichandran: Conceptualization, Data curation, Formal analysis, Methodology, Software, Writing—original draft, Writing—review & editing. Mithun Mohan: Conceptualization, Methodology, Supervision, Writing—review & editing. M. Sreekumar: Conceptualization, Methodology, Supervision, Writing—review & editing.
Declaration of competing interests
The authors have no conflict of interest to declare.
Data availability
Data will be available upon request.
Ethics statement
Ethical approval was granted through a permission letter from the institute detailing the study’s purpose and confidentiality measures. Participants received oral information about the study and a copy of the letter if interested.
Funding
This work did not receive any financial support.
Editorial information
Handling editor: Mette Møller, Technical University of Denmark, Denmark.
Reviewers: Filbert Francis, Lund University, Sweden; Willem Vlakveld, SWOV Institute for Road Safety Research, the Netherlands.
Submitted: 5 September 2024; Accepted: 12 February 2025; Published: 10 March 2025.