Mixed Logit Model and Classification Tree to Investigate Cyclists Crash Severity
Abstract
Growing concerns about emissions, urban traffic congestion, and the promotion of an active lifestyle are inducing more people to choose bike for their daily commute. The increase in bike usage underscores the need for improving the cyclist’s safety. Our study examined the 72 363 cyclist crashes that occurred in Great Britain in the period 2016-2019 with the objective of (1) examining how various factors influence cyclist crash severity, (2) identifying complex interactions among these crash patterns, and (3) proposing countermeasures aimed at solving the identified risk factors. To achieve these goals, a Classification Tree (CT) model was used as an exploratory tool to detect patterns and interactions that may not have been hypothesized a priori and an econometric approach, such as Mixed Logit Model (MLM), was used to quantify global effects and test the interactions identified by the CT and all the explanatory variables within a statistically rigorous framework. Specifically, six interaction variables were identified from the CT terminal nodes with the highest probability of fatal crashes by tracing back their pathways to the root node. These interactions were then included as additional explanatory variables in the MLM to guarantee that all risk factors were tested within a unified statistical framework. Interestingly, all the interactions were statistically significant. Thus, the CT model is explicitly used as a supporting tool to identify potential interactions, while conclusions are extracted from the MLM results. Based on the identified risk factors, a set of targeted safety countermeasures has been proposed to minimize cyclist crash severity and improve overall road safety.
1. Introduction
The emphasis on encouraging cycling has a great importance for European cities and towns, because it constitutes a key element to reach climate objectives, such as the EU’s ambitious target to reduce emissions by a minimum of 55% by 2030 (European Union, 2021). The rising concerns regarding greenhouse gas emissions, urban traffic congestion, and the active lifestyle promotion have resulted in a transformation in transportation habits. Indeed, an increasing number of road users choose the bikes as their daily commuting mode (European Commission, 2020).
Moreover, in Great Britain, cyclist traffic increased by 50% between 2004 and 2022 (Department for Transport, 2023). The rise in bike usage represents a significant phenomenon, that indicates an expanding environmental awareness and a commitment to sustainable mobility. However, despite this significant rise in bike usage, Great Britain reports relatively low cycling rates compared to other European countries, with an average of 80 km cycled per person per year between 2016 and 2018. In contrast, countries such as the Netherlands and Denmark have a higher rate, with 865 km and 508 km cycled per person per year respectively (Adminaitė & Jost, 2020). This disparity highlights the varying levels of cycling engagement across Europe and shows the need for complete streets and more tailored design and maintenance projects for the creation of a community that promotes safety, connectivity, and attractiveness through a transportation network that accommodates all modes (Montella et al., 2022). Indeed, the way the streets are designed significantly impacts the transport system. However, the high number of cyclists fatalities and serious injuries show that a significant and rigorous effort to improve the cyclist safety is essential to tackle the challenge of sustainable mobility.
More than ever, the cyclist safety deserves attention and in-depth research, because a growing number of cities is promoting cycling as an economic, green, healthy, and efficient way of transport. At this aim, the definition of a vulnerable road users (VRUs) research is beneficial to identify patterns that affect crash severity and to the development of safety countermeasures to reduce fatalities and serious injuries involving VRUs. This study aims at contributing to the research focused on cyclist safety improvement. Indeed, the use of crash data analysis is necessary for a deeper understanding of the factors associated to cyclist crashes by supporting the implementation of more effective countermeasures (Scarano, Aria, et al., 2023; Scarano, Rella Riccardi, et al., 2023).
The objectives of the research include (1) examining how various factors, such as road-related features, environmental conditions, involved vehicle characteristics, driver attributes, and cyclist-related aspects, influence cyclist crash severity, (2) identifying complex interactions among these crash patterns and refining the regression analysis, and (3) offering useful insights that can support the development of effective countermeasures linked to the identified risk factors.
To achieve these objectives, this study employs both a machine learning tool, the Classification Tree (CT) and an econometric model, the Mixed Logit Model (MLM). The CT model serves as an exploratory tool, detecting patterns and potential interactions that may not have been hypothesized a priori. These insights are then used to refine the MLM, ensuring that all relevant variables and interactions are tested within a unified statistical framework. This approach guarantees that conclusions are based on a rigorous and statistically consistent methodology.
These associations were examined using crash data referred to the 72,363 cyclist crashes that were recorded in Great Britain in the period 2016-2018. This integrative approach, combining econometric and machine learning methodologies, is relatively uncommon in existing literature.
2. Literature review
In the field of cyclist safety research, understanding the factors affecting the crash severity is important. In recent years, several studies have explored this critical area, aiming to uncover contributors to the crashes involving cyclist outcome. Despite the wide research conducted in this field, the issue resolution has not been reached. Consequently, there is a need for more investigations to understand the factors contributing to the cyclist crash severity and our study aims to further investigate these factors by combining two different methodologies: the CT and the MLM. The CT helps in identifying critical scenarios by tracing the decision paths within the model. On the other hand, the MLM is particularly advantageous because it allows us to account for unobserved heterogeneity, providing quantitative and easily interpretable results on each factor impact. This combination of models is relatively uncommon in existing research, and it enables not only to identify the key factors influencing crash severity but also to pinpoint critical associations that can help inform targeted safety measures.
Table 1 provides a concise summary of insights derived from prior studies on cyclist injury severity, employing various methodologies from traditional econometric models to advanced machine learning techniques.
2.1. Factors influencing cyclist crash severity
Several studies in the last decade have emphasized the association of higher speed limits with the most severe outcomes occurrence (Behnood & Mannering, 2017; Chen & Shen, 2016; Dash et al., 2022; S. Islam & Hossain, 2015; S. Liu et al., 2021; Zhu, 2021).
The crash severity is significantly influenced by roadway factors, including the area in which the crash occurs, road and pavement characteristics, the number of lanes, and the presence of road signage (Anysz et al., 2021; Das et al., 2023; Dash et al., 2022; Katanalp & Eren, 2020; Prati et al., 2017; Sener et al., 2019; Zhu, 2021). This reinforces the importance that roadway plays in determining cyclist safety.
Environmental factors are also important as the analysis indicates that the most severe cyclist crashes are more likely to occur during the summer season, at night, or in low-illumination conditions (Chen & Shen, 2016; Das et al., 2023; Dash et al., 2022; S. Islam & Hossain, 2015; Salon & Mcintyre, 2018; Sun et al., 2022b).
Similarly, individual cyclist characteristics including age, gender, and race have been identified as factors associated to an increase in crash severity (Bahrololoom et al., 2020; Balakrishnan et al., 2019; Behnood & Mannering, 2017; Chen & Shen, 2016; Joo et al., 2017; J. Liu et al., 2020; Macioszek & Granà, 2022; Prati et al., 2017; Sun et al., 2022a; Zhu, 2021). Among cyclists behaviours, alcohol consumption, riding on the wrong side of the road, and helmet and reflective clothing usage significantly influence the crash severity (S. Islam & Hossain, 2015; S. Liu et al., 2021; Wahi et al., 2018).
In motor-vehicle crashes involving cyclists, various factors associated both with the driver as well as the vehicle affect the injury severity. Prior studies identified a significant influence of drivers gender, age, alcohol consumption, distraction, and driving on the wrong side of the road on the cyclist crash outcome (Balakrishnan et al., 2019; Das et al., 2023; Liu and Fan, 2021; Rahimi et al., 2020).
Moreover, the involvement of heavy vehicles and the extent of damage sustained by the vehicles contribute to the likelihood of severe injuries in cyclist crashes. Recognizing this dual aspect highlights the need to consider not only factors specific to cyclists but also the vehicles characteristics (Joo et al., 2017; Katanalp & Eren, 2020).
Several studies focused on crashes occurring at intersections, revealing noteworthy insights. Akgun et al. (2018) found that a higher speed limit reduces safety for cyclists at roundabouts, with the probability of a serious casualty increasing for each additional lane on approach and with a higher entry path radius. Shen et al. (2020) extended this exploration to various intersection types, including roundabouts, crossroads, and T-junctions, highlighting differences in factors influencing cycling safety across these intersections. Another perspective was offered by Wahi et al. (2018) who identified factors contributing to bike-motor vehicle crash severity under different traffic control measures at intersections. Their findings indicated increased injuries for cyclists aged 40-49 and 60+ without helmets, particularly at regulated intersections. Especially, faulty cyclists experienced more severe injuries at stop signs, with speed emerging as an important risk factor specifically at these intersections. Bahrololoom et al. (2020) focused on bike-car crashes at intersections, showing that pre-collision car kinetic energy and post-collision bike kinetic energy affect injury severity. The study further highlighted that older cyclists are more susceptible to severe crashes, while the use of helmets serves as a mitigating factor in injury severity.
2.2. Methodologies employed in previous studies
The literature analysis indicates different methodology families employed in previous studies (Table 1). Among them, econometric models have a solid foundation for crash analysis. They can be classified into ordinal and non-ordinal methods. The ordinal models, such as Ordered Logit (S. Liu et al., 2021), Ordered Mixed Logit (Balakrishnan et al., 2019; Chen & Shen, 2016), Ordered Probit (Joo et al., 2017; S. Liu et al., 2021), Geographically Weighted Ordinal Logit (J. Liu et al., 2020) and Generalized Ordered Logit (Chen & Shen, 2016; Shen et al., 2020) have been used to analyse the crash severity in a graduated manner, considering increasing levels of injuries.
On the other hand, non-ordinal models included the Generalized Additive Model (Chen and Shen., 2016), the generalized linear model (Xing et al., 2020), the Logit Model (Akgun et al., 2018; Dash et al., 2022; Macioszek & Granà, 2022; Salon & Mcintyre, 2018; Sener et al., 2019), the Mixed Logit (Bahrololoom et al., 2020; Behnood & Mannering, 2017; Das et al., 2023; S. Islam & Hossain, 2015; Sun et al., 2022b, 2022a; Wahi et al., 2018), the Partial Proportional Odds Logit (S. Liu et al., 2021; Shen et al., 2020), and the Latent Class Analysis (Sun et al., 2022a).
Furthermore, the literature analysis indicates a growing use of machine learning techniques such as Association Rules (Anysz et al., 2021), Decision Trees (Dash et al., 2022; Joo et al., 2017; Katanalp & Eren, 2020; Prati et al., 2017; Rahimi et al., 2020; Xing et al., 2020), DT-Based Converted Fuzzy Logic (Katanalp & Eren, 2020), Random Forest (Dash et al., 2022; Rahimi et al., 2020), Gradient Boosting (Zhu, 2021) and Bayesian Network (Prati et al., 2017; Sun et al., 2022b).
The machine learning methods are characterised by their ability to handle complex and nonlinear relationships in data without specific assumptions about data distribution. Thus, in presence of large and complex datasets, machine learning technique may be preferred to econometric models, needing short data preparation time, and providing enough accuracy (F. Mannering et al., 2020; Montella et al., 2021; Moral-Garcia et al., 2019; Rella Riccardi, Galante, et al., 2022; Zhu, 2021).
Thus, while econometric models provide a solid analytical framework, machine learning methods offer the more flexibility to address complex relationships and dataset.
In this paper, both econometric methods, such as the Mixed Logit Model (MLM), and machine learning tools, specifically the Classification Tree (CT), were employed to identify the factors influencing the cyclist crash severity.
Among econometric models, the MLM was chosen because it accounts for unobserved heterogeneity among observations, providing a full understanding of variability in the data. This is particularly useful in the context of cyclist crashes, where individual characteristics may affect outcomes (Rella Riccardi, Mauriello, Sarkar, et al., 2022; Scarano et al., 2022b). Moreover, our study introduces an innovative approach that combines both traditional econometric methods and machine learning techniques. While traditional econometric models provide a solid foundation in statistics and econometrics field, our research makes a step forward by also using advanced machine learning tools such as the CT. This integration represents a conventional practice that overtakes the singular method limitations.
Finally, our study is in line with the contemporary trend in the literature, showing a growing trust on machine learning techniques. The inclusion of decision trees as data mining tools, as showed in a recent analysis carried out by Scarano et al. (2023), represents a progress in our research. Indeed, CT emerge as a practical technique able to effectively manage discrete variables or variables with a high number of categories. This approach not only demonstrates ability in handling outliers but also eliminates the need for a priori assumptions regarding variable distributions, overcoming the regression model limitations (Prati et al., 2017).
| References | Method | Objective | Main findings |
| [b@442069] | Logit | To investigate which design factors, influence cyclist severity at give way (non-signalized) roundabouts with mixed traffic | A higher speed limit reduces the safety for cyclists at roundabouts. The probability of a serious casualty increases five times for each additional number of lanes on approach and by 4% with a higher entry path radius. |
| [b@442073] | Association Rules | To identify factors and conditions contributing to cyclists’ serious crashes | Daylight reduces traffic signal impact on slight injuries in urban areas, with no significant rules for fatal and severe injuries. In non-urban areas, the absence of daylight and dual roadway results in fatal and severe injuries |
| [b@442075] | Newtonian Mechanics; Mixed Logit | To investigate the relationship of cyclist’s injury severity with various parameters in bike-car crashes at intersections | Pre-collision car kinetic energy and post-collision bike kinetic energy impact injury severity. Older cyclists suffer more severe crashes, helmet usage reduced injury severity. |
| [b@442076] | Ordered Mixed Logit | To identify the socioeconomic characteristics influencing injury severity heavy trucks -VRUs crashes | Injury severities are affected by the age and gender of road users and sociodemographic factors such as age, language, occupation, religion, and income |
| [b@442077] | Mixed Logit | To investigate factors that contribute to the cyclist injury severity in bike-MV crashes while systematically accounting for unobserved heterogeneity within the crash data | Injury severities are affected by cyclist and driver race and gender, alcohol impairment in cyclists or drivers, the age of cyclists, riding or driving on the wrong side of the road, drivers’ unsafe speeding, and the absence of a cyclist helmet |
| [b@442082] | Generalized Ordered Logit; Generalized Additive |
To estimate the effects of built environment factors on cyclist injury severity in MV- bike crashes, and to accommodate possible spatial dependence among crash locations. | Higher employment density correlates with lower injury severity. Land use mixture reduces severe injuries or fatalities. Reflective clothing and improved street lighting decrease cyclist injuries, while higher speed limits, older age, and involvement of trucks increase the risk of severe crashes |
| [b@442084] | Mixed Logit | To examine the key contributing factors influencing cyclist injuries | Distracted drivers, elderly cyclists, and riding in dark conditions increase the likelihood of severe injuries in MV-cyclist crashes. Conversely, straight level roadways and city streets decrease the odds of severe injuries |
| [b@442085] | Logit; Decision Tree; Random Forest | To understand the critical factors that influence severe cyclist crash and identify countermeasures | Inadequate lighting conditions, crashes on roadways, speed limits, average annual daily traffic, number of lanes, and weekends are the factor affecting cyclist crashes |
| [b@442093] | Mixed Logit | To compare the influence of various variables on injury severities in pedestrian-MV and bike-MV crashes | Injury severities are affected by use of retroreflective clothing, older age, dark roadway, and low speed roadway. Time of day and weather, resulted random parameters |
| [b@442095] | Decision Tree; Ordered Probit | To examine the impacts of contributing factors on the cyclist injury severity | Factors affecting injury severity were the cyclist age and the presence of trucks |
| [b@442098]. | C4.5 Decision Tree; DT-Based Converted Fuzzy Logic; | To examine the effect of several parameters on cyclist injury severity and validate the new fuzzy decision approaches for the classification of cyclist injury severity | The most important factors in bike-MV crash severity are gender, vehicle damage extent, road type, pavement type, crash type, and MV manoeuvres |
| [b@442102] | Ordered Logit; Partial Proportional Odds Logit |
To Investigate factors influencing injury severity in bike crashes on weekdays and weekends | Factors like older aged cyclists, riding direction, pickup, older aged drivers, male drivers, and specific time periods are significant only on weekdays. Speed limits, time of day, alcohol usage, and specific road characteristics affect injury severities only on weekends. |
| References | Method | Objective | Main Findings |
| [b@442101] | Geographically Weighted Ordinal Logit | To generate new knowledge about bike safety using spatial modelling | Cyclist injury severity increases with older cyclists, cyclist intoxication, and higher MV speeds |
| [b@442105]. | Logit | To identify factors that influence the occurrence and severity of cyclist injury in cyclist-MV crashes | Factors affecting cyclist injuries and deaths include driver attributes (gender, age, alcohol, speeding), cyclist attributes (age, alcohol, speed), and crash details (vehicle type, crash location, time, type) |
| [b@442122] | CHAID Decision Tree; Bayesian Network | To investigate the factors predicting the severity of bike crashes | The key predictors were road type, crash type, cyclist’s age, road signage, cyclist’s gender, type of opponent vehicle, month, road segment type, and opponent vehicle type |
| [b@442123] | Random Forests; Decision Trees | To recognize fatality patterns in large truck-involved pedestrian/bike crashes | On local roads (AADT > 38,000), intersections and vehicle speeding are crucial for injury severity. On High-volume roads (non-local), young/middle-aged truck drivers, divided roadways, speeding, and midday increase fatal outcomes. On low-volume roads, clear weather, median barrier, and curb shoulder near a signalized intersection affected fatal crashes |
| [b@442143] | Separate Mixed Logit | To identify factors that contribute to bike-MV crash severity under different traffic control measures at intersections | Injuries increase for cyclists aged 40-49 and 60+ without helmets, particularly at regulated intersections. Faulty cyclists experience more severe injuries at stop signs, with speed being a risk factor specifically at stop signs |
| [b@442129] | Bivariate Analysis; Logit | To illuminate key determinants of crash severity for both pedestrian and cyclist | State highway crashes, late-night hours, and daylight contribute to crash severity. Summer increases serious outcomes for faulty cyclist crashes. Cyclist characteristics such as race, sobriety, age over 64 affect crash severity |
| [b@442134] | Logit | To identify factors associated with crash frequency and severity for pedestrians and cyclists | Crash frequency and severity are affected by travel demand, commute behaviours, network characteristics, and sociodemographic features |
| [b@442135] | Generalized Ordered Logit; Partial Proportional Odds |
To explore the contributing factors to cyclist injury severity on roundabouts, crossroads, and T-junctions | The factors that affect cycling safety at various intersections show enormous differences |
| [b@442137] | Mixed Logit; Bayesian Network | To analyse VRUs-MV crashes across seasons using a hybrid method to identify significant factors and their interactions. | Certain factors increase fatality likelihood when combined, like functional zone in spring and summer and MV type in fall and winter. |
| [b@442138] | Latent Class Analysis; Mixed Logit | To identify contributing factors to cyclist crashes in cold regions | Male cyclists have a higher winter fatality risk. |
| [b@442148] | Generalized Linear Model; Classification Tree |
To identify the influence factors on injury severity of electric and non-electric bike crashes | The factors influencing non-electric bike crashes are signal control mode, MV type, visibility, lighting condition, motor vehicle license possession, and the type of MV. |
| Zhu, s., 2021. | Gradient Boosting | To investigate the contributing factors to fatalities and injuries involving cyclist | Key predictors are gender, arterial road type, 100 km/h speed zone, young drivers, dark conditions, crash type, and cyclists age. |
3. Data
Crash data were retrieved from the STATS19 dataset (https://www.gov.uk/transport-statistics-notes-and-guidance-road-accident-and-safety). This dataset includes records of road crashes resulting in personal injuries, involving at least one vehicle, that occurred on public roads in Great Britain. Notably, the dataset does not include information about Property Damage Only (PDO) crashes. These data were collected by law enforcement at the crash scene or reported by the public at a police station. For the purposes of this study, we carried out an analysis of crashes that occurred in the Great Britain during the three-year period from 2016 to 2019.
Initially, the dataset was presented in three separate subsets, containing information on the crashes, the involved vehicles, and the casualties, respectively. The crash dataset consisted of thirty-two variables to describe the crash, the vehicle dataset included twenty-two variables describing all the vehicles involved, and the casualty dataset contained sixteen variables characterising the road users injured or killed in the crashes. To work with a unified dataset, we merged these three subsets using the unique crash index for each crash.
In order to improve the performance of our statistical tools, an initial data preprocessing was conducted by joining specific categories and reorganizing redundant information. Regarding the vehicles involved in the crash, the analysis focus on the bikes and a second vehicle, because a very small percentage of cyclist-related crashes involved more than two vehicles.
The final dataset includes a total of 72,363 cyclist-related crashes. This dataset was reorganized into forty explanatory variables as shown in the Appendix A, Tables A1-A4. The variables were divided into roadway (Table A1), environmental (Table A2), vehicle (Tables A2 and A3), cyclist, and driver-related variables (Table A4). The crash severity, which represents the response variable, was based on the injury severity of the most seriously injured person involved in the crash. It was classified into three categories: slight injury, serious injury, and fatal. A fatal crash was defined as a crash in which at least one person was killed instantly or within 30 days from the crash. A serious injury crash was referred to crashes resulting in injuries that required hospitalization or involved fractures, concussion, internal injuries, burns (excluding friction burns), severe cuts, severe general shock requiring medical treatment, or injuries causing death 30 or more days after the crash. Finally, slight injuries were referred to minor injuries.
The database used in this research comprised 429 fatal crashes (0.59% of all crashes), 14,890 serious injury crashes (20.58% of all crashes), and 57,044 slight injury crashes (78.83% of all crashes).
4. Method
To ensure a complete understanding of the factors influencing cyclist crash severity, this study adopts an integrative methodological approach that combines econometric modelling with machine learning techniques. The CT model is leveraged as a preliminary exploratory tool to uncover complex interactions and high-risk crash scenarios. The insights derived from the CT analysis are then systematically incorporated into the MLM, allowing for a statistically rigorous evaluation of both main effects and interaction terms.
4.1. Classification tree
Classification trees represent a methodology aimed at obtaining a hierarchical segmentation of the cyclist crashes by iteratively partitioning the dataset into subgroups that are homogeneous in terms of cyclist crash severity. This process shows the variables that have the stronger influence on the outcome.
The tree is a directed graph that starts from a root node. Then, this root node is progressively split into leaf nodes by using an explanatory variable named “splitter”. Although all independent variables are considered potential candidates for splits at each internal node, the predictor that makes the best partition is selected.
We implemented the Classification and Regression Trees (CART) algorithm introduced by Breiman et al. (1984). The evaluation of impurity at each node was performed using the Gini reduction criterion. A higher Gini index value indicates increased homogeneity in the node resulting from the split. The Gini reduction criterion is calculated as follows:
where represents the proportion of observations in node belonging to the jth class of the response variable. A node is pure when contains all observations belonging to a single severity class, resulting in an impurity value of zero.
The total impurity of the tree (T) is calculated as follows:
where represents the impurity of the node is the node’s weight is the count of observations in node is the overall count of observations), and denotes the all the terminal nodes in the tree. The terminal nodes exhibit lower impurity levels in contrast to the root node. The overall impurity of the tree decreases through the identification, at each tree node, of the optimal partitioning of observations into distinct severity classes, ensuring external heterogeneity and internal homogeneity.
The CART algorithm comprises the following steps:
-
generate the set S of all possible partitions obtained from the predictor set X;
-
for each split s in the set S, calculate the impurity reduction;
-
determine the best partition associated with the maximum impurity reduction.
The algorithm is applied to each node until the tree construction stops. Before choosing the most appropriate stopping criterion for the tree, a literature review was carried out (Table 2).
| References | Levels* | Stopping criterion |
| [b@442067] | 4 | Sensitivity analysis: entropy decrease |
| [b@442081] | 5 | Sensitivity analysis: confusion matrix |
| [b@442090] | 4 | Minimum impurity decreases (improvement = 0.0001) |
| [b@442097] | 4 | Minimum evaluation error |
| [b@442099] | 4 | Minimum cardinality of node subject to dividing; minimum cardinality of the node resulting from dividing; maximum number of tree levels |
| [b@442100] | 3 | Missing** |
| [b@442103] | 4 | Maximum tree depth set at 4 levels |
| [b@442109] | 3 | Minimum evaluation error |
| [b@442112; @442113; @442115] | 3,4 | Minimum impurity decreases (improvement = 0.001) or maximum tree depth set at 4 levels |
| [b@442121] | Missing** | Minimum impurity decreases; Limit for the minimum number of observations in a leaf |
| [b@442124; @442125] | 4 | Minimum impurity decreases (improvement = 0.001) or maximum tree depth set at 4 levels |
| [b@442128] | 20 | Minimum cross-validated error; at least two observations in each leaf |
Based on the information presented in Table 2, it was decided to adopt stopping techniques according to two criteria: (1) when the decrease in Gini index fell below a minimum threshold set at 0.0001; and (2) when the tree reached a maximum depth of 4 levels.
For each node, the assigned severity class depends on the PCR highest value. This PCR compares the percentage of observations for each severity class in the terminal node with those in the root node (Rella Riccardi, Galante, et al., 2022):
where denotes the crashes in node belonging to severity class is the tree root node.
For each node, the class with the highest PCR value determines the class of that node, selected as follows:
The terminal nodes allow us to identify relationships between variables that affect the severity of cyclist crashes. The classification trees were carried out using the SPSS software.
4.2. Mixed logit
The MLM represents a generalized version of multinomial logistic regression (Rella Riccardi, Mauriello, Scarano, et al., 2022). Unlike the standard logit model, the MLM allows coefficients of the variables βj to vary across observations or groups of observations. Thus, the βj coefficients can be decomposed into their means and standard deviations (F. L. Mannering et al., 2016):
In the contest in which the MLM is applied to predict crash injury severity, the propensity of crash i (where i = 1,…, 72,363) towards the severity category j (where j varies from 1 to 3: 1 = slight injury, 2 = serious injury, 3 = fatal) is expressed through the injury-severity function Sij, which is determined by the sum of Vij (the systematic component) and εij (the unobservable stochastic error):
where is a column vector of characteristics (explanatory variables) that influence the cyclist injury severity level j, is a column vector of the parameters to be estimated for the crash severity category j, and is the error term assumed to be independently and identically distributed (McFadden & Train, 2000; Washington et al., 2020).
The mixed logit probability represents a weighted average of the standard logit probabilities at different values of parameter β. Thus, the mixed logit probability is the integral of standard logit probabilities over a density of parameters β, defines as follows (Alogaili & Mannering, 2020; Train, 2009):
where: f(β|σ) is the continuous density function adopted by vector σ is a vector of parameters that specify the density function (mean and variance), and all other terms are as previously defined (Anastasopoulos & Mannering, 2011). Note that in the simplified case where f(β|σ) = 1, the model reduces to the standard logit (Washington et al., 2020)
A normal distribution is chosen for f(β| due to its proven suitability over other distributions studies (Azimi and Asgari, 2023; M. Islam et al., 2022; Uddin & Huynh, 2020).
To determine which variables should be treated as random parameters, we employed a forward stepwise selection procedure based on the improvement of model fit, as measured by the Akaike Information Criterion (AIC) which balances model complexity and goodness of fit (Burnham & Anderson, 2004). Specifically, we initially estimated a base model with only fixed effects and sequentially introduced random effects for different variables, retaining only those that improved model performance in terms of AIC values. Furthermore, since categorical variables were transformed into dummy variables, only specific categories were tested as random rather than the entire variable.
The βj coefficients explain the effect of the independent variables. For a proper interpretation of the model results, it is important to assess the magnitude of the impact of the independent variables on the dependent variable. In evaluating the explanatory variable influence on the crash severity, various methodological approaches are available, including odds ratio, marginal effect, or elasticity (Lord et al., 2021). Among these, Odds Ratio (OR) stands out as the most practical choice (Norton & Dowd, 2018). The OR is the exponentiation of βj (exp(βj)), showing the proportional increase (OR > 1) or decrease (OR < 1) in the likelihood of the outcome when the corresponding indicator variable is set to 1 (Lord et al., 2021). Thus, the OR provides a complete understanding of the impact of each variable on the outcome, representing a vigorous and convenient tool for analysing the complexities of factors influencing the cyclist crash severity.
The MLM was executed in the R-CRAN software environment by using the “mlogit” package.
As part of the preliminary analysis, a chi-square test was conducted to identify any significant relationships between our categorical variables. Using a significance level of 10%, the test results show there is not any statistically significant relationship between the variables.
4.3. Performance metrics
In the cyclist crash severity analysis, the model performance assessment is important to guarantee a complete understanding of the factors associated with cyclist crash severity.
For the MLM, the McFadden’s Pseudo R2 was employed:
where: LL0 is the loglikelihood of the null model and LLfull is the loglikelihood of the model including all the statistically significant variables.
The McFadden’s Pseudo R2 metric works as a goodness of fit indicator in discrete choice models. Specifically, it shows how much variance the full model that incorporate independent variables explains in the data compared to what would be explained using the null model. The McFadden’s Pseudo R2 variability range is between 0 and 1 with the higher values indicating better model performance. McFadden’s Pseudo R2 greater than 0.20 indicates a very good fit (Andreß et al., 2013).
For both the MLM and the CT tool, our focus extends to the G mean and F measures as performance indicators. They are composite indicators that integrate more individual metrics into a unified performance measure (Guo et al., 2008).
The G-mean (Eq. 9) shows how well the model can correctly identify both positive and negative instances:
where:
is the true negative rate; TN is the number of true negatives; FP is the number of false positives;
is the true positive rate; TP is the number of true positives; FN is the number of false negatives.
The F-measure (Eq. 11) balances precision and recall, providing an assessment of the model performance in terms of true cases classification. Thus, a higher F-measure value reflects a better trade-off between precision and recall.
where:
is the accuracy of positive predictions among the instances predicted as positive;
is the model capacity to identify all actual positive instances;
is a coefficient to adjust the relative importance of precision versus recall.
was set 1 indicating an equal emphasis on both precision and recall (Bekkar et al., 2013).
5. Results
5.1. Classification tree
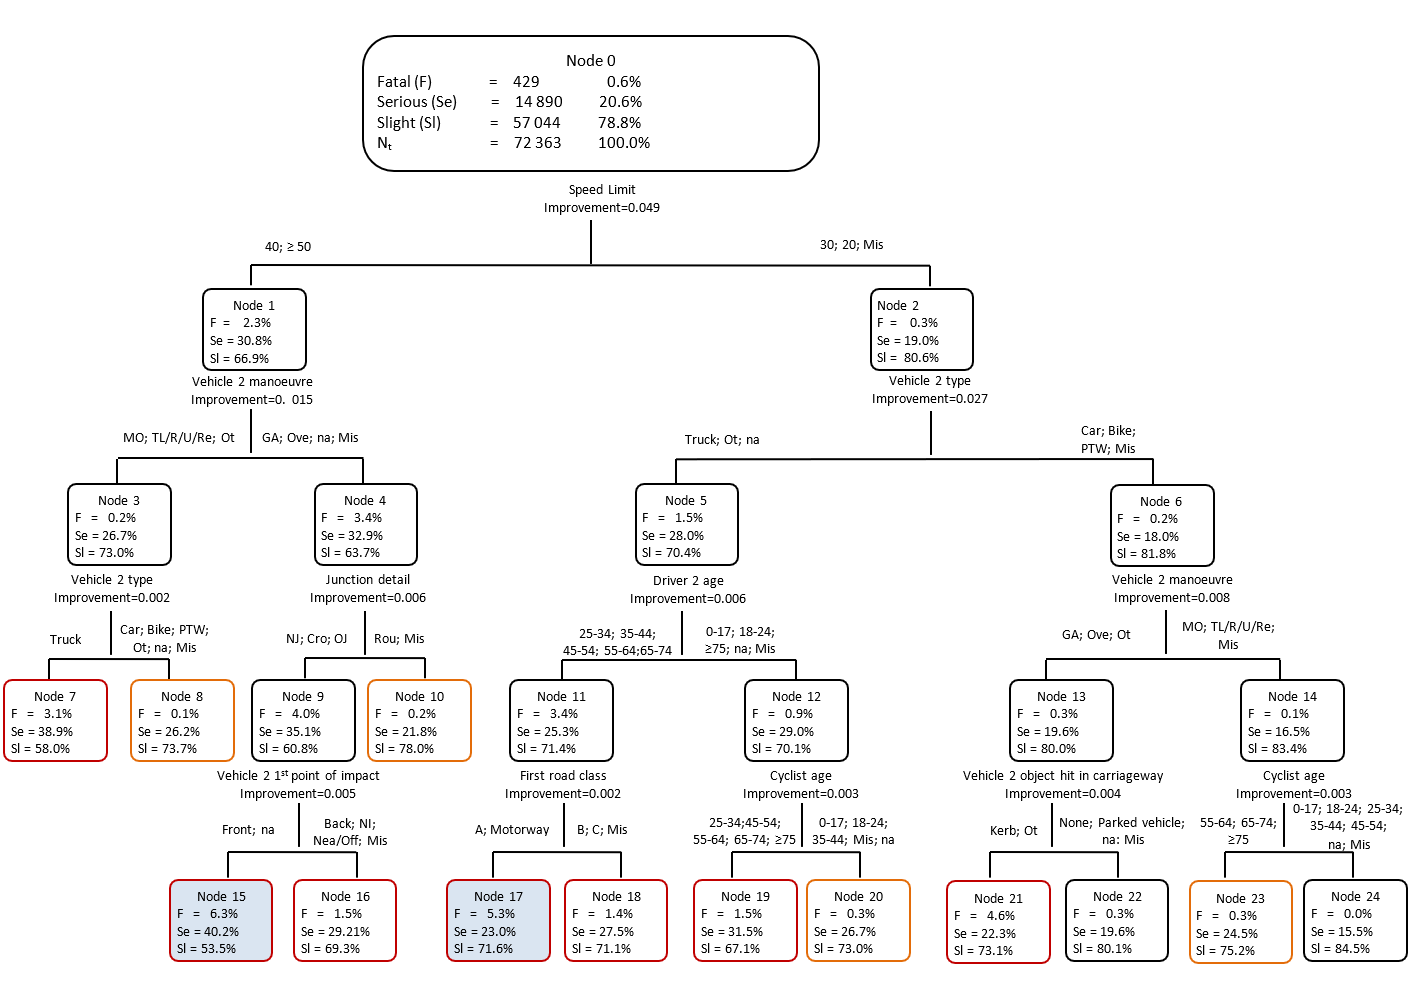
The CT is composed by 13 terminal nodes (Figure 1). Among these terminal nodes, 7 are associated with fatal crashes, 4 with serious injuries, and the other 2 with slight injuries.
The CT starts from a first splits based on the speed limit. Furthermore, the following splits are based on nine specific variables, including the manoeuvre of the second vehicle, vehicle 2 type, driver age, junction type and details, the first road class, and the first point of impact of the second vehicle, the cyclist age, and whether the second vehicle hit an object in the carriageway.
The PCR was calculated for all terminal nodes to evaluate how well each node predicts a crash severity class (Table 3). The nodes 15, 17 and 21 demonstrates higher PCRs (10.62, 8.97, and 7.71, respectively), by highlighting their effectiveness in fatal crash prediction.
The Node 15 has a PCR of 10.62. It highlights a scenario that includes situations where the speed limit exceeds 50 mph, the second vehicle is overtaking or proceeding straight, the crash occurs outside an intersection or at crossroads, and the second vehicle’s first point of impact is the front of the bike. This combination of factors creates a dangerous situation that increase the fatal crash likelihood.
Node 17, which has a PCR of 8.97, starts from a split based on speed limit between 20 and 30 mph. At these speed limits, fatal crashes are associated with specific conditions such as the truck involvement, the driver of the second vehicle aged between 25 and 74 years, and the first road class equal to A or a motorway. These conditions together create a hazardous scenario where even moderate speeds can result in fatal cyclist crashes.
Node 21 has a PCR of 7.71 and represents another dangerous scenario including a speed limit split of 30 mph, the involvement of a car or a two-wheeler (e.g., bike or PTW) proceeding ahead or overtaking and colliding with a curb. Furthermore, the collision with the curb increases the proportion of fatal crashes from 0.003 (node 13) to 0.046 (node 21).
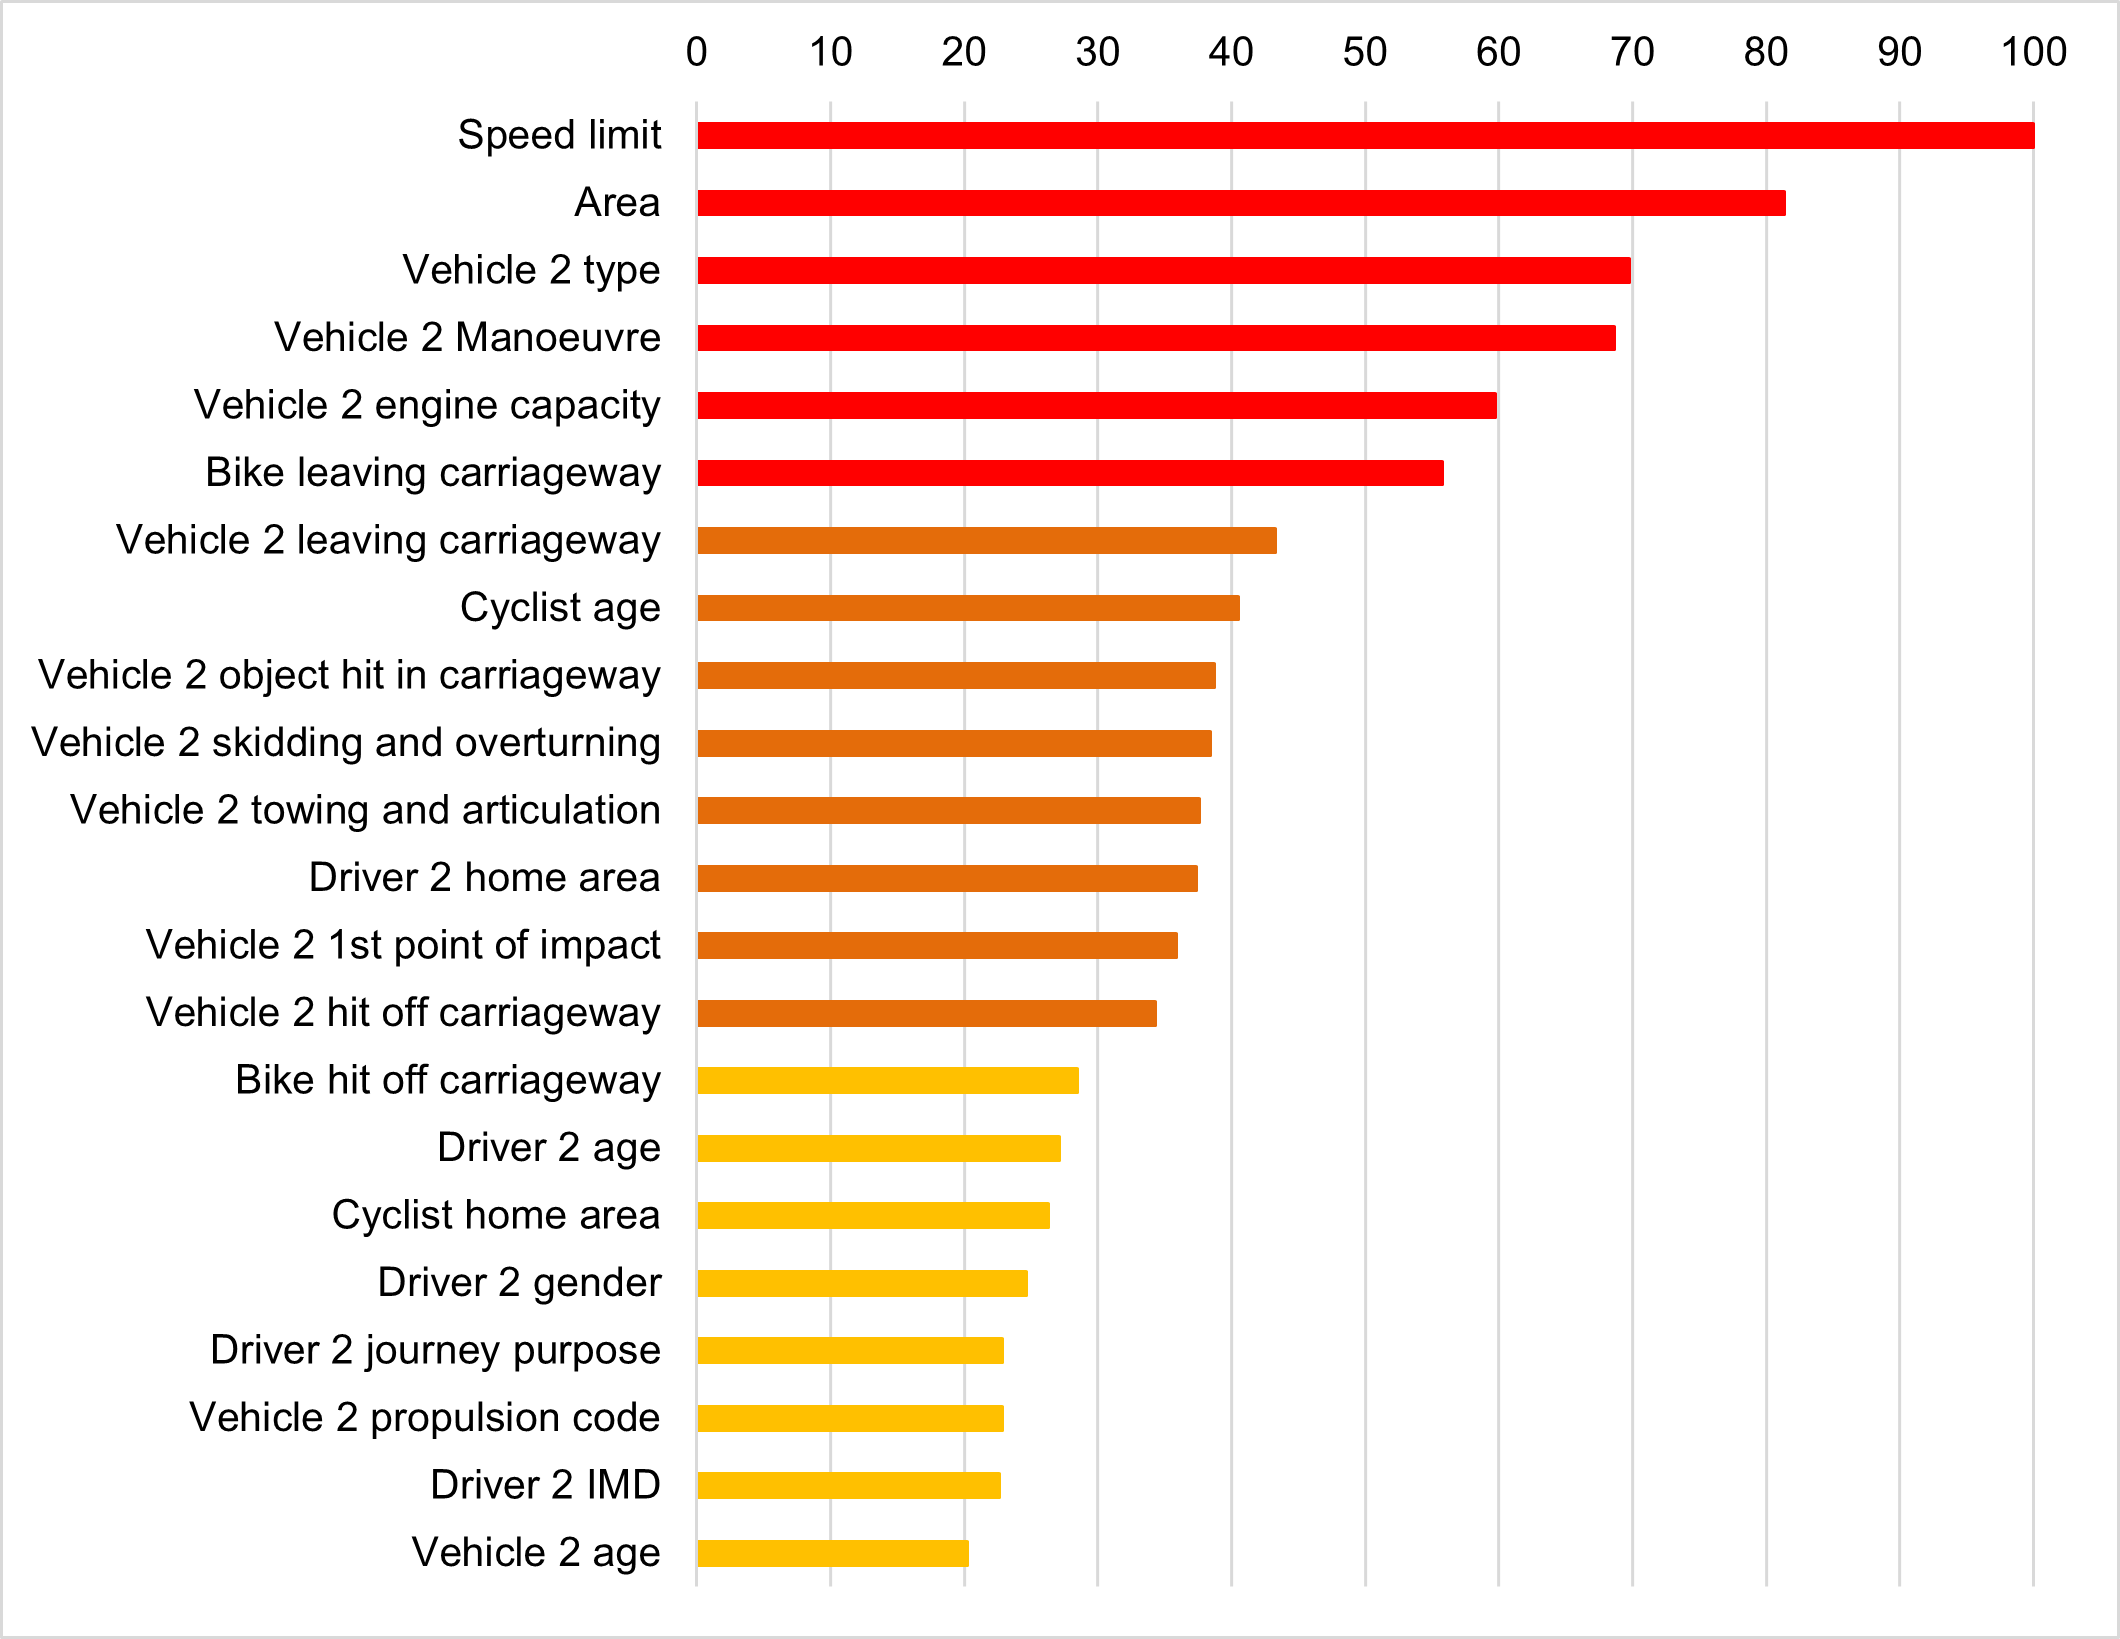
Regarding variable importance, the Figure 2 highlights variables with normalized importance above 20%. Six of these variables have normalized importance greater than 50%, indicating they are significant in classifying crash severity:
-
speed limit is recognized as the most important variable. It provides insights about the maximum speed allowed on the road where the crash occurred,
-
area contributes to understand whether the cyclist crash occurred in an urban or rural setting,
-
vehicle 2 type classifies the type of the second vehicle that collides with the bike,
-
vehicle 2 manoeuvre explains the manoeuvres performed by the second vehicle during the crash, including going ahead, moving off, overtaking, turning left, turning right, U-turns, and reversing,
-
vehicle 2 engine capacity denotes the engine capacities for the second vehicle involved in the cyclist crash, and
-
bike leaving carriageway indicates whether the bike remained on the carriageway, moved towards the nearside, or moved towards the offside during the crash.
| Terminal node | PCR | Actual Predicted Class | ||
| Fatal | Serious | Slight | ||
| 7 | 5.15 | 1.89 | 0.74 | Fatal |
| 8 | 0.21 | 1.27 | 0.93 | Serious |
| 10 | 0.33 | 1.06 | 0.99 | Serious |
| 15 | 10.62 | 1.96 | 0.68 | Fatal |
| 16 | 2.46 | 1.42 | 0.88 | Fatal |
| 17 | 8.97 | 1.12 | 0.91 | Fatal |
| 18 | 2.37 | 1.34 | 0.90 | Fatal |
| 19 | 2.47 | 1.53 | 0.85 | Fatal |
| 20 | 0.50 | 1.30 | 0.93 | Serious |
| 21 | 7.71 | 1.08 | 0.93 | Fatal |
| 22 | 0.54 | 0.95 | 1.02 | Slight |
| 23 | 0.54 | 1.19 | 0.95 | Serious |
| 24 | 0.04 | 0.75 | 1.07 | Slight |
Results of the CT analysis were used as input for the MLM. Specifically, we identified the first two terminal nodes with the highest PCR for fatal crashes, such as the node 15 and the node 17, and traced their pathways back to the root node, showing the following interactions:
-
Inter 1-4: Interaction between Speed Limit = 40; ≥50 mph and Vehicle 2 manoeuvre = going ahead, overtaking;
-
Inter 4-9: Interaction between Vehicle 2 manoeuvre = going ahead, overtaking and Junction detail = not at junction, crossroads, other junctions;
-
Inter 9-15: Interaction between Junction detail = not at junction, crossroads, other junctions and Vehicle 2 first point of impact = front;
-
Inter 2-5: Interaction between Speed Limit = 30; 20 mph and Vehicle 2 type = truck, other;
-
Inter 5-11: Interaction between Vehicle 2 type = truck, other and Driver 2 age = 25-34; 35-44; 45-54; 55-64; 65-74;
-
Inter 11-17: Interaction between Driver 2 age = 25-34; 35-44; 45-54; 55-64; 65-74 and First road class = A, motorway.
The performance metrics, expressed through F-measure and G-mean, provide an understanding of our model’s predictive capabilities (Table 4).
For fatal crashes, the G-mean index demonstrates a notably high value of 0.78, indicating the model’s ability to accurately identify both positive and negative instances and providing a balanced prediction. However, the F-measure, which balances precision and recall, yields a lower value of 0.06, suggesting a challenge in effectively managing this severity level.
In the case of serious injury crashes, there is a significant improvement in the F-measure, with a value of 0.20, highlighting a better balance between precision and recall. Conversely, the G-mean index for this category is lower, with a value of 0.38, indicating a diminished capacity of the model to recognize both positive and negative instances in a balanced manner.
| Severity level | F-measure | G-mean |
| Fatal | 0.06 | 0.78 |
| Serious injury | 0.20 | 0.38 |
| Slight injury | 0.79 | 0.42 |
5.2. Mixed logit
The findings for both the fixed and random variables are presented in Table 5 where, for each significant variable (p-value <0.05), we reported the estimated value (βj) and its OR.
To refine the regression analysis and explore potential interaction effects, we incorporated the interactions derived from the CT analysis as dummy variables: interaction 1-4, interaction 4-9, interaction 9-15, interaction 2-5, interaction 5-11, interaction 11-17.
In estimating fatal crashes, 21 explanatory variables and 45 indicator variables emerged as statistically significant in addiction to 6 interaction variables. Conversely, for estimating serious outcome, 17 explanatory variables, 30 indicator variables and 5 interaction variables demonstrated statistical significance.
For fixed parameters, for each severity category, positive β coefficients indicate an increase in odds and negative β coefficients indicate a decrease in odds, relative to the reference category.
Understanding the random variable outcomes is a bit more complicated. Examining the normal distribution of random parameters reveals that certain observations in one group are more likely to have a severity level, while others are less likely. In our model, cyclist age ≥75 (specific to the fatal crashes) is a random variable with a mean of 3.29 and a standard deviation of 0.66. According to the normal distribution, it can be inferred that 99.9% of the crashes involving an elderly cyclist had a higher probability of resulting in the fatal severity level. The remaining small percentage (< 0.1%) of the crashes were more likely to result in slight or serious injuries. Another significant random parameter is the indicator variable driver age = 55-64 (specific to the serious injury level), with a mean of -0.12 and a standard deviation of 0.51. The distribution for this variable indicates that 59.0% of the crashes where the cyclist collides with a driver aged between 55 and 65 years old had a higher probability of resulting in a serious injury level, while the remaining 41.0% of these crashes were more likely to result in one of the other severity levels (slight injury or fatal). Additionally, the indicator variable for cyclist gender = male has resulted a significant random parameters for both fatal and serious outcomes. As regards the fatal crashes, the mean and the standard deviation of the random parameter cyclist gender = male were 0.37 and -0.97, respectively. This indicates that 64.7% of the crashes involving a male cyclist had a higher probability of resulting in a fatal outcome, while 35.3% were more likely to result in a slight or serious injury. For serious outcomes, the mean and the standard deviation of the random parameter cyclist gender = male were -0.11 and 1.56, respectively. This indicates that 52.8% of the crashes with male cyclist were more likely to result in severe injuries, while the 47.2% were more likely to result in slight injuries or fatalities.
Among the fixed-effect parameters, high speed limit has a dramatic effect on crash severity. The OR of fatal crashes associated with speed limit equal to 40 mph (with a baseline of 30 mph) is 1.60 and increases to 2.96 for speed limit ≥ 50 mph. If a cyclist crash occurs in a rural area, the probability of both fatal (OR=1.78) and serious injury crashes (OR= 1.25) increases. Compared to the single carriageway the road type with the lower probability of fatal crash is the roundabout with an OR of 0.65. While dual carriageway and slip road have an OR respectively equal to 1.24 and 2.06. Darkness condition shows greater propensity towards most severe crashes having an OR equal to 1.66 for fatal crash and 1.13 for serious crash. The wet/frozen pavement is significant both for fatal crash with an OR of 1.50 and for serious crash with an OR of 1.09, whereas weekend increased the probability of both fatal and serious crashes, with an OR respectively equal to 1.53 and 1.16. Bike leaving the carriageway nearside, offside ore straight are strongly associated with crash severity showing an OR respectively of 3.17, 12.91 and 18.95 for fatal crash. Considering vehicle 2 engine capacity equal to 1501-2000 as baseline, vehicle 2 engine capacity >3000 is associated with higher probability of both fatal crashes exhibiting an OR of 2.24 and serious crash with an OR of 1.13. When the second vehicle skids or overturns, there is a significant increase in the likelihood of both fatal (OR = 2.79) and serious injury crashes (OR = 1.60). Regarding driver related factors, young drivers (≤17, 18-24 years old) increased probability of fatal crash. The most influential variable is the cyclist age. Compared to the young cyclist (25-34), the involvement of an elderly cyclist increases the probability of fatal crashes: 35-44 with an OR of 1.21, 45-54 with an OR of 1.37, 55-64 with an OR of 3.57, 65-74 with an OR of 7.26, and ≥75 (random variable) with an OR of 26.90.
The results of the MLM confirm also that all tested interaction terms are statistically significant, highlighting the risk effect associated with the combination of some factors on crash severity. The interaction between higher speed limits (≥40 mph) and the manoeuvre of the second vehicle (going ahead or overtaking) is associated with an increase in the probability of fatal crashes (interaction 1-4, OR = 1.48). However, this effect is not significant for serious crashes, suggesting that crashes occurring under these conditions are more likely to be fatal rather than serious. Similarly, the interaction between the second vehicle’s manoeuvre and the junction type (not at a junction, crossroads, or other junctions) exhibits a positive effect on both fatal (OR = 2.22) and serious crashes (OR = 1.23) (interaction 4-9). This finding indicates that crashes occurring outside intersections, or at crossroads, become more severe when the second vehicle is proceeding straight or overtaking.
Another significant interaction is observed between junction type and the first point of impact of the second vehicle (front) (interaction 9-15). This interaction increases the probability of fatal crashes (OR = 1.55). Speed limits of 20–30 mph combined with the involvement of a truck also show an effect on crash severity (interaction 2-5). While this interaction increases the likelihood of fatal crashes (OR = 1.37), it is negatively associated with serious crashes (OR = 0.66). This suggests that although lower-speed environments generally reduce crash severity, the presence of truck vehicles can still result in fatal consequences.
The most pronounced effect is observed for the interaction between the involvement of a truck the age of the second driver (25–74 years old) (interaction 5-11). This interaction significantly increases the likelihood of both fatal (OR = 6.04) and serious crashes (OR = 2.53).
Finally, the interaction between driver age and the type of road (A roads or motorways) is associated with an increase in fatal crash risk (OR = 1.49) and a slight increase in serious crashes (OR = 1.06) (interaction 11-17). This suggests that driving behaviour among older age groups, particularly in high-speed road environments, can influence crash severity outcomes.
Thus, the results indicate that specific combinations of factors, such as speed limits, vehicle type, driver age, and road design, can significantly increase crash severity risks.
| Variable | Fatal | Serious | ||||||
| β | OR | Std. Err. | p-value | β | OR | Std. Err. | p-value | |
| Intercept | -1.86 | 0.16 | 0.06 | <0.001 | -0.33 | 0.72 | 0.04 | 0.01 |
| Speed Limit (30 mph as baseline) | ||||||||
| 20 | -0.08 | 0.92 | 0.03 | <0.001 | ||||
| 40 | 0.47 | 1.60 | 0.06 | <0.001 | 0.17 | 1.19 | 0.05 | <0.001 |
| ≥ 50 | 1.08 | 2.96 | 0.06 | <0.001 | 0.50 | 1.64 | 0.06 | <0.001 |
| Area (Urban as baseline) | ||||||||
| Rural | 0.57 | 1.78 | 0.04 | <0.001 | 0.22 | 1.25 | 0.03 | <0.001 |
| Junction control (Not at junction or within 20m as baseline) | ||||||||
| Give way/Stop | -0.53 | 0.59 | 0.03 | <0.001 | -0.05 | 0.95 | 0.02 | 0.02 |
| Traffic lights | 0.32 | 1.38 | 0.05 | <0.001 | ||||
| Pedestrian crossing physical facilities (No physical crossing facilities within 50m baseline) | ||||||||
| Central refuge | 0.69 | 2.00 | 0.06 | <0.001 | ||||
| Pedestrian phase at traffic signal junction | 0.14 | 1.15 | 0.05 | <0.001 | -0.19 | 0.83 | 0.04 | <0.001 |
| Zebra | 0.22 | 1.24 | 0.04 | <0.001 | -0.15 | 0.86 | 0.04 | 0.00 |
| Road type (Single carriageway as baseline) | ||||||||
| Dual carriageway | 0.22 | 1.24 | 0.04 | <0.001 | 0.09 | 1.09 | 0.04 | 0.01 |
| Roundabout | -0.43 | 0.65 | 0.05 | <0.001 | -0.10 | 0.90 | 0.03 | 0.00 |
| Slip road | 0.72 | 2.06 | 0.13 | <0.001 | ||||
| Lighting (Daylight as baseline) | ||||||||
| Darkness | 0.51 | 1.66 | 0.03 | <0.001 | 0.12 | 1.13 | 0.02 | <0.001 |
| Pavement (Dry as baseline) | ||||||||
| Wet/Frozen | 0.41 | 1.50 | 0.04 | <0.001 | 0.08 | 1.09 | 0.03 | <0.001 |
| Weather (Clear as baseline) | ||||||||
| Raining | -0.48 | 0.62 | 0.05 | <0.001 | -0.19 | 0.83 | 0.04 | <0.001 |
| Day of week (Weekday as baseline) | ||||||||
| Weekend | 0.43 | 1.53 | 0.03 | <0.001 | 0.15 | 1.16 | 0.02 | <0.001 |
| Number of bikes (1 as baseline) | ||||||||
| >1 | 0.61 | 1.83 | 0.10 | <0.001 | 0.77 | 2.17 | 0.08 | <0.001 |
| Bike 1st point of impact (No impact as baseline) | ||||||||
| Back | -0.55 | 0.57 | 0.05 | -0.32 | 0.73 | 0.04 | <0.001 | |
| Front | -0.35 | 0.71 | 0.04 | <0.001 | 0.06 | 1.07 | 0.03 | 0.05 |
| Nearside/Offside | -0.63 | 0.53 | 0.05 | <0.001 | -0.14 | 0.87 | 0.03 | <0.001 |
| Bike leaving carriageway (No as baseline) | ||||||||
| Nearside | 1.15 | 3.17 | 0.07 | <0.001 | 0.35 | 1.42 | 0.06 | <0.001 |
| Offside | 2.56 | 12.91 | 0.19 | <0.001 | 0.68 | 1.98 | 0.20 | <0.001 |
| Straight | 2.94 | 18.95 | 0.34 | <0.001 | ||||
| Vehicle 2 skidding and overturning (No as baseline) | ||||||||
| Yes | 1.03 | 2.79 | 0.11 | <0.001 | 0.47 | 1.60 | 0.10 | <0.001 |
| Vehicle 2 engine capacity (1501-2000 as baseline) | ||||||||
| ≤ 1000 | 0.22 | 1.25 | 0.05 | <0.001 | -0.08 | 0.92 | 0.04 | 0.04 |
| 1000-1500 | -0.26 | 0.77 | 0.03 | <0.001 | -0.09 | 0.92 | 0.02 | <0.001 |
| >3000 | 0.81 | 2.24 | 0.08 | <0.001 | 0.26 | 1.30 | 0.06 | <0.001 |
| Vehicle 2 age (≤ 15 as baseline) | ||||||||
| >15 | -0.42 | 0.65 | 0.06 | <0.001 | -0.49 | 0.61 | 0.01 | <0.001 |
| Variable | Fatal | Serious | ||||||
| β | OR | Std. Err. | p-value | β | OR | Std. Err. | p-value | |
| Driver 2 gender (Female as baseline) | ||||||||
| Male | -0.08 | 0.92 | 0.02 | <0.001 | ||||
| Driver 2 age (25-34 as baseline) | ||||||||
| ≤17 | 0.84 | 2.33 | 0.14 | <0.001 | 0.20 | 1.22 | 0.12 | 0.10 |
| 18-24 | 0.33 | 1.40 | 0.05 | <0.001 | 0.21 | 1.24 | 0.04 | <0.001 |
| 35-44 | <0.001 | |||||||
| 45-54 | -0.36 | 0.70 | 0.04 | <0.001 | ||||
| 55-64 (random variable for serious crashes) | 0.15 | 1.16 | 0.04 | <0.001 | -0.12 | 0.89 | 0.05 | 0.01 |
| St. dev. 55-64 | 0.51 | — | 0.19 | 0.01 | ||||
| 65-74 | -0.72 | 0.48 | 0.06 | <0.001 | ||||
| ≥75 | -0.19 | 0.83 | 0.07 | <0.001 | 0.26 | 1.30 | 0.05 | <0.001 |
| Cyclist IMD decile (Less deprived as baseline) | ||||||||
| More deprived | -0.11 | 0.89 | 0.02 | <0.001 | ||||
| Cyclist gender (Female as baseline) | ||||||||
| Male (random variable for serious and fatal crashes) | 0.37 | 1.44 | 0.02 | <0.001 | -0.11 | 0.90 | 0.03 | <0.001 |
| St. dev. Male | -0.97 | — | 0.03 | <0.001 | 1.56 | — | 0.06 | <0.001 |
| Cyclist age (25-34 as baseline) | ||||||||
| ≤17 | -0.40 | 0.67 | 0.04 | <0.001 | -0.10 | 0.91 | 0.03 | <0.001 |
| 18-24 | -0.11 | 0.90 | 0.04 | 0.01 | ||||
| 35-44 | 0.19 | 1.21 | 0.04 | <0.001 | 0.17 | 1.19 | 0.03 | <0.001 |
| 45-54 | 0.31 | 1.37 | 0.04 | <0.001 | 0.35 | 1.42 | 0.03 | <0.001 |
| 55-64 | 1.27 | 3.57 | 0.04 | <0.001 | 0.54 | 1.72 | 0.04 | <0.001 |
| 65-74 | 1.98 | 7.26 | 0.07 | <0.001 | 0.68 | 1.98 | 0.06 | <0.001 |
| ≥75 (random variable for fatal crashes) | 3.29 | 26.90 | 0.07 | <0.001 | 0.97 | 2.64 | 0.12 | <0.001 |
| St. dev. ≥75 | -0.66 | — | 0.10 | <0.001 | ||||
| Cyclist journey purpose (Commuting to from work as baseline) | ||||||||
| Journey as part of work | -0.51 | 0.60 | 0.06 | <0.001 | -0.06 | 0.94 | 0.03 | 0.08 |
| To/from school | -0.23 | 0.79 | 0.05 | <0.001 | ||||
| Interactions | ||||||||
| Int 1-4 (SL= 40, ≥50 -V2man = going ahead, overtaking) | 0.39 | 1.48 | 0.07 | <0.001 | ||||
| Inter 4-9 (V2man = going ahead, overtaking – JunDet= not at junction, crossroads, other junctions) | 0.80 | 2.22 | 0.03 | <0.001 | 0.20 | 1.23 | 0.02 | <0.001 |
| Inter 9-15 (JunDet= not at junction, crossroads, other junctions – V2FPI= front) | 0.44 | 1.55 | 0.03 | <0.001 | -0.08 | 0.92 | 0.02 | <0.001 |
| Inter 2-5 (SL=30, 20 – V2Type= truck, other) | 0.32 | 1.37 | 0.10 | <0.001 | -0.41 | 0.66 | 0.09 | <0.001 |
| Inter 5-11 (V2Type= truck, other – D2age=25-34, 35-44, 45-54, 55-64, 65-74) | 1.80 | 6.04 | 0.12 | <0.001 | 0.93 | 2.53 | 0.12 | <0.001 |
| Inter 11_17(D2age=25-34, 35-44, 45-54, 55-64, 65-74 - FRC= A, Motorway) |
0.40 | 1.49 | 0.03 | <0.001 | 0.06 | 1.06 | 0.02 | 0.01 |
The MLM shows a robust fit with a McFadden Pseudo R2 of 0.21. F-measures is reasonable for serious injuries (0.29) but less satisfactory for fatal crashes (0.06). G-mean reveals differences in classification performance, with the model exhibiting higher effectiveness for fatal crashes (0.80) compared to serious injuries (0.51) (Table 6).
| Severity level | F-measure | G-mean | McFadden R2 |
| Fatal | 0.06 | 0.80 | 0.21 |
| Serious injury | 0.29 | 0.51 | |
| Slight injury | 0.73 | 0.59 |
6. Discussion
The study findings confirm the significant function of vehicle speed, with higher speed limits increasing the probability of serious and fatal outcomes. These results align with previous research (Boufous et al., 2012; Isaksson-Hellman & Toreki, 2019; Kaplan et al., 2014; Montella et al., 2015; Z. Wang et al., 2021). Higher speeds are critical when the second vehicle is going ahead or overtaking (interaction 1-4). However, even at moderate speeds (20-30 mph), with specific conditions, such as crashes involving trucks, can increase fatality risk (interaction 2-5). To reduce these risks, speed management strategies and bike network improvement are needed, as showed by other researchers (Damsere-Derry & Bawa, 2018; Samerei et al., 2021; Tuckel, 2021). Furthermore, develop cycle paths and marked lanes, physically separating cyclists from other road users, can significantly improve cyclist safety. To accommodate human errors, it is recommended to implement “forgiving” sloped kerbs, given that studies show its superiority compared to right-angled kerbs (Janssen et al., 2018).
Within road-related variables, crashes occurred in rural areas, characterized by higher speed limits, significantly increase the likelihood of fatal or serious injury severity. Furthermore, roundabouts are associated with a lower risk of both fatal and serious crashes. Roundabouts achieve this result by forcing vehicles to reduce speed through deflection, as showed by previous studies (Gross et al., 2013; Montella, 2007, 2011; Rella Riccardi, Augeri, et al., 2022; Silvano & Linder, 2017). On the other hand, the interaction between the second vehicle’s manoeuvre (going ahead or overtaking) and specific junction type (crossroads or other junctions) highlights an increased risk of severe crashes in these scenarios (interaction 4-9). Additionally, crashes where the second vehicle’s first point of impact is the front, occurring in these same junction types, show a higher probability of being fatal (interaction 9-15). These findings suggest that improving intersection safety is needed. This is possible by implementing junction with clear cyclist priority, and improved road markings.
Beyond road-related factors, environmental conditions are drastically associated with cyclist crash severity. Particularly, lighting conditions is a critical factor since crashes occurring during nighttime are associated with an increase in probability of fatal and serious outcomes. The use of lighting systems with light-emitting diodes (LEDs), the enforcement of mandatory bike light installations, and the promotion of reflective clothing use can improve visibility during nighttime conditions and on unlit streets. Moreover, wet, or frozen pavements are identified as significant contributors resulting in an increased likelihood of cyclist fatal crashes. These observations are in line with the findings of previous research (Wahi et al., 2018; C. Wang et al., 2015). Improving road surface conditions is also necessary, particularly in wet or frozen conditions where skidding is more likely. Using permeable surfaces, such as permeable asphalt or concrete, which help absorb water into the ground and reduce the risk of skidding.
The analysis also highlights the impact of the second vehicle’s characteristics on crash severity. In particular, truck involvement is associated with increased fatality risks for cyclists, especially when the truck is driven by driver aged 25–74 (interaction 5-11). This interaction shows that driving experience is not always enough to avoid dangers when operating heavy vehicles. These manoeuvres often involve complex spatial dynamics, longer braking distances for trucks, and blind spots that may limit the truck driver capacity to detect cyclists. These results are in line with the findings of previous research (Chen & Shen, 2016; Damsere-Derry & Bawa, 2018; Joo et al., 2017; Kaplan et al., 2014; van Haperen et al., 2018). The progress and integration of safety systems in truck, particularly active safety systems, can improve road safety. Moreover, placing mirrors on signal posts eliminates blind spots for truck drivers, improving visibility and reducing crash risks.
On the other hand, regarding bike related factors, the bike leaving the carriageway offside is associated with more severe outcomes. This can be attributed to the increased cyclist exposure to collisions with the other motor vehicles or obstacles. To address this issue, effective strategies are needed to promote safe riding behaviours such as targeted road safety education and the development of safe infrastructure with appropriate and clear road markings and road signs.
As regards the cyclist characteristics, the model results indicate a correlation between cyclist crash severity and the ages of both the cyclist and the driver. Infact, as the cyclist age increases, there is a corresponding rise in the probability of serious or fatal outcomes. Conversely, an inverse relationship is observed for the age of the driver, with younger drivers associated with an increased likelihood of severe consequences. Moreover, the interaction between driver age and road class shows that crashes on A roads and motorways are more likely to result in severe outcomes when the driver is between 25 and 74 years old (interaction 11_17). These findings are in line with previous studies (Oikawa et al., 2019; Scholes et al., 2018; C. Wang et al., 2015). To address these critical factors, targeted interventions are needed, such as promoting awareness campaigns emphasizing safe cycling practices or driver education programs. Furthermore, advanced driver assistance systems in vehicles may reduce the crash risk.
7. Conclusions
The road crash statistics indicate that, despite the efforts made by the member states of the European Union and the United Nations to protect VRUs, coupled with significant scientific and engineering progress, the issue of cyclist crashes cannot be deemed resolved. Thus, especially now that a growing number of cities is promoting cycling as an economic, green, healthy, and efficient way of transport, the cycling safety deserves attention as well as in-depth research. To identify patterns associated with severe injuries and fatal crashes involving cyclists and improve cyclist safety, this research utilized a combination of tradition econometric model known as MLM, and emerging machine learning methodology, represented by the CT algorithm.
The study focused on the analysis of cyclist crash data spanning the period from 2016 to 2019 in Great Britain. The CT model served as an exploratory tool to detect patterns and potential interactions that might not have been hypothesized a priori, whereas the MLM was used to test all variables consistently, quantify global effects, and obtain statistical significance. Furthermore, the interactions derived from the CT analysis were incorporated into the MLM. Interestingly, all the interactions were statistically significant.
The CT model is explicitly used as a supporting tool to identify potential interactions, while conclusions are extracted from the MLM results. Based on the identified risk factors, a set of targeted safety countermeasures has been proposed to minimize cyclist crash severity and improve overall road safety.
In conclusion, this research not only shows the persistent and significant issue of cyclist crashes but also introduces a new perspective in their understanding and management. Thus, the study ensures that the factors influencing cyclist crash severity are tested in a statistically consistent manner within the MLM, using insights from the CT model to refine the regression analysis. Furthermore, these insights are translated into actionable countermeasures, offering a detailed plan aimed at mitigating cyclist crash severity and improving overall road safety.
CRediT contribution statement
Antonella Scarano: Conceptualization, Formal analysis, Methodology, Software, Writing—original draft, Writing—review & editing. Maria Rella Riccardi: Conceptualization, Methodology, Writing—review & editing. Filomena Mauriello: Conceptualization, Methodology, Writing—review & editing. Carmelo D’Agostino: Conceptualization, Writing—review & editing. Alfonso Montella: Conceptualization, Methodology, Supervision, Writing—review & editing.
Declaration of competing interest
The authors declare that they have no known competing financial interests or personal relationships that could have appeared to influence the work reported in this paper.
Declaration of generative AI use in writing
The authors declare that no generative AI was used in this work.
Acknowledgement
An earlier version of this work was presented as a poster at the 35th ICTCT Conference in Catania, Italy, on 26–27 October 2023, titled “Challenges and Actual Opportunities Offered by New Technologies to Improve Traffic Safety.” It was awarded the Best Presentation Award.
Ethics statement
Crash data used in this research were collected by the Department for Transport (GOV.UK) and were retrieved from the STATS19 dataset (https://www.gov.uk/transport-statistics-notes-and-guidance-road-accident-and-safety). Thus, this research was exempted from requiring an ethical approval.
Funding
No external funding was used in this research.
Editorial information
One of the authors, Carmelo D’Agostino, is a member of the editorial board of the Traffic Safety Research journal. To minimize the risk for conflict of interest during the review process, an external guest editor was called to handle this paper.
Guest editor: Ragnhild Davidse, SWOV Institute for Road Safety Research, the Netherlands
Reviewer: Paul Schepers, Ministry of Infrastructure and Water Management, the Netherlands
Appendix A
| Variable | Fatal | Serious | Slight | Total | ||||
| N | % | N | % | N | % | N | % | |
| Crash severity | 429 | 0.59 | 14 890 | 20.58 | 57 044 | 78.83 | 72 363 | 100.00 |
| First road class | ||||||||
| A | 213 | 0.29 | 5 865 | 8.10 | 23 298 | 32.20 | 29 376 | 40.60 |
| B | 63 | 0.09 | 1 972 | 2.73 | 6 787 | 9.38 | 8 822 | 12.19 |
| C | 29 | 0.04 | 930 | 1.29 | 3 889 | 5.37 | 4 848 | 6.70 |
| Motorway | 1 | 0.00 | 1 | 0.00 | 3 | 0.00 | 5 | 0.01 |
| Missing | 123 | 0.17 | 6 122 | 8.46 | 23 067 | 31.88 | 29 312 | 40.51 |
| Road type | ||||||||
| Single carriageway | 341 | 0.47 | 11 694 | 16.16 | 43 581 | 60.23 | 55 616 | 76.86 |
| Dual carriageway | 59 | 0.08 | 1 154 | 1.59 | 4 082 | 5.64 | 5 295 | 7.32 |
| One way street | 8 | 0.01 | 378 | 0.52 | 1 784 | 2.47 | 2 170 | 3.00 |
| Roundabout | 16 | 0.02 | 1 383 | 1.91 | 5 920 | 8.18 | 7 319 | 10.11 |
| Slip road | 4 | 0.01 | 83 | 0.11 | 353 | 0.49 | 440 | 0.61 |
| Missing | 1 | 0.00 | 198 | 0.27 | 1 324 | 1.83 | 1 523 | 2.10 |
| Speed limit (mph) | ||||||||
| 20 | 24 | 0.03 | 1 600 | 2.21 | 7 830 | 10.82 | 9 454 | 13.06 |
| 30 | 187 | 0.26 | 10 379 | 14.34 | 42 868 | 59.24 | 53 434 | 73.84 |
| 40 | 46 | 0.06 | 1 028 | 1.42 | 3 076 | 4.25 | 4 150 | 5.73 |
| ≥50 | 172 | 0.24 | 1 880 | 2.60 | 3 254 | 4.50 | 5 306 | 7.33 |
| Missing | 0 | 0.00 | 3 | 0.00 | 16 | 0.02 | 19 | 0.03 |
| Junction detail | ||||||||
| Not at junction | 240 | 0.33 | 4 858 | 6.71 | 15 212 | 21.02 | 20 310 | 28.07 |
| Crossroads | 144 | 0.20 | 7 007 | 9.68 | 28 820 | 39.83 | 35 971 | 49.71 |
| Other junctions | 22 | 0.03 | 1 073 | 1.48 | 4 629 | 6.40 | 5 724 | 7.91 |
| Roundabout | 23 | 0.03 | 1 886 | 2.61 | 7 896 | 10.91 | 9 805 | 13.55 |
| Missing | 0 | 0.00 | 66 | 0.09 | 487 | 0.67 | 553 | 0.76 |
| Junction control | ||||||||
| Not at junction or within 20 metres | 240 | 0.33 | 4 858 | 6.71 | 15 212 | 21.02 | 20310 | 28.07 |
| Traffic lights | 57 | 0.08 | 1 479 | 2.04 | 6374 | 8.81 | 7910 | 10.93 |
| Give way/Stop | 132 | 0.18 | 8 310 | 11.48 | 33310 | 46.03 | 41752 | 57.70 |
| Missing | 0 | 0.00 | 243 | 0.34 | 2148 | 2.97 | 2391 | 3.30 |
| Second road class | ||||||||
| A | 33 | 0.05 | 1 424 | 1.97 | 6 354 | 8.78 | 7 811 | 10.79 |
| B | 13 | 0.02 | 681 | 0.94 | 2 676 | 3.70 | 3 370 | 4.66 |
| C | 12 | 0.02 | 581 | 0.80 | 2 741 | 3.79 | 3 334 | 4.61 |
| Motorway | 1 | 0.00 | 21 | 0.03 | 56 | 0.08 | 78 | 0.11 |
| Missing | 370 | 0.51 | 12 183 | 16.84 | 45 217 | 62.49 | 57 770 | 79.83 |
| Pedestrian crossing physical facilities | ||||||||
| No physical crossing facilities within 50 meters | 335 | 0.46 | 11 419 | 15.78 | 40 788 | 56.37 | 52 542 | 72.61 |
| Central refuge | 17 | 0.02 | 458 | 0.63 | 1 896 | 2.62 | 2 371 | 3.28 |
| Pedestrian phase at traffic signal junction | 45 | 0.06 | 1 169 | 1.62 | 5 517 | 7.62 | 6 731 | 9.30 |
| Pelican, puffin, toucan or similar non junction pedestrian light Crossing | 25 | 0.03 | 1 006 | 1.39 | 3 817 | 5.27 | 4 848 | 6.70 |
| Zebra | 6 | 0.01 | 579 | 0.80 | 2 921 | 4.04 | 3 506 | 4.85 |
| Missing | 1 | 0.00 | 259 | 0.36 | 2 105 | 2.91 | 2 365 | 3.27 |
| Variable | Fatal | Serious | Slight | Total | |||||
| N | % | N | % | N | % | N | % | ||
| Area | |||||||||
| Urban | 200 | 0.28 | 1 1106 | 15.35 | 48 276 | 66.71 | 59 582 | 82.34 | |
| Rural | 229 | 0.32 | 3 784 | 5.23 | 8 768 | 12.12 | 12 781 | 17.66 | |
| Day of week | |||||||||
| Weekday | 306 | 0.42 | 11 489 | 15.88 | 46 367 | 64.08 | 58 162 | 80.38 | |
| Weekend | 123 | 0.17 | 3 401 | 4.70 | 10 677 | 14.75 | 14 201 | 19.62 | |
| Lighting | |||||||||
| Daylight | 317 | 0.44 | 11 647 | 16.10 | 4 4798 | 61.91 | 56 762 | 78.44 | |
| Darkness | 112 | 0.15 | 3 243 | 4.48 | 12 246 | 16.92 | 15 601 | 21.56 | |
| Weather | |||||||||
| Clear | 377 | 0.52 | 13 006 | 17.97 | 48 430 | 66.93 | 61 813 | 85.42 | |
| Raining | 33 | 0.05 | 1 158 | 1.60 | 5 022 | 6.94 | 6 213 | 8.59 | |
| Other | 9 | 0.01 | 272 | 0.38 | 1 254 | 1.73 | 1 535 | 2.12 | |
| Missing | 10 | 0.01 | 454 | 0.63 | 2 338 | 3.23 | 2 802 | 3.87 | |
| Pavement | |||||||||
| Dry | 334 | 0.46 | 11 923 | 16.48 | 45 387 | 62.72 | 57 644 | 79.66 | |
| Wet/frozen | 94 | 0.13 | 2 827 | 3.91 | 10 730 | 14.83 | 13 651 | 18.86 | |
| Missing | 1 | 0.00 | 140 | 0.19 | 927 | 1.28 | 1 068 | 1.48 | |
| Number of bikes | |||||||||
| 1 | 413 | 0.57 | 14 479 | 20.01 | 56 420 | 77.97 | 71 312 | 98.55 | |
| >1 | 16 | 0.02 | 411 | 0.57 | 624 | 0.86 | 1 051 | 1.45 | |
| Bike skidding and overturning | |||||||||
| No | 357 | 0.49 | 12 599 | 17.41 | 48 250 | 66.68 | 61 206 | 84.58 | |
| Yes | 71 | 0.10 | 1 847 | 2.55 | 4 669 | 6.45 | 6 587 | 9.10 | |
| Missing | 1 | 0.00 | 444 | 0.61 | 4 125 | 5.70 | 4 570 | 6.32 | |
| Bike leaving carriageway* | |||||||||
| No | 343 | 0.47 | 13 711 | 18.95 | 51 551 | 71.24 | 65 605 | 90.66 | |
| Nearside | 63 | 0.09 | 622 | 0.86 | 1 304 | 1.80 | 1 989 | 2.75 | |
| Offside | 19 | 0.03 | 117 | 0.16 | 171 | 0.24 | 307 | 0.42 | |
| Missing | 2 | 0.00 | 426 | 0.59 | 3 961 | 5.47 | 4 389 | 6.07 | |
| Bike hit off carriageway | |||||||||
| None | 400 | 0.55 | 14 284 | 19.74 | 52 898 | 73.10 | 67 582 | 93.39 | |
| Barrier/Pole/Tree/Wall | 8 | 0.01 | 120 | 0.17 | 152 | 0.21 | 280 | 0.39 | |
| Other | 21 | 0.03 | 102 | 0.14 | 204 | 0.28 | 327 | 0.45 | |
| Missing | 0 | 0.00 | 384 | 0.53 | 3 790 | 5.24 | 4 174 | 5.77 | |
| Bike 1st point of Impact | |||||||||
| No impact | 42 | 0.06 | 1 121 | 1.55 | 2 798 | 3.87 | 3 961 | 5.47 | |
| Back | 105 | 0.15 | 1 457 | 2.01 | 6 449 | 8.91 | 8 011 | 11.07 | |
| Front | 157 | 0.22 | 7 724 | 10.67 | 27 800 | 38.42 | 35 681 | 49.31 | |
| Nearside/Offside | 124 | 0.17 | 4 263 | 5.89 | 17 303 | 23.91 | 21 690 | 29.97 | |
| Missing | 1 | 0.00 | 325 | 0.45 | 2 694 | 3.72 | 3 020 | 4.17 | |
| Bike object hit in carriageway | |||||||||
| None | 404 | 0.56 | 13 671 | 18.89 | 51 086 | 70.60 | 65 161 | 90.05 | |
| Kerb | 14 | 0.02 | 200 | 0.28 | 423 | 0.58 | 637 | 0.88 | |
| Parked vehicle | 6 | 0.01 | 461 | 0.64 | 1 290 | 1.78 | 1 757 | 2.43 | |
| Other | 3 | 0.00 | 120 | 0.17 | 161 | 0.22 | 284 | 0.39 | |
| Missing | 2 | 0.00 | 438 | 0.61 | 4 084 | 5.64 | 4 524 | 6.25 | |
| Bike manoeuvre | |||||||||
| Going ahead | 362 | 0.50 | 11 753 | 16.24 | 42 128 | 58.22 | 54 243 | 74.96 | |
| Moving off | 9 | 0.01 | 360 | 0.50 | 1 696 | 2.34 | 2 065 | 2.85 | |
| Overtaking | 7 | 0.01 | 633 | 0.87 | 2 462 | 3.40 | 3 102 | 4.29 | |
| Turning left/right/U/Reversing | 37 | 0.05 | 1 100 | 1.52 | 4 011 | 5.54 | 5 148 | 7.11 | |
| Other | 13 | 0.02 | 635 | 0.88 | 2 947 | 4.07 | 3 595 | 4.97 | |
| Missing | 1 | 0.00 | 409 | 0.57 | 3 800 | 5.25 | 4 210 | 5.82 | |
| Variable | Fatal | Serious | Slight | Total | ||||
| N | % | N | % | N | % | N | % | |
| Vehicle 2 skidding and overturning | ||||||||
| No | 336 | 0.46 | 12 638 | 17.46 | 49 920 | 68.99 | 62 894 | 86.91 |
| Yes | 21 | 0.03 | 241 | 0.33 | 520 | 0.72 | 782 | 1.08 |
| na | 71 | 0.10 | 1 631 | 2.25 | 2 850 | 3.94 | 4 552 | 6.29 |
| Missing | 1 | 0.00 | 380 | 0.53 | 3 754 | 5.19 | 4 135 | 5.71 |
| Vehicle 2 leaving carriageway | ||||||||
| No | 330 | 0.46 | 12 665 | 17.50 | 50 066 | 69.19 | 63 061 | 87.15 |
| Nearside | 12 | 0.02 | 150 | 0.21 | 388 | 0.54 | 550 | 0.76 |
| Offside | 15 | 0.02 | 80 | 0.11 | 152 | 0.21 | 247 | 0.34 |
| na | 71 | 0.10 | 1 631 | 2.25 | 2 850 | 3.94 | 4 552 | 6.29 |
| Missing | 1 | 0.00 | 364 | 0.50 | 3 588 | 4.96 | 3 953 | 5.46 |
| Vehicle 2 hit off carriageway | ||||||||
| None | 346 | 0.48 | 12 849 | 17.76 | 50 652 | 70.00 | 63 847 | 88.23 |
| Barrier/Pole/Tree/Wall | 9 | 0.01 | 54 | 0.07 | 83 | 0.11 | 146 | 0.20 |
| Other | 3 | 0.00 | 35 | 0.05 | 59 | 0.08 | 97 | 0.13 |
| na | 71 | 0.10 | 1 631 | 2.25 | 2 850 | 3.94 | 4 552 | 6.29 |
| Missing | 0 | 0.00 | 321 | 0.44 | 3 400 | 4.70 | 3 721 | 5.14 |
| Vehicle 2 1st point of impact | ||||||||
| No impact | 10 | 0.01 | 860 | 1.19 | 2 680 | 3.70 | 3 550 | 4.91 |
| Back | 13 | 0.02 | 807 | 1.12 | 3 202 | 4.42 | 4 022 | 5.56 |
| Front | 246 | 0.34 | 6 251 | 8.64 | 25 419 | 35.13 | 31 916 | 44.11 |
| Nearside/Offside | 89 | 0.12 | 5 087 | 7.03 | 20 569 | 28.42 | 25 745 | 35.58 |
| na | 71 | 0.10 | 1 631 | 2.25 | 2 850 | 3.94 | 4 552 | 6.29 |
| Missing | 0 | 0.00 | 254 | 0.35 | 2 324 | 3.21 | 2 578 | 3.56 |
| Vehicle 2 engine capacity | ||||||||
| ≤1000 | 26 | 0.04 | 749 | 1.04 | 3 024 | 4.18 | 3 799 | 5.25 |
| 1001-1500 | 54 | 0.07 | 2 809 | 3.88 | 11 413 | 15.77 | 14 276 | 19.73 |
| 1501-2000 | 106 | 0.15 | 4 428 | 6.12 | 18 572 | 25.67 | 23 106 | 31.93 |
| 2001-3000 | 38 | 0.05 | 1 359 | 1.88 | 5 301 | 7.33 | 6 698 | 9.26 |
| >3000 | 78 | 0.11 | 520 | 0.72 | 1 439 | 1.99 | 2 037 | 2.81 |
| Missing | 50 | 0.07 | 3 165 | 4.37 | 14 140 | 19.54 | 17 355 | 23.98 |
| na | 77 | 0.11 | 1 860 | 2.57 | 3 155 | 4.36 | 5 092 | 7.04 |
| Vehicle 2 propulsion code | ||||||||
| Petrol | 113 | 0.16 | 4 979 | 6.88 | 20 294 | 28.04 | 25 386 | 35.08 |
| Heavy oil | 189 | 0.26 | 4 626 | 6.39 | 18 015 | 24.90 | 22 830 | 31.55 |
| Hybrid electric | 2 | 0.00 | 267 | 0.37 | 1 409 | 1.95 | 1 678 | 2.32 |
| Other | 1 | 0.00 | 38 | 0.05 | 174 | 0.24 | 213 | 0.29 |
| na | 77 | 0.11 | 1 860 | 2.57 | 3 155 | 4.36 | 5 092 | 7.04 |
| Missing | 47 | 0.06 | 3 120 | 4.31 | 13 997 | 19.34 | 17 164 | 23.72 |
| Vehicle 2 age | ||||||||
| ≤15 | 281 | 0.39 | 9 132 | 12.62 | 36 775 | 50.82 | 46 188 | 63.83 |
| >15 | 19 | 0.03 | 652 | 0.90 | 2 412 | 3.33 | 3 083 | 4.26 |
| Missing | 47 | 0.06 | 3 077 | 4.25 | 13 725 | 18.97 | 16 849 | 23.28 |
| na | 82 | 0.11 | 2 029 | 2.80 | 4 132 | 5.71 | 6 243 | 8.63 |
| Vehicle 2 type | ||||||||
| Car | 242 | 0.33 | 11 903 | 16.45 | 50 346 | 69.57 | 62 491 | 86.36 |
| Two-wheelers | 22 | 0.03 | 512 | 0.71 | 1 346 | 1.86 | 1 880 | 2.60 |
| Truck | 83 | 0.11 | 656 | 0.91 | 1 947 | 2.69 | 2 686 | 3.71 |
| Other | 11 | 0.02 | 129 | 0.18 | 400 | 0.55 | 540 | 0.75 |
| na | 71 | 0.10 | 1 631 | 2.25 | 2 850 | 3.94 | 4 552 | 6.29 |
| Missing | 0 | 0.00 | 59 | 0.08 | 155 | 0.21 | 214 | 0.30 |
| Vehicle 2 towing and articulation | ||||||||
| No | 322 | 0.44 | 12 674 | 17.51 | 52 343 | 72.33 | 65 339 | 90.29 |
| Articulated vehicle | 20 | 0.03 | 90 | 0.12 | 121 | 0.17 | 231 | 0.32 |
| Other | 9 | 0.01 | 115 | 0.16 | 310 | 0.43 | 434 | 0.60 |
| na | 77 | 0.11 | 1 860 | 2.57 | 3 155 | 4.36 | 5 092 | 7.04 |
| Missing | 1 | 0.00 | 151 | 0.21 | 1 115 | 1.54 | 1 267 | 1.75 |
| Vehicle 2 manoeuvre | ||||||||
| Going ahead | 260 | 0.36 | 5 099 | 7.05 | 17 646 | 24.39 | 23 005 | 31.79 |
| Moving off | 9 | 0.01 | 1 078 | 1.49 | 5 254 | 7.26 | 6 341 | 8.76 |
| Overtaking | 30 | 0.04 | 764 | 1.06 | 2 857 | 3.95 | 3 651 | 5.05 |
| Turning left/right/U/Reversing | 37 | 0.05 | 4 235 | 5.85 | 18 099 | 25.01 | 22 371 | 30.91 |
| Other | 21 | 0.03 | 1 710 | 2.36 | 6 670 | 9.22 | 8 401 | 11.61 |
| na | 71 | 0.10 | 1 631 | 2.25 | 2 850 | 3.94 | 4 552 | 6.29 |
| Missing | 1 | 0.00 | 373 | 0.52 | 3 668 | 5.07 | 4 042 | 5.59 |
| Vehicle 2 object hit in carriageway | ||||||||
| None | 346 | 0.48 | 127 66 | 17.64 | 50 082 | 69.21 | 63 194 | 87.33 |
| Kerb | 8 | 0.01 | 42 | 0.06 | 112 | 0.15 | 162 | 0.22 |
| Parked vehicle | 1 | 0.00 | 361 | 0.50 | 3 723 | 5.14 | 4 085 | 5.65 |
| Other | 71 | 0.10 | 1 631 | 2.25 | 2 850 | 3.94 | 4 552 | 6.29 |
| na | 2 | 0.00 | 43 | 0.06 | 143 | 0.20 | 188 | 0.26 |
| Missing | 1 | 0.00 | 47 | 0.06 | 134 | 0.19 | 182 | 0.25 |
| Variable | Fatal | Serious | Slight | Total | ||||
| N | % | N | % | N | % | N | % | |
| Cyclist journey purpose | ||||||||
| Commuting to/from work | 55 | 0.08 | 2 724 | 3.76 | 11 340 | 15.67 | 14 119 | 19.51 |
| Journey as part of work | 12 | 0.02 | 793 | 1.10 | 3 351 | 4.63 | 4 156 | 5.74 |
| To/from school | 6 | 0.01 | 327 | 0.45 | 2 047 | 2.83 | 2 380 | 3.29 |
| Other | 45 | 0.06 | 1 647 | 2.28 | 4 204 | 5.81 | 5 896 | 8.15 |
| Missing | 311 | 0.43 | 9 399 | 12.99 | 36 102 | 49.89 | 45 812 | 63.31 |
| Cyclist gender | ||||||||
| Female | 58 | 0.08 | 2 559 | 3.54 | 11 120 | 15.37 | 13 737 | 18.98 |
| Male | 369 | 0.51 | 12 201 | 16.86 | 45 433 | 62.78 | 58 003 | 80.16 |
| Missing | 2 | 0.00 | 130 | 0.18 | 491 | 0.68 | 623 | 0.86 |
| Cyclist age | ||||||||
| ≤17 | 36 | 0.05 | 1 710 | 2.36 | 8 331 | 11.51 | 10 077 | 13.93 |
| 18-24 | 28 | 0.04 | 1 432 | 1.98 | 6 825 | 9.43 | 8 285 | 11.45 |
| 25-34 | 52 | 0.07 | 2 651 | 3.66 | 13 004 | 17.97 | 15 707 | 21.71 |
| 35-44 | 51 | 0.07 | 2 616 | 3.62 | 10 050 | 13.89 | 12 717 | 17.57 |
| 45-54 | 72 | 0.10 | 2 897 | 4.00 | 8 788 | 12.14 | 11 757 | 16.25 |
| 55-64 | 74 | 0.10 | 1 679 | 2.32 | 4 228 | 5.84 | 5 981 | 8.27 |
| 65-74 | 55 | 0.08 | 675 | 0.93 | 1 379 | 1.91 | 2 109 | 2.91 |
| ≥75 | 36 | 0.05 | 278 | 0.38 | 462 | 0.64 | 776 | 1.07 |
| Missing | 25 | 0.03 | 952 | 1.32 | 3 977 | 5.50 | 4 954 | 6.85 |
| Cyclist IMD | ||||||||
| Less deprived | 198 | 0.27 | 6 291 | 8.69 | 21 527 | 29.75 | 28 016 | 38.72 |
| More deprived | 154 | 0.21 | 6 637 | 9.17 | 28 020 | 38.72 | 34 811 | 48.11 |
| Missing | 77 | 0.11 | 1 962 | 2.71 | 7 497 | 10.36 | 9 536 | 13.18 |
| Cyclist home area | ||||||||
| Urban | 247 | 0.34 | 11 039 | 15.26 | 44 616 | 61.66 | 55 902 | 77.25 |
| Rural | 69 | 0.10 | 1 065 | 1.47 | 2 585 | 3.57 | 3 719 | 5.14 |
| Small town | 36 | 0.05 | 825 | 1.14 | 2 348 | 3.24 | 3 209 | 4.43 |
| Missing | 77 | 0.11 | 1 961 | 2.71 | 7 495 | 10.36 | 9 533 | 13.17 |
| Driver 2 journey purpose | ||||||||
| Commuting to-from work/school | 27 | 0.04 | 1 653 | 2.28 | 5 719 | 7.90 | 7 399 | 10.22 |
| Journey as part of work | 122 | 0.17 | 2 193 | 3.03 | 7 676 | 10.61 | 9 991 | 13.81 |
| Other | 37 | 0.05 | 1 254 | 1.73 | 3 417 | 4.72 | 4 708 | 6.51 |
| na | 71 | 0.10 | 1 631 | 2.25 | 2 850 | 3.94 | 4 552 | 6.29 |
| Missing | 172 | 0.24 | 8 159 | 11.28 | 37 382 | 51.66 | 45 713 | 63.17 |
| Driver 2 gender | ||||||||
| Female | 55 | 0.08 | 3 452 | 4.77 | 14 031 | 19.39 | 17 538 | 24.24 |
| Male | 287 | 0.40 | 7 766 | 10.73 | 29 765 | 41.13 | 37 818 | 52.26 |
| na | 71 | 0.10 | 1 631 | 2.25 | 2 850 | 3.94 | 4 552 | 6.29 |
| Missing | 16 | 0.02 | 2 041 | 2.82 | 10 398 | 14.37 | 12 455 | 17.21 |
| Driver 2 age | ||||||||
| ≤17 | 3 | 0.00 | 94 | 0.13 | 315 | 0.44 | 412 | 0.57 |
| 18-24 | 45 | 0.06 | 1 160 | 1.60 | 3 902 | 5.39 | 5 107 | 7.06 |
| 25-34 | 75 | 0.10 | 2 330 | 3.22 | 8 852 | 12.23 | 11 257 | 15.56 |
| 35-44 | 66 | 0.09 | 2 004 | 2.77 | 8 077 | 11.16 | 10 147 | 14.02 |
| 45-54 | 61 | 0.08 | 2 118 | 2.93 | 8 075 | 11.16 | 10 254 | 14.17 |
| 55-64 | 57 | 0.08 | 1 489 | 2.06 | 5 279 | 7.30 | 6 825 | 9.43 |
| 65-74 | 16 | 0.02 | 779 | 1.08 | 2 837 | 3.92 | 3 632 | 5.02 |
| ≥75 | 13 | 0.02 | 616 | 0.85 | 1 826 | 2.52 | 2 455 | 3.39 |
| na | 76 | 0.11 | 1 817 | 2.51 | 3 850 | 5.32 | 5 743 | 7.94 |
| Missing | 17 | 0.02 | 2 483 | 3.43 | 14 031 | 19.39 | 16 531 | 22.84 |
| Driver 2 IMD | ||||||||
| Less deprived | 135 | 0.19 | 4 667 | 6.45 | 16 488 | 22.79 | 21 290 | 29.42 |
| More deprived | 160 | 0.22 | 4 926 | 6.81 | 19 578 | 27.06 | 24 664 | 34.08 |
| na | 71 | 0.10 | 1 631 | 2.25 | 2 850 | 3.94 | 4 552 | 6.29 |
| Missing | 63 | 0.09 | 3 666 | 5.07 | 18 128 | 25.05 | 21 857 | 30.20 |
| Driver 2 home area | ||||||||
| Urban | 203 | 0.28 | 7 785 | 10.76 | 30 728 | 42.46 | 38 716 | 53.50 |
| Rural | 57 | 0.08 | 1 013 | 1.40 | 3 007 | 4.16 | 4 077 | 5.63 |
| Small town | 35 | 0.05 | 796 | 1.10 | 2 333 | 3.22 | 3 164 | 4.37 |
| na | 71 | 0.10 | 1 631 | 2.25 | 2 850 | 3.94 | 4 552 | 6.29 |
| Missing | 63 | 0.09 | 3 665 | 5.06 | 18 126 | 25.05 | 21 854 | 30.20 |