Examining the effects of texting, web surfing, and navigating apps on urban driving behavior and crash risk
Abstract
This research aims to assess the impact of using texting, web surfing and navigating applications on driving behavior and road safety in urban environments. The study involved collecting driving data from 36 young adult drivers through a driving simulator experiment, supplemented by a survey to gather participant characteristics and driving profiles. The driving experiment included periods of distraction-free driving and intervals when drivers used Facebook (scrolling through the feed), Google Maps (searching for specific locations), and Facebook Messenger (texting). Data analysis utilized linear and binary logistic mixed models to explore the effects of texting and web surfing on speed and its deviation, headway distance and its deviation, and crash risk. Results indicate that using texting, web surfing and navigating applications while driving elevate crash risk by 10% and decrease speed, speed deviation, headway, and headway deviation by 9%, 23%, 6%, and 18%, respectively. These findings underscore the crucial role of specific smartphone applications in shaping driving behavior and emphasize the need for targeted interventions to mitigate the associated risks in urban driving scenarios.
1. Introduction
Road safety remains a critical concern globally, with distracted driving being a significant contributor to crashes. Among young drivers, cognitive failure during distraction plays a critical role (Niranjan et al., 2022). The most common distraction types in at-fault crashes include mobile phone use, in-vehicle objects, external views, and in-vehicle information systems (Liang & Yang, 2022). Researchers continue to investigate these factors to develop targeted interventions aimed at reducing distraction-related crashes.
Distracted driving, particularly involving mobile phone use, significantly increases crash risk. Drivers using mobile phones while driving are approximately four times more likely to be involved in a crash than those who do not use their phones (World Health Organization, 2021). In the United States, mobile phone use accounted for 13% of fatal distraction-affected crashes in 2019 (National Center for Statistics and Analysis, 2019), and in 2020, approximately 8% of drivers were observed using their phones, either handheld or hands-free, on a typical day (National Center for Statistics and Analysis, 2021). Driver distraction is a multidimensional phenomenon, and as such, a single driving performance measure cannot fully capture all its impacts (Papantoniou et al., 2017).
1.1. Texting and social media browsing while driving
The increasing frequency of distracted driving, especially due to smartphone usage, poses a significant risk among young adult drivers. Common distracting behaviors include talking with passengers, programming music, eating or drinking, and using navigation. Extraversion consistently predicts engagement in distracted driving, regardless of varying perceptions of risk (Braitman & Braitman, 2017). Cellphone-involved crashes show temporal instability in injury severity factors, with stable factors like not wearing seatbelts and vehicle overturns increasing severity, while risky behaviors (e.g., aggressive driving, substance use, speeding, or fatigue) combined with cellphone use significantly amplify injury risks (Wu et al., 2022). Studies show that smartphone use during driving is increasing globally, with significant impacts observed in countries such as the United States, New Zealand, Australia, and across Europe (Huemer et al., 2018). Among the various smartphone activities, texting is more detrimental to driving performance than browsing social media (Hashash et al., 2019). For instance, Dumitru et al. (2018) reported deteriorated driving performance when drivers engaged in social media browsing, while Oviedo-Trespalacios et al. (2017) found that approximately 70% of Australian drivers experienced increased crash risk when texting or browsing during driving. Furthermore, heavy smartphone users tend to maintain high phone usage even under increased traffic demands, with messaging applications posing the greatest risk (Kujala & Mäkelä, 2018).
Texting while driving notably reduces speed, likely due to distraction (Morgenstern, Schott, et al., 2020; Yannis et al., 2014). It also decreases the standard deviations of speed, headway, and lane offset (Wang et al., 2020). However, some studies indicate that texting increases lane deviations compared to non-distracted driving (Rumschlag et al., 2015; Stavrinos et al., 2013). Additionally, distracted driving is linked to longer reaction times, diminished hazard perception, poorer vehicle control, and elevated crash risk (Choudhary & Velaga, 2017; Zangi et al., 2022). Voice messaging, though less harmful than texting, also negatively affects driving performance (Monzer et al., 2022).
Specific smartphone applications further affect distracted driving impacts. Hashash et al. (2019) identified that Facebook and Facebook Messenger significantly increase reaction times. While some findings suggest that distracted driving via Facebook posting or texting results in minimal changes to speed and lane deviations, other studies, such as Dumitru et al. (2018), report increased lane deviations when posting on Facebook. Navigation apps like Google Maps, particularly those using touch interfaces, also lead to elevated speeds and lane deviations compared to non-distracted driving (Dopart et al., 2013; Munger et al., 2014). Similarly, WhatsApp use during driving has been shown to heighten crash risk across various age groups (Ortiz et al., 2018).
1.2. Distracted driving on urban roads
Distraction-related crashes are more likely to occur on roadway segments with high exposure, uneven traffic flow, or medium truck volumes, underscoring the importance of phone-use information in understanding and mitigating these incidents (Ma et al., 2021). Furthermore, driver inattention-related crash frequencies are significantly influenced by the built environment and roadway characteristics. For instance, commercial areas, non-freeways, multiple lanes, and traffic signals tend to increase crash risks, whereas features such as state-secondary routes, higher speed limits, medians, and specific road segment designs can help reduce these crashes (Wu et al., 2021).
Focusing on the urban environment, distractions among drivers are influenced by several factors. Firstly, urban areas typically have higher traffic volumes, leading to more frequent stops and starts. This environment provides drivers with more opportunities to engage with their mobile devices during periods of low vehicle movement, such as at traffic lights or in heavy congestion. Naturalistic driving studies have highlighted that during peak hours, the use of mobile phones increases significantly. This trend is attributed to the higher frequency of incoming calls and messages, which drivers often feel compelled to respond to promptly (Papadimitriou et al., 2019). Consequently, urban drivers may be a social expectation to remain connected, especially during work commutes, leading to higher mobile phone usage while driving. Additionally, the prevalence of mobile phone use is heightened in urban roads due to frequent stops at traffic lights and congested traffic conditions, providing drivers with opportunities to engage with their devices (Christoph et al., 2019). This finding is consistent with a naturalistic driving study by Morgenstern et al. (2020), which showed that drivers make at least one secondary task during almost half of the red-light period. Navigating through dense traffic and numerous intersections increases the cognitive load on drivers. To manage this stress, some drivers may resort to checking their phones for information or entertainment as a form of cognitive break, albeit unsafe.
Regarding the impacts of mobile phone use in urban environments, empirical studies underscore that distracted driving poses a greater risk in urban environments compared to rural roads and highways. Research by Chen and Lym (2021) indicates a higher incidence of crashes attributable to distracted driving in urban areas, where the density of traffic and intersections contributes to heightened collision risks. Observational studies, such as that conducted by Prat et al. (2015), further affirm that distracted drivers in urban settings exhibit increased vulnerability to accidents compared to their focused counterparts. Moreover, reaction times are particularly affected by reading and writing messages when driving on urban roads. Yannis et al. (2014) found that these activities significantly impair drivers’ ability to respond promptly to unexpected events, further exacerbating the risk of accidents in these environments.
1.3. Present research
This study aims to contribute to existing research on smartphone application use while driving by analyzing the influence of smartphone texting, web surfing and navigating on driving behavior and road safety in urban environments. Unlike previous studies that have broadly examined mobile phone use, the present research uniquely investigates the impact of specific applications including Facebook, Google Maps, and Facebook Messenger that have not been extensively evaluated in prior research. While distracted driving, particularly texting via mobile phones, has been extensively studied, some research has explored the impact of specific smartphone applications, including Facebook and Facebook Messenger (Dumitru et al., 2018; Hashash et al., 2019), WhatsApp (Ortiz et al., 2018), and Google Maps (Dopart et al., 2013; Munger et al., 2014). However, critical aspects such as the influence of age and sex, and specific driving conditions, remain insufficiently explored. Many studies have overlooked driver demographics and driving conditions (e.g., traffic volume and lighting conditions), potentially normalizing the effects of smartphone distraction and consequently underestimating its impact. By examining these factors, this study aims to provide a comprehensive analysis of multiple driving performance measures to capture the diverse impacts of these applications on driving behavior and crash risk, particularly among two age groups and various influencing factors.
This study employed a systematic approach to investigate various aspects of distracted driving behaviors and crash risks associated with different smartphone activities. Distraction types, including texting, web surfing, and navigating, were manipulated to discern their distinct impacts on driving behaviors. Concurrently, traffic conditions were varied to simulate diverse real-world settings, encompassing different traffic volumes and day/night driving scenarios, to evaluate their interactions with smartphone distraction. Participant characteristics such as age, sex, and personality traits related to enjoying driving and change in driving behavior while using a mobile phone were also considered to explore potential moderating effects on distracted driving behaviors. The study aimed to provide empirical insights on how specific smartphone activities affect driving performance and crash risk in urban settings. Despite its exploratory nature, the findings offer insights into the nuanced effects of smartphone distraction. These insights can inform future hypothesis-driven research focusing on more targeted experimental designs. Overall, this study contributes to addressing important questions regarding smartphone distraction and driving safety, providing a foundational understanding of the complex relations involved.
2. Methodology
2.1. Experimental procedure
To achieve the objectives of this study, a driving simulator experiment was conducted involving 36 participants who were distracted using three widely-used smartphone applications: Facebook, Facebook Messenger, and Google Maps. The urban environment was chosen for the experiment based on literature findings, focusing specifically on young adult drivers aged 18-33 years. This demographic was selected as they are more familiar with and prone to distraction by smartphone applications, in contrast to older drivers who often self-regulate by avoiding mobile phone use while driving (Donorfio et al., 2008).
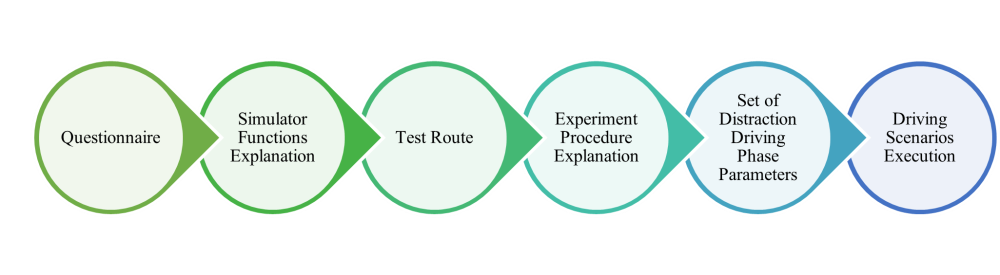
The experiment employed a driving simulator, offering a standardized and controlled environment for evaluating various driving-related measures and the impact of simultaneous smartphone use on driver performance and crash risk (Aksan et al., 2016; Eramudugolla et al., 2016). At the outset of the experiment, participants completed a questionnaire to provide demographic information and self-reported driving habits. Following this, participants were introduced to the functions and controls of the driving simulator. They received instructions on operating the simulator, including steering, braking, and accelerating, to ensure familiarity with the equipment. Each participant then drove a predefined test route on an urban road network during daytime. This initial drive aimed to familiarize participants with the simulator environment and its functions. It ensured that their driving behavior during the experiment reflected their real-life driving habits and was not influenced by the experimental setup. In addition, there was no distraction during this familiarization period. This period lasted less than five minutes but in case the participants needed more time to get familiar with the driving simulator it was slightly prolonged.
Participants were briefed on the experimental procedure, including the sequence of driving scenarios and the specific distraction tasks they would perform. They were informed about the distraction actions they would engage in during the experiment, such as navigating their Facebook feed, texting via Facebook Messenger (twice), and conducting location searches using Google Maps. Participants provided their Facebook profile username and placed their personal smartphones on a stand next to the driving simulator steering wheel. Participants in this study used their personal smartphones during the driving simulator experiments. This decision was made to enhance validity by reflecting real-world behaviors and contexts more accurately. Participants’ familiarity with their own devices, including their installed applications, settings, and preferred languages, minimized potential biases that could arise from using unfamiliar devices. Drivers were distracted during the driving scenarios (described in the next section) by performing the following actions: navigate in their Facebook feed, text via Facebook Messenger (2 times) and search for a location in Google Maps. Participants were required to search for specific locations using Google Maps, rather than navigating roads. This task was designed to reflect a common real-world distraction and was essential for assessing the impact of smartphone use on driving performance. All actions were requested by the experiment supervisor at predefined time steps, unknown to the participants. The steps of the experimental procedure is illustrated in Figure 1.
2.2. Driving scenarios
The urban environment used for the present study, consisted of a two-way road segment, with one or two lanes per direction and a speed limit of 60 km/h. Additionally, the network included three signalized intersections and one controlled by a stop sign as well as one roundabout where a yield sign controlled the entering flow. Participants navigated a standardized route that included diverse traffic elements, such as stop signs, traffic lights, and roundabouts, to ensure a varied and representative driving experience for all participants.
Four different driving scenarios were developed: driving at daylight under low and high traffic volume and driving at night under the same traffic conditions (low and high traffic volume). The low and high traffic volume conditions were defined based on the Gamma distributions appropriate for describing vehicle arrivals (Frantzeskakis & Giannopoulos, 1986). More specifically, low traffic volume corresponds to 300 vehicles/hour resulted from vehicles’ arrivals drawn from a Gamma distribution with 12 sec mean and 6 sec2 variance. On the other hand, high traffic volume corresponds to 600 vehicles/hour resulted from vehicles’ arrivals drawn from a Gamma distribution with 6 sec mean and 3 sec2 variance. The order of traffic volumes (low and high) and day/night conditions (daylight and nighttime) varied randomly for each participant. This randomized approach ensured that participants encountered a balanced distribution of scenarios, thereby minimizing the influence of order effects and enhancing the validity of findings.
Additionally, during each driving scenario, two unexpected events occurred: a child suddenly appeared on the roadway chasing a ball, and a car emerged suddenly from a parked position and entered the road segment. These events were selected primarily due to their availability within the simulator’s scenario library and their representation of common urban driving challenges. The simulator’s scenario library offered limited options, and these events were deemed suitable as they reflect scenarios frequently encountered in urban environments. Alternative scenarios, such as wild animals crossing the road, were also available but were considered less typical for the urban settings that aimed to simulate. These events were consistently placed within specific driving scenarios (e.g., high traffic volume) to maintain consistency and avoid learning effects, while varying across different scenarios (e.g., high vs. low traffic volume, daytime vs. night) to ensure variability. Figure 2 illustrates the possible locations of these events within the scenarios. The timing of these events was dynamically adjusted based on each driver’s speed and proximity to the event location to ensure that all participants had sufficient time to react realistically. Importantly, participants were not informed about the occurrence of these events to preserve the authenticity of the driving simulation. Each driving scenario lasted approximately 2 minutes and 30 seconds as shown in Figure 2. The entire experiment involved multiple scenarios, including low and high traffic volumes during both day and night conditions, totaling around 10 minutes for the four scenarios (each lasting approximately 2 minutes and 30 seconds) plus an additional test route that lasted approximately 5 minutes.
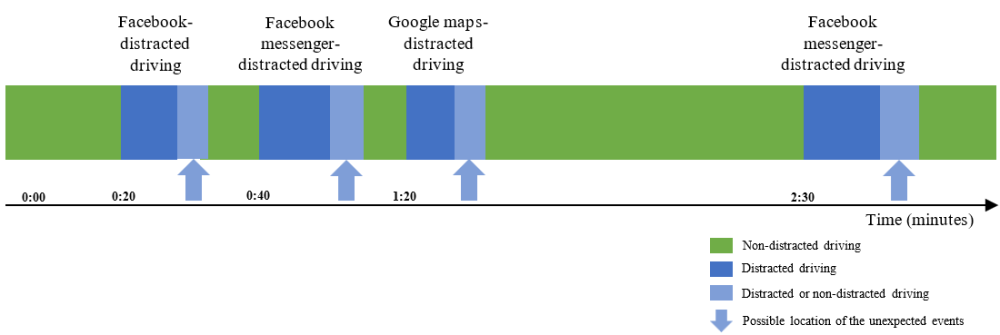
All participants experienced both distracted and non-distracted driving scenarios. The non-distracted conditions served as the control condition, where participants focused exclusively on driving without engaging in smartphone tasks. This method allowed for direct comparison of driving performance metrics between distracted and non-distracted conditions within each participant, ensuring a precise evaluation of the impact of smartphone use on driving behavior. In the “distraction” scenarios, each participant experienced the same time step and sequence of events. This approach ensures that any observed effects are attributable to the specific distraction tasks rather than variations in task order. Although the sequence of distraction applications was fixed, the tasks within each scenario were varied to ensure diversity: different questions to answer in Facebook messenger, different locations to search in Google maps, and a dynamically refreshed Facebook feed showing new content. Specifically, participants received questions via Facebook messenger, necessitating responses of at least one word (e.g., “What is your favorite color?”, “Where do you want to travel?”, etc.). In the “searching location” scenarios, participants were tasked with searching for specific locations in Google Maps (e.g., Search “Syntagma Square,” “Athens International Airport,” etc.). Regarding the “Facebook feed” scenarios, participants were instructed to navigate to their personal feed on Facebook, involving the perusal of posts, news, etc., from their Facebook “friends” that appeared in their feed page. This approach maintained a standardized experimental structure while capturing a range of naturalistic distracted driving behaviors.
Figure 2 delineates the sequence of distracted actions along with the aforementioned four potential locations of the two unexpected events. The occurrence of the events during each driving scenario was randomized across the four possible locations. Furthermore, the second unexpected event in each scenario was designed to differ in nature from the first (e.g., vehicle un-parking versus pedestrian crossing), reducing the likelihood of anticipation. This design enabled the collection of sufficient data to develop a statistically significant model of crash risk. The timestamps for these locations were strategically chosen to occur after the initiation of a distraction action, ensuring the possibility of a crash during both non-distracted and distracted driving. This success was achieved as participants concluded the distraction actions at their own pace. Figure 2 also illustrates the time during which some participants were distracted and others were not, coinciding with the occurrence of potential events.
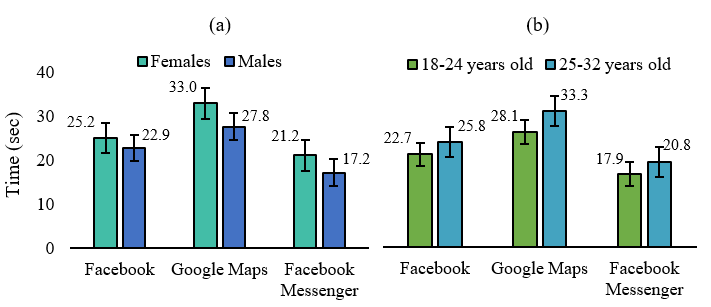
The timing of interference factors was specifically chosen to allow drivers sufficient recovery time between events. The distraction duration in the present study refers to the exact time that drivers were using their smartphones for fulfilling the required tasks. More specifically, the distraction time was defined through real time observations during the experimental procedure. Specifically, for texting via Messenger, distraction time was recorded from the moment the text was sent by the participant until they completed their response. Similarly, for scrolling through Facebook feeds, distraction time began when participants were instructed to start scrolling and concluded when they were directed to end this activity by the supervisor. For Google Maps, distraction time was measured from the moment participants were instructed to search for a location until they found the location they were instructed to search for. This method ensured that distraction durations were precisely measured based on specific task initiation and completion points, avoiding any ambiguity about when distraction periods began and ended. As shown in Figure 3, the time to complete the distraction scenarios was longer for the 25-33 years old and female drivers compared to the 18-24 years old and male drivers respectively. Besides, it was revealed that the use of Google Maps while driving required the longest distraction time period, compared to Facebook and Facebook Messenger. Finally, the shortest distraction time period was observed when drivers used Facebook Messenger.
2.3. Driving simulator
The experimental procedure is carried out on a driving simulator of Foerst Company, which is placed in the Traffic Engineering Laboratory at the School of Civil Engineering of the National Technical University of Athens (Figure 4-a). Simulator external features include seat, steering wheel, gas, brake, clutch petal, gearbox, horn, ignition (Figure 4-b) whereas its digital environment (Figure 4-c) is displayed through three LCD screens 40’’ (full HD: 1920x1080 pixels). The dimensions at a full development are 230x180 cm, while the base width is 78 cm and the total field of view is 170 degrees. Several studies have been conducted verifying the validity of driving simulators by comparing their virtual environment with field environment (Bham et al., 2014; Hussain et al., 2019; Rossi et al., 2020). More specifically, their findings illustrated that, the critical gaps observed in real world driving and those observed in the virtual environment of driving simulator were not present any significant differences, confirming the consistency of the driving behaviors.
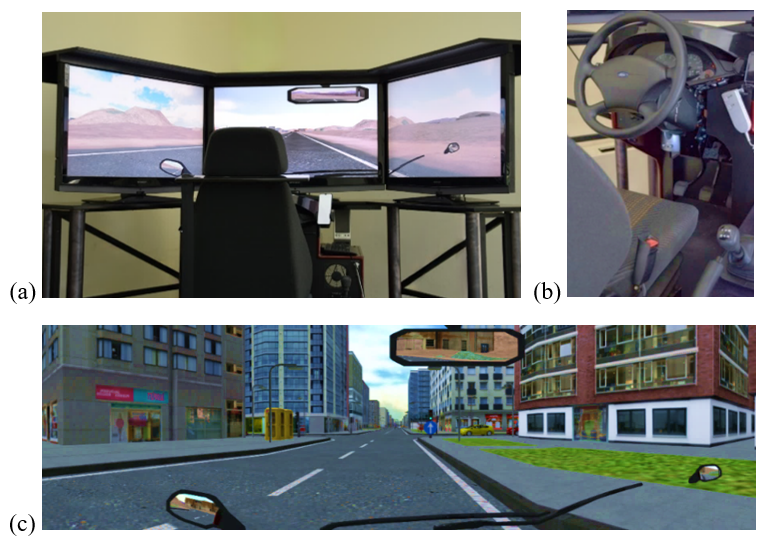
Concerning the driving simulator used for this study, a validation experiment was conducted in rural environment (Papantoniou et al., 2017) and its results showed high fidelity of the simulator in this network type. The results of this experiment are a first indicator of the simulator fidelity but definitely, similar processes should be carried out in urban environment and motorways. However, it can be assumed that the driving simulator can replicate quite realistically driving conditions. In particular, the digital environment is displayed from the driver point of view, such as mirrors, offering complete control. In addition, different scenarios can be developed depending on the road type, traffic volume, lighting and weather conditions while unexpected events, such as a sudden appearance of an adult pedestrian, a child chasing a ball on the roadway or a car suddenly coming out of a parking position and entering the road segment, can also be inserted. Data were recorded every 16-17ms, which means that 60 measurements per second were collected.
Experiment design
Participants for this study were employed using a convenience sampling method. Individuals were targeted within the university community, including undergraduate and postgraduate students, as well as staff members from the relevant departments. Participants were also included from various professions and educational levels. Potential participants were approached through direct invitations. This strategy ensured a diverse sample encompassing individuals from varied age groups and backgrounds, including different professions and educational levels.
The participants in this study were young drivers (aged 18–33 years), familiar with the use of smartphone applications while driving and holding valid driving licenses. Previous research has shown that sensation seeking and risky driving behaviors, such as increased mean speed, are characteristic of younger adults and typically decline with age (Brown et al., 2016; Nicholson et al., 2005). Additionally, novice driver performance improves significantly with driving experience (Williams & Ferguson, 2002). Based on these findings, and in alignment with similar research (Reimer et al., 2011), two age groups (18–24 years and 25–33 years) were defined to examine how age and driving experience may interact and influence distracted driving behaviors and crash risk.
For ensuring representativeness and reliability, the sample was quite equally distributed among sex (male and female). Overall, 36 drivers, 19 males and 17 females, participated in the experiment with an average driving experience equal to 5.4 years (SD=4.2 years) and mean age of 24.8 years (SD=3.6 years); 21 of them belonged to the first age group (18-24 years old) and 15 to the second age group (25-33 years old). Figure 5 shows the driving experience distribution between the two age groups.
The sample size of 36 drivers was determined based on established statistical principles and past research in the field of driving simulation studies. According to Ross (2004), a sample size greater than 30 is generally sufficient to represent the true population when a random sample is chosen, allowing for valid statistical conclusions about the entire population. This guideline is supported by Kwam and Vidakovic (2007), who suggest it provides robust statistical conclusions even with non-normal population distributions, and by Wang et al. (2019), whose study specific to driving simulator experiments supports that a sample size of 30 participants is acceptable.
The choice of 36 drivers exceeds this threshold, providing confidence in the reliability and validity of the findings. Preliminary power analyses from the aforementioned studies confirmed that the sample size would be sufficient to detect meaningful effects, considering the expected variability in driving behavior and distraction measures. In summary, the decision to use 36 drivers is well-supported by the literature. Additionally, different participants were exposed to each combination of driving scenarios in a completely randomized method, with an equal distribution by gender and age.
2.4. Methodology
Five models were developed to analyze the impact of smartphone texting and web surfing on young adult driver behavior and crash risk, and these models are presented in the manuscript. Specifically, the models include four linear mixed regression models for speed and speed deviation, headway and headway deviation and one binomial logistic mixed model for crash risk. Concerning crash risk, it was measured based on the occurrence of two unexpected events during each driving scenario, which were designed to simulate situations where a crash could potentially occur if the driver did not react appropriately. Additional variables, including lane deviation and reaction time, were also analyzed but were found to be statistically insignificant and are therefore not included in the final analysis. The decision to exclude these non-significant results aimed to prioritize significant findings that offer clear and actionable insights into the impact of smartphone distractions on driving performance. The analysis was carried out in R-studio.
Linear regression is used to model a linear relationship between a continuous dependent variable and one or more independent ones (Washington et al., 2011). Respectively, the binary logistic regression is used to model a relationship between a discrete dependent variable and one or more independent variables. The linear and binary logistic mixed regression is an extension of the linear and binary logistic regression respectively by adding random effects. The random effects in mixed models are expressed as random variable coefficients (random slopes) or random intercepts. In present study, the added value of random effects was assessed by conducting the log-likelihood test (ANOVA) comparison between the mixed effects with the fixed effects (standard) models.
Several attempts were carried out in order to conclude the best-fit statistical models, which fulfill the three predefined criteria. First of all, the relationships between all variables were tested by measuring correlation, in order to keep only those that were not highly correlated with each other and were correlated with the dependent variable. In case two independent variables were highly correlated, only one of them was included in the model. The next criterion was to determine the statistical significance of the independent variables. Only the independent variables with significant coefficient up to 95% confidence level were included in the final models. The statistical significance of the independent variables indicates that they have a significant impact on the dependent variables. The rejection of the null hypothesis for these variables implies that there are meaningful differences in their effects on the dependent variables. Finally, the last criterion was to achieve high model quality and fitting based on the Akaike Information Criterion (AIC), Bayesian Information Criterion (BIC) and Log-likelihood.
In addition, in order to measure the magnitude of the independent variables’ impact on the dependent variable the elasticities were calculated for estimating the responsiveness and sensitivity of the dependent variable, towards changes in the values of each of the independent variables. More specifically, elasticity is the response of the dependent variable for a 1% change of an independent continuous variable. In case of independent discrete variables, it is meaningful to implement pseudoelasticity in order to obtain the response of the dependent variable towards a category change of the discrete variables (Washington et al., 2011). The elasticity (e) and pseudoelasticity (E) are estimated using the following formulas (Equation 1 and 2).
where yi is the dependent variable and xi the independent variables.
where I is the number of possible options, Pi the probability of alternative i, xink the variable k value, for alternative i, of n subject, is the equation value when xink changes from 0 to 1, βixk the parameter of variable xnk when is 0 and βik the parameter of variable xnk.
In this study, the response variables, including speed, speed deviation (referring to standard deviation), headway, and headway deviation (also referring to standard deviation) were crucial for assessing driving behavior and crash risk under both distracted and non-distracted conditions. Speed represents the average velocity of the vehicle, while speed deviation denotes the standard deviation of speed measurements over time intervals. Headway indicates the average distance between participants’ vehicle and the vehicle ahead, and headway deviation refers to the standard deviation of these distances. These variables were continuously monitored and recorded by the driving simulator’s sensors and software algorithms throughout each scenario. Speed and headway data, as mean values, were collected in real-time during both distracted and non-distracted driving conditions. Speed deviation and headway deviation were calculated as the standard deviations from the mean values observed over specified time intervals during each scenario.
The dependent variables of the models are related to driving characteristics, which were derived from the extracted data of the driving simulator experiment, as shown in Table 1. Moreover, the independent variables that are selected to be included in the regression models meet all the above-described statistical criteria. The selected independent variables, obtained both from the questionnaire (e.g. sex, age, etc.) and the experiment (e.g. traffic volume, lighting condition, etc.), along with information about their type, their values, how these values were coded for being suitable for the statistical analysis and their descriptive statistics are presented in Table 1. In the table, the columns describe type, levels, the number of observations (N), and descriptive statistics, including minimum (Min), median (Median), mean (Mean), maximum (Max), and standard deviation (SD) for each variable.
| Model variables | Deriving from | Type | Levels | N | Min | Median | Mean | Max | SD |
|---|---|---|---|---|---|---|---|---|---|
| Dependent | |||||||||
| Speed (km/h) | Driving simulator | Continuous | - | 278 | 17.00 | 31.31 | 31.58 | 48.64 | 5.96 |
| Speed deviation (km/h) | Driving simulator | Continuous | - | 278 | 2.60 | 11.37 | 11.29 | 20.44 | 3.19 |
| Headway distance (m) | Driving simulator | Continuous | - | 278 | 14.92 | 60.82 | 71.59 | 204.33 | 40.14 |
| Headway distance deviation (m) | Driving simulator | Continuous | - | 278 | 3.62 | 37.80 | 39.74 | 81.11 | 18.08 |
| Crash risk (-) | Driving simulator | Discrete | 0: No crash occurred | 65 | - | - | - | - | - |
| 1: Crash occurred | 170 | - | - | - | - | - | |||
| Independent | |||||||||
| Texting/web surfing (-) | Experiment conditions | Discrete | 0: No distraction | 139 | - | - | - | - | - |
| 1: Distraction | 139 | - | - | - | - | - | |||
| Traffic volume (-) | Experiment conditions | Discrete | 0: Low | 140 | - | - | - | - | - |
| 1: High | 138 | - | - | - | - | - | |||
| Enjoying driving (-) | Questionnaire | Discrete | 0: No | 16 | - | - | - | - | - |
| 1: Yes | 262 | - | - | - | - | - | |||
| Sex (-) | Questionnaire | Discrete | 1: Male | 152 | - | - | - | - | - |
| 2: Female | 126 | - | - | - | - | - | |||
| Change driving behavior while using mobile phone (-) | Questionnaire | Discrete | 1: Stop the vehicle | 40 | - | - | - | - | - |
| 1.5: Stop the vehicle or decrease speed | 62 | - | - | - | - | - | |||
| 2: Decrease speed | 128 | - | - | - | - | - | |||
| 2.5: Decrease speed or decrease lateral position | 24 | - | - | - | - | - | |||
| 3: Decrease lateral position | 8 | - | - | - | - | - | |||
| 3.5: Decrease speed or no change | 8 | - | - | - | - | - | |||
| 4: No change | 8 | - | - | - | - | - | |||
| Daily frequency of texting/web surfing (-) | Questionnaire | Continuous | - | 278 | 0.00 | 2.67 | 2.82 | 4.00 | 0.80 |
| Daily routes on urban roads (-) | Questionnaire | Discrete | 0: 0 | 16 | - | - | - | - | - |
| 1: 1 | 86 | - | - | - | - | - | |||
| 2: 2 | 56 | - | - | - | - | - | |||
| 3: 3 | 40 | - | - | - | - | - | |||
| 4: 4 | 16 | - | - | - | - | - | |||
| 5: 5 | 8 | - | - | - | - | - | |||
| 6: >5 | 16 | - | - | - | - | - | |||
| Age (years) | Questionnaire | Continuous | - | 278 | 19.00 | 23.00 | 24.77 | 33.00 | 3.59 |
| Day/ Night (-) | Experiment conditions | Discrete | 0: Day | 138 | - | - | - | - | - |
| 1: Night | 140 | - | - | - | - | - | |||
| Weekly driven kilometers on urban roads (-) | Questionnaire | Discrete | 0: <0 | 97 | - | - | - | - | - |
| 1: 20-50 | 47 | - | - | - | - | - | |||
| 2: 50-100 | 70 | - | - | - | - | - | |||
| 3: 100-150 | 32 | - | - | - | - | - | |||
| 4: >150 | 32 | - | - | - | - | - | |||
| Days driving on urban roads (days) | Questionnaire | Continuous | - | 278 | 0.00 | 5.00 | 4.18 | 7.00 | 2.69 |
The daily frequency of texting/web surfing (Average) was assessed using a questionnaire where participants rated their usage for each of three different applications (Facebook Messenger, Google Maps, and Facebook) on a scale from 0 (Never) to 4 (Constantly), as categorical scales are widely used in questionnaire-based research to reduce variability and ensure statistical robustness. The final variable was derived by averaging these ratings across the three applications for each participant, resulting in a continuous measure of daily smartphone use frequency.
The variable “change in driving behavior while using a mobile phone” captures a spectrum of driver responses to smartphone distraction, ranging from stopping the vehicle to making no changes at all. This variable functions as an aggregate measure and indicates the overall trend that more significant behavior changes correlate with different driving outcomes. However, it does not isolate the effects of each specific behavior change. Instead, it illustrates the general relationship between the degree of behavior change and its impact on driving performance and crash risk.
The “enjoy driving” variable was derived from a question in the pre-experiment questionnaire that asked participants if they generally enjoy driving, with a yes or no response. This measure was used to capture participants’ overall attitudes towards driving and how they perceive their driving experience. The ‘enjoy driving’ variable was included in the analysis models due to its statistical significance in influencing driving performance.
The analysis included several driving experience variables to account for participants’ familiarity and comfort with urban driving, including “Daily routes on urban roads”, which refers to the typical routes that participants take daily within urban settings; “Weekly driven kilometers on urban roads”, representing the total distance participants drive on urban roads each week; and “Days driving on urban roads,” indicating the number of days per week participants drive on urban roads. These variables were essential for understanding the baseline driving experience of each participant and were included in the analysis to ensure a comprehensive assessment of how varying levels of urban driving experience might influence the impact of smartphone distractions on driving performance.
3. Results
3.1. Questionnaire
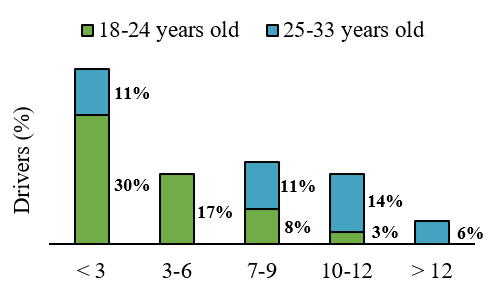
A questionnaire survey was conducted to identify driver profiles, their characteristics about smartphone usage as well as their familiarity of driving in urban environment. More specifically, the survey included 26 brief questions, separated in three categories. The first category included general questions (e.g. age, sex, etc.), the second one was related to driving experience (e.g. How many years have you been driving?, How many days do you drive per week in urban environment?, etc.) while driving behavior was the focus of the last category (e.g. How frequently do you use smartphone during driving in urban environment?, In which way do you change your driving behavior when you use your smartphone during driving?, etc.). Participants were asked to complete the questionnaire at the beginning of the experimental procedure. The questionnaire data concerning the use of the internet while driving in cities, showed some notable results. According to questionnaire answers, it seems that participants use more Google Maps, as 31% use it "sometimes and 33% “often”, compared to Facebook Messenger and Facebook. Additionally, the 5% and 14% of the drivers use Facebook Messenger “constantly” and “often”, respectively whereas, Facebook is not used “constantly” and only 8% and 6% uses it “often” and “sometimes”, respectively. The questionnaire, while naturally subjective, served a complementary role by offering additional insights into self-reported driver perceptions, which were statistically significant in certain models and contributed to building a more comprehensive understanding of driver behavior under distracted conditions.
3.2. Modelling speed
The independent variables found to be significantly associated with speed were: texting/web surfing, traffic volume, enjoying driving and sex. In addition, mixed effects were tested i.e., fixed effects and random intercepts; fixed effects and both random intercepts and slopes, in order to capture unique driver characteristics. The mixed effects found to have the lowest Akaike Information Criterion (AIC) values were: random intercepts capturing driver age, which probably indicates their driving experience, and both random intercepts and slopes capturing driver age and daily frequency of texting and web surfing, which might indicate their familiarity with smartphone applications. The log-likelihood test (ANOVA) comparison results, presented in Table 2, show that the most informative configuration is achieved when random intercepts are included in the model. Table 3 shows the final model results illustrating for each significant independent variable the coefficient, standard error (Std. error), significant code (Sig.), elasticity (e) and relevant elasticity (e*) as well as the AIC, Bayesian Information Criterion (BIC) and Log-likelihood values of the model.
| Model | Configuration | Df | Log-likelihood | p-value | Sig. |
|---|---|---|---|---|---|
| Standard linear model | Fixed effects only [Ref.] | 6 | -815.67 | - | - |
| Linear mixed model | Fixed effects and random intercepts | 7 | -807.43 | <0.001 | *** |
| Linear mixed model | Fixed effects, random intercepts and slopes | 9 | -804.95 | 0.083 |
| Independent variables | Coefficient | Std. error | Sig. | e | e* | |
|---|---|---|---|---|---|---|
| Discrete | Texting/Web surfing [Ref.: No distraction] | -2.733 | 0.524 | *** | -0.09 | 1.25 |
| Traffic volume [Ref.: Low] | -6.687 | 0.524 | *** | -0.21 | 3.05 | |
| Enjoying driving [Ref.: No] | 3.971 | 1.485 | ** | 0.13 | 1.81 | |
| Sex [Ref.: Male] | -2.193 | 0.575 | *** | -0.07 | 1.00 | |
| Constant | 33.762 | 1.533 | *** | - | - | |
| AIC | 1,628.868 | |||||
| BIC | 1,654.261 | |||||
| Log-likelihood | -807.434 | |||||
According to the coefficients in Table 3, speed decreases significantly when drivers engage in texting and web surfing. High traffic volumes also correlate with reduced driving speeds compared to low traffic conditions. Females consistently drive at lower speeds than males, while drivers who enjoy driving tend to drive faster than those who do not. The comparison of elasticities highlights that traffic volume has the strongest negative association with speed, while enjoyment of driving shows the only positive association. Specifically, texting and web surfing while driving are associated with a 9% decrease in speed, while high traffic volume leads to a 21% reduction. Drivers who enjoy driving exhibit speeds that are 13% higher, whereas females drive 7% slower than males. These elasticities, calculated by dividing each variable’s elasticity by the elasticity of the sex variable, demonstrate that distractions have a 25% stronger association with speed than sex. Moreover, traffic volume is associated with speed 305% more significantly than sex, and the enjoyment of driving is 81% more influential than sex in determining driving speeds.
3.3. Modeling speed deviation
The independent variables found to be significantly associated with speed deviation were: texting/web surfing, traffic volume, change driving behavior while using mobile phone and daily frequency of texting/web surfing. In addition, mixed effects were tested i.e., fixed effects and random intercepts; fixed effects and both random intercepts and slopes, in order to capture unique driver characteristics. The mixed effects found to have the lowest Akaike Information Criterion (AIC) values were: random intercepts capturing driver age, which probably indicates their driving experience, and both random intercepts and slopes capturing driver age and sex, as females drive less aggressively (Constantinou et al., 2011; Laapotti et al., 2003; Li et al., 2016; Vanlaar et al., 2008). The log-likelihood test (ANOVA) comparison results, presented in Table 4, show that the most informative configuration is achieved when both random intercepts and slopes are included in the model. Table 5 shows the final model results illustrating for each significant independent variable the coefficient, standard error (Std. error), significant code (Sig.), elasticity (e) and relevant elasticity (e*) as well as the AIC, Bayesian Information Criterion (BIC) and Log-likelihood values of the model.
| Model | Configuration | Df | Log-likelihood | p-value | Sig. |
|---|---|---|---|---|---|
| Standard linear model | Fixed effects only [Ref.] | 6 | -665.90 | - | - |
| Linear mixed model | Fixed effects and random intercepts | 7 | -667.46 | 0.077 | |
| Linear mixed model | Fixed effects, random intercepts and slopes | 9 | -661.50 | 0.003 | ** |
| Independent variables | Coefficient | Std. error | Sig. | e | e* | |
|---|---|---|---|---|---|---|
| Discrete | Texting/Web surfing [Ref.: No distraction] | -2.918 | 0.303 | *** | -0.23 | 17.76 |
| Traffic volume [Ref.: Low] | 1.474 | 0.304 | *** | 0.12 | 8.97 | |
| Change driving behavior while using mobile phone [Ref.: Stop the vehicle] | 1.105 | 0.262 | *** | 0.09 | 6.72 | |
| Continuous | Daily frequency of texting/ web surfing | -0.493 | 0.231 | * | -0.01 | 1.00 |
| Constant | 11.320 | 1.019 | *** | - | - | |
| AIC | 1,340.993 | |||||
| BIC | 1,373.642 | |||||
| Log-likelihood | -661.497 | |||||
Based on the coefficients presented in Table 5, speed deviation is associated with drivers engaging in texting and web surfing, as indicated by the coefficient values. Similarly, drivers who frequently use the internet via smartphones in their daily lives show lower speed deviations compared to non-users. Conversely, high traffic volume conditions are associated with increased speed deviation compared to low traffic volume scenarios. Additionally, drivers who maintain consistent driving behavior while using a mobile phone demonstrate higher speed deviation compared to those who alter their behavior.
The elasticities presented in Table 5 clarify these relationships. Texting and web surfing while driving have the most substantial negative association with speed deviation, reducing it by 23%. High traffic volume increases speed deviation by 12% compared to low traffic volume. The variable indicating changes in driving behavior while using a mobile phone shows an increase in speed deviation by 9%. Additionally, more frequent texting and web surfing in daily life are associated with lower speed deviations (Table 5). Relative to the variable with the lowest association (daily frequency of texting/web surfing), texting and web surfing while driving show a notably higher association, by 1776% according to relevant elasticity. Similarly, the traffic volume variable shows an association 897% higher than the variable with the lowest elasticity value, while the “changing behavior while using mobile phone” variable presents an association 672% higher.
3.4. Modelling headway distance
The independent variables significantly associated with headway distance include texting/web surfing, traffic volume, and sex. Additionally, mixed effects models were employed, testing fixed effects and random intercepts, as well as fixed effects with both random intercepts and slopes, to capture unique driver characteristics. Among these, the mixed effects models with random intercepts capturing driver age and both random intercepts and slopes capturing driver age and days driving on urban roads had the lowest Akaike Information Criterion (AIC) values, suggesting their significance in accounting for driver experience and familiarity with urban environments. The log-likelihood test (ANOVA) comparison results (Table 6) indicated that models incorporating random intercepts provided the most informative fit.
Table 7 presents the final model results, detailing the coefficient, standard error (Std. error), significant code (Sig.), elasticity (e), relevant elasticity (e*), as well as AIC, BIC, and Log-likelihood values of the model. According to the coefficients significant at a 95% confidence level in Table 7, headway distance decreases when drivers are distracted by texting and web surfing. Similarly, high traffic volume conditions also lead to reduced headway distances compared to low traffic volume scenarios. Additionally, female drivers maintain greater distances compared to male drivers.
Comparing the elasticities presented in Table 7, traffic volume demonstrates the most pronounced negative association with headway distance, while the impact of texting and web surfing is comparatively lower. Specifically, texting and web surfing while driving decrease headway distance by 6%. Additionally, high traffic volume leads to a 58% reduction in headway distance. Female drivers maintain a 6% greater headway distance than male drivers, and younger drivers exhibit higher headway distances compared to older drivers during driving tasks. As indicated by the relevant elasticities, calculated by dividing each variable’s elasticity by that of the variable with the lowest association (sex), the association of distraction with traffic volume is notably higher, by 101% and 1050%, respectively, compared to the “sex” variable.
| Model | Model configuration | Df | Log-likelihood | p-value | Sig. |
|---|---|---|---|---|---|
| Standard linear model | Fixed effects only [Ref.] | 5 | -1,269.8 | - | - |
| Linear mixed model | Fixed effects and Random Intercepts | 6 | -1,262.6 | <0.001 | *** |
| Linear mixed model | Fixed effects, Random Intercepts and Slopes | 8 | -1,260.8 | 0.179 |
| Independent variables | Coefficient | Std. error | Sig. | e | e* | |
|---|---|---|---|---|---|---|
| Discrete | Texting/Web surfing [Ref.: No distraction] | -6.139 | 2.867 | * | -0.06 | 1.01 |
| Traffic volume [Ref.: Low] | -63.974 | 2.868 | *** | -0.58 | 10.50 | |
| Sex [Ref.: Male] | 6.092 | 2.879 | * | 0.06 | 1.00 | |
| Constant | 103.750 | 2.805 | *** | - | - | |
| AIC | 2,537.128 | |||||
| BIC | 2,558.872 | |||||
| Log-likelihood | -1,262.564 | |||||
3.5. Modeling headway distance deviation
The independent variables found to be significantly associated with speed deviation were: texting/web surfing, traffic volume, day/night, sex and weekly driven kilometers on urban roads. In addition, mixed effects were tested i.e. fixed effects and random intercepts; fixed effects and both random intercepts and slopes, in order to capture unique driver characteristics. The mixed effects found to have the lowest Akaike Information Criterion (AIC) values were: random intercepts capturing driver age, which probably indicates their driving experience, and both random intercepts and slopes capturing driver age and sex, as females drive less aggressively (Constantinou et al., 2011; Laapotti et al., 2003; Li et al., 2016; Vanlaar et al., 2008). The log-likelihood test (ANOVA) comparison results (Table 8) that the most informative configuration is the inclusion of random intercepts in the model. Table 9 shows the final model results illustrating for each significant independent variable the coefficient, standard error (Std. error), significant code (Sig.), elasticity (e) and relevant elasticity (e*) as well as the AIC, BIC and Log-likelihood values of the model.
| Model | Model configuration | Df | Log-likelihood | p-value | Sig. |
|---|---|---|---|---|---|
| Standard linear model | Fixed effects only [Ref.] | 7 | -1,101.3 | - | - |
| Linear mixed model | Fixed effects and Random Intercepts | 8 | -1,094.8 | <0.001 | *** |
| Linear mixed model | Fixed effects, Random Intercepts and slopes | 10 | -1,088.6 | 0.002 | ** |
| Independent variables | Coefficient | Std. error | Sig. | e | e* | |
|---|---|---|---|---|---|---|
| Discrete | Texting/Web surfing [Ref.: No distraction] | -10.317 | 1.567 | *** | -0.18 | 7.80 |
| Traffic volume [Ref.: Low] | -21.988 | 1.567 | *** | -0.38 | 16.63 | |
| Day/ Night [Ref.: Day] | -3.990 | 1.567 | * | -0.07 | 3.02 | |
| Sex [Ref.: Male] | 4.192 | 1.578 | ** | 0.07 | 3.17 | |
| Weekly driven kilometers on urban roads [Ref.: 0] | 1.322 | 0.575 | * | 0.02 | 1.00 | |
| Constant | 53.970 | 1.938 | *** | - | - | |
| AIC | 2,205.585 | |||||
| BIC | 2,234.577 | |||||
| Log-likelihood | -1,094.793 | |||||
Based on the significant coefficients (at a 95% confidence level) in Table 9, headway distance deviation is associated with drivers being distracted by texting and web surfing. High traffic volume conditions are also linked to decreased headway distance deviation compared to low traffic volume, while nighttime driving shows reduced headway distance deviation compared to daytime driving. Conversely, drivers covering more kilometers weekly on urban roads experience increased headway distance deviation, and female drivers exhibit higher distance deviations than male drivers.
Analyzing the elasticities in Table 9 reveals that traffic volume has the most significant negative association with headway distance deviation, whereas texting and web surfing exhibit the least association. Specifically, texting and web surfing decrease headway distance deviation by 18%. Additionally, high traffic volume leads to a 38% reduction in headway distance deviation compared to low traffic volume, and nighttime driving reduces it by 7%. Furthermore, drivers covering more kilometers weekly on urban roads experience a 2% increase in headway distance deviation, while female drivers exhibit 7% higher deviation compared to males. The elasticities further highlight that the distraction variable’s association with headway distance deviation is 780% higher than that of the weekly driven kilometers variable. In comparison, the “day/night” variable has 302% more influence on headway distance deviation than the weekly driven kilometers variable. Lastly, the sex variable’s association is 317% higher than that of the weekly kilometers variable.
3.6. Modeling crash risk
The binomial (or binary) logistic regression model developed to determine the association of the various parameters with crash risk showed that the statistically significant independent variables, over 99% confidence level, are texting/web surfing, sex, change driving behavior while using mobile phone, days driving on urban roads, age and mobile risk perception. In addition, mixed effects were tested i.e. fixed effects and random intercepts; fixed effects and both random intercepts and slopes, in order to capture unique driver characteristics. The mixed effects found to have the lowest AIC values were random intercepts capturing daily routes on urban roads, which probably indicates familiarity with urban environment, and both random intercepts and slopes capturing daily routes on urban roads and driver age, which probably indicates their driving experience. The log-likelihood test (ANOVA) comparison results, presented in Table 10, show that the inclusion of both random intercepts and slopes in the model gives the most informative configuration. Table 11 shows the final model results illustrating for each significant independent variable the coefficient, standard error (Std. error), significant code (Sig.), elasticity (e) and relevant elasticity (e*) as well as the AIC, BIC and Log-likelihood values of the model.
| Family | Model configuration | Df | Log-likelihood | p-value | Sig. |
|---|---|---|---|---|---|
| Standard binomial model | Fixed effects only [Ref.] | 4 | -126.14 | – | – |
| Binomial mixed model | Fixed effects and random intercepts | 5 | -125.21 | 0.173 | |
| Binomial mixed model | Fixed effects, random intercepts and slopes | 7 | -112.41 | <0.001 | *** |
| Independent variables | Coefficient | Std. error | Sig. | e | e* | |
|---|---|---|---|---|---|---|
| Discrete | Texting/Web surfing [Ref.: No distraction] | 0.824 | 0.362 | * | 0.10 | 1.00 |
| Sex [Ref.: Male] | 1.523 | 0.423 | *** | 0.26 | 1.85 | |
| Change driving behavior while using mobile phone [Ref.: Stop the vehicle] | 1.350 | 0.348 | *** | 0.21 | 1.64 | |
| Constant | -2.539 | 0.733 | *** | - | - | |
| AIC | 238.8 | |||||
| BIC | 263.0 | |||||
| Log-likelihood | -112.4 | |||||
According to the coefficients at a 95% confidence level in Table 11, texting and web surfing while driving increases crash risk. Similarly, not altering driving behavior while using a mobile phone also escalates crash risk. Additionally, female drivers exhibit higher crash risk compared to males. Elasticity analysis reveals that texting or web surfing and sex variables show the lowest and greatest positive associations with crash risk, respectively. Specifically, texting and web surfing raise crash risk by 10%, while female drivers have a 26% higher crash risk than males. Drivers who maintain their driving behavior while using a mobile phone experience a 21% increased crash risk. Elasticity values, calculated by dividing each variable’s elasticity by that of texting or web surfing (the variable with the lowest association), demonstrate that the sex variable influences crash risk 185% more than texting or web surfing, and the behavior change variable impacts crash risk 164% more.
4. Discussion
A significant outcome of this study is a 9% reduction in average speed observed when drivers engage in texting and web surfing while driving. This decrease suggests a deliberate effort by drivers to mitigate perceived risks associated with distracted driving, aligning with previous research on distraction effects (Vollrath et al., 2021; Wang, 2016). Additionally, drivers who express a dislike for driving exhibited a 13% lower speed, potentially indicating a cautious driving approach linked to lower confidence or higher neuroticism (Lajunen & Summala, 1995). Drivers under distraction showed a 23% decrease in speed deviation, indicating a tendency to maintain more consistent speeds despite external influences. This finding contrasts with previous studies suggesting increased variability in driving speeds under distraction (Stavrinos et al., 2013), highlighting the need for further exploration of cognitive and behavioral mechanisms. The study revealed a 6% reduction in headway distance during distracted driving episodes, suggesting compromised monitoring of traffic conditions and reduced safety margins (Wang et al., 2020). This finding is consistent with naturalistic driving studies that report decreased headway variability under distraction, emphasizing potential safety implications (Wang et al., 2020).
Sex differences were evident, with female drivers consistently exhibiting lower speeds and longer headway distances compared to males. This finding aligns with existing literature suggesting a more cautious driving style among females (Laapotti et al., 2003; Li et al., 2016), potentially influencing their response to distractions differently. However, female drivers are more likely to be involved in high-risk situations (Bingham & Ehsani, 2012; Li et al., 2019). The observed higher crash risk for female drivers in this study, despite their less aggressive and slower driving style, can be attributed to several factors. Psychological factors, such as differences in risk perception and stress response between sexes, might play a significant role in influencing driving performance under simulated high-risk conditions. Female drivers may exhibit higher levels of anxiety, leading to overcompensation in challenging driving scenarios, which could increase the likelihood of crashes. Additionally, situational awareness and multitasking abilities under distraction might differ between sexes, impacting the ability to respond effectively to sudden hazards.
The study found a significant 10% increase in crash risk associated with smartphone texting and web surfing while driving. This heightened risk underscores the critical importance of distraction management in reducing road accidents (Asbridge et al., 2013; Drews et al., 2009). Furthermore, female drivers demonstrated a higher crash risk compared to males, possibly reflecting differences in risk perception and responses to hazardous situations (Bingham & Ehsani, 2012; Li et al., 2019). Drivers who reported not altering their behavior when using mobile phones showed a 21% increased crash risk, highlighting the role of self-regulation in safe driving practices (Sümer et al., 2006).
5. Conclusions
This study investigates the effects of web surfing and texting on driving behavior and safety in urban environments using a driving simulator experiment with 36 young adult drivers aged 18 to 33. Data from low and high traffic conditions, daytime and nighttime driving scenarios, and distractions from Facebook, Google Maps, and Facebook Messenger were analyzed. Statistical analyses, including linear and binary logistic mixed regression models, explored their impact on speed, speed deviation, headway distance, headway distance deviation, and crash risk.
The analysis conducted sheds light on critical road safety issues exacerbated by smartphone distractions. These findings offer valuable insights for road safety researchers, experts, and stakeholders, emphasizing the imperative to implement effective strategies that reduce smartphone usage during driving. Beyond technological development, which already exists in many forms, the study underscores the pressing need for comprehensive implementation strategies. This includes integrating existing technologies like driver alert systems and smartphone muting applications with robust enforcement policies. Practical solutions such as these are crucial in overcoming current implementation barriers and translating research insights into tangible road safety improvements. Policymakers are encouraged to leverage these findings to prioritize effective interventions tailored to mitigate the impact of smartphone use on crash risk and driving behavior. Furthermore, the study advocates for innovative approaches, such as real-time driver monitoring applications and collaborative efforts among stakeholders, to ensure sustained and impactful changes in driver behavior and road safety practices.
Further research is essential to generalize study findings. A larger participant sample could reveal additional significant variables. Including older drivers and diverse statistical methods may alter variable impacts. Studying different road types and adverse weather conditions could yield insights into smartphone use effects on driver performance and crash risk. Examining diverse smartphone distractions, such as holding devices or using voice technology, is crucial. Similarly, other cellphone-use distractions, including listening to music, watching short videos, and answering phone calls, are important contributors to distracted driving and warrant further investigation. Future research could explore these distraction types to provide a broader understanding of their impacts on driving behavior and crash risk, particularly across various road types and driver demographics. Additional variables like lateral vehicle movement and reaction times during unexpected events warrant exploration. Analyzing eye movements during distractions can offer valuable insights. Future studies should deepen this study understanding of these interactions and develop targeted interventions to reduce crash risk for female drivers in urban environments. Moreover, this study underscores the need for further research on how headway distance deviation impacts road safety, contributing to enhanced driving practices and safety measures.
CRediT contribution statement
Maria G. Oikonomou: Conceptualization, Data curation, Formal analysis, Methodology, Writing—original draft. Foteini Orfanou: Conceptualization, Formal analysis, Methodology, Writing—review & editing. Marios Sekadakis: Data curation, Methodology. Dimosthenis Pavlou: Formal analysis, Methodology. George Yannis: Conceptualization, Supervision.
Declaration of competing interests
The authors declare no competing interests.
Ethics statement
All data were handled following strict information security protocols and privacy standards, fully aligned with the General Data Protection Regulation (GDPR) of the European Parliament and the Council of the European Union (EU, 2016). Consequently, all data were analyzed in a completely anonymized format. The authors affirm that this study was conducted in accordance with the ethical principles of the Declaration of Helsinki, as no individuals were harmed or physically or mentally impacted during the driving measurements, and all drivers participated voluntarily. Additionally, the ethics guidelines were approved by the Director of the Department of Transportation Planning and Engineering at the School of Civil Engineering, National Technical University of Athens.
Funding
This research did not receive any specific grant from funding agencies in the public, commercial, or not-for-profit sectors.
Declaration of generative AI use in writing
The authors declare that no generative AI was used in this work.
Editorial information
Handling editor: Lai Zheng, Harbin Institute of Technology, China.
Reviewers: Nengchao Lyu, Wuhan University of Technology, China; Peijie Wu, Chongqing Jiaotong University, China.
Submitted: 30 August 2024; Accepted: 9 February 2025; Published: 19 March 2025.