Single-vehicle injury crashes on rural roads in Iceland: contribution of unforgiving roadsides to fatal and serious injuries of vehicle occupants
Handling editor: Carmelo D’Agostino, Lund University, Sweden
Reviewers: Lars Ekman, Swedish Transport Administration (retired), Sweden
Ravi Shankar, National Institute of Technology Warangal, India
Received: 28 August 2024; Accepted: 10 December 2024; Published: 24 January 2025
Abstract
About 50% of the most severe crashes on rural roads in Iceland are run-off-road crashes. Many existing roads were designed before the concept of forgiving roadsides became prevailing in road design in Iceland. This research aimed to find the roadside elements that significantly increase the probability of high severity of single-vehicle injury crashes compared to low severity crashes on rural roads to prioritize safety improvements under limited budgets. In this research, 712 police records on single-vehicle injury crashes on rural state roads in Iceland in 2016–2018 were investigated. Crash data developed from police reports do not typically include information on roadside elements even though such information is often visible in photographs or written in words by police officers in their crash reports. This limits research on roadside elements and unforgiving roadsides. In this study, the original written police reports and crash photographs were reviewed. Based on this, additional data regarding the roadside elements were coded and added to the standard crash data. A binary logit model for the most severe injury in each crash was developed to statistically test the effect of roadside elements on the probability of fatal and serious injury versus low severity. The model results showed that two roadside elements, rocks and steep transverse slopes (e.g., where an access road enters a main road), hit by a vehicle in a run-off-road crash, more than doubled the probability of high severity. Road safety measures where roadside rocks are removed or steep transverse slopes are reduced, thereby making roadsides more smooth and forgiving, can be especially beneficial for safety because road users are unlikely to adapt their behavior to increased safety from such improvements. This is because such improvements are likely not easily noticed by road users; hence they reduce the probability of compensatory behavior such as increased driving speed, which could outweigh the safety benefits. The results revealed other contributing factors which more than double the probability of high severity of single-vehicle injury crashes on rural roads. Driver intoxication had the strongest effect, a problem which interestingly was limited to drivers living in Iceland. Not a single foreign tourist driver in this data was noted as being under the influence of alcohol or illegal drugs. To strengthen the analysis of the contribution of roadside elements to the severity of run-off-road crashes and to monitor the effects of improvements in the future, it is recommended that additional information on roadside elements be coded and added to the standard police record crash data.
Keywords
injury severity, run-off-road crashes, unforgiving roadsides
Introduction
In the period 2014–2018, about 42% of the total number of crashes with fatal or serious injuries in Iceland occurred on state roads in rural areas. The majority of those crashes, or 51%, were run-off-road crashes. This is why making the roadsides more forgiving has been one of the priorities in the road safety work of the Icelandic Road and Coastal Administration (Alþingi, 2008). The concepts of a safety zone along roads and forgiving roadsides were added to the Icelandic road design rules in 2009 (Vegagerdin, 2010). The need to improve roadsides is enormous, and the availability of funds is limited. Therefore, it is important to research how roadside improvements should be prioritized. Knowledge of the roadside elements that significantly contribute to the high injury severity of crashes on rural roads is essential. The contributing factors to the severity of run-off-road crashes include various driver, vehicle, road, and environmental factors as well as other crash characteristics (Duddu et al., 2020; Kim et al., 2013; Okafor et al., 2023; Wen & Xue, 2020; Wu et al., 2016; Xie et al., 2012).
Roadsides designed to be more forgiving can considerably reduce the severity of run-off-road crashes (La Torre et al., 2012). Unprotected trees in the roadside have been shown to increase the probability of fatal injury of the driver (Holdridge et al., 2005). The presence of trees along the roadway section was shown to decrease the likelihood of the crash not having an evident injury (Lee & Mannering, 2002). Trees have been shown to be Poland's main roadside hazard (Budzynski et al., 2017). A steep slope has been linked with an increased risk of fatality, independent of whether the model is applied to the injury of a driver or the most severely injured occupant (Roque et al., 2015). However, relatively few publications describe the contribution of various roadside elements, such as slopes, to the severity of roadside crashes (Cheng et al., 2021). This points to a research gap because data on roadside features is often unavailable or incomplete in official crash data. This has specifically been noted in research from Portugal (Roque et al., 2015). This lack of data on roadside features is evident when variables in models in recent research articles on severity analysis of single-vehicle crashes are examined (Duddu et al., 2020; Okafor et al., 2023; Wen & Xue, 2020). Additional work to address this research gap is therefore important.
An important aspect regarding roadside elements is that safety measures aimed at improving the roadside can often go unnoticed by road users. This is important because roadside improvements are more likely to yield the intended safety benefits because drivers do not adapt to the improvements. The key here is that each road safety measure affects road safety both directly due to improved engineering design of facilities and through adaptations in road user behavior in response to the road safety measure (Evans, 1985; Evans, 1991). Road safety measures may be less effective than expected because of behavioral adaptation. One example is road lighting, which has, among other things, had the effect that speed increases and road users tend to be somewhat less alert (Assum et al., 1999; Fosser & Bjørnskau, 1996). On the other hand, if the safety benefits of a countermeasure are hidden (e.g., airbags), behavioral adaptation is less likely to occur (Smiley & Rudin-Brown, 2020). Here, it is argued that road safety measures aimed at making the roadsides forgiving can, in many cases, be considered hidden from road users. They are, therefore, likely to yield the full intended safety benefit since road users are less likely to adapt their behavior and negate the safety effect, e.g. by increasing speed because the roadside has been made more forgiving. It is noted that the installation of guardrails is not considered such a hidden measure but can be considered a part of making the roadside forgiving when the roadside is, for example, a high and steep slope, cliff, sea, or river.
The main objective of this research is to review written police reports and included photographs, as well as develop and code new data variables on roadside elements visible in the photographs or mentioned in the police officers' written text. These data variables are added to the standard police record data on crashes, to investigate the effect of roadside elements on injury severity in single-vehicle injury crashes on rural roads in Iceland. The findings should provide critical information for prioritizing safety improvements for rural roads that can be relevant to Iceland and other societies.
Data
This research used data on road crashes from the national crash database maintained by the Icelandic Transport Authority. The data is based on police records. The research data includes information on single-vehicle automobile injury crashes on rural state roads in Iceland in 2016–2018 and excludes crashes involving motorcyclists, bicyclists, and pedestrians since the focus is on crashes on the rural highway network.
The roadway network under the Icelandic Road and Coastal Administration is about 13.000 km. In Iceland, the general speed limit on rural roads is 90 km/hour on paved roads (most paved roads have surface dressing, not asphalt) and 80 km/hour on gravel roads and is not determined by road width, road geometry, roadside features and environment. At certain locations, the speed limit in rural surroundings has been lowered to 70 km/hour and, more rarely, to 50 km/hour. The traffic numbers, AADT, on rural state roads vary widely, from almost no traffic to 20 thousand cars/day. About 2/3 of total vehicle-km driven on the state road system occur in rural areas.
To address the research gap regarding roadside elements, the original police reports on the crashes, which met the conditions listed above, were reviewed at the headquarters of the National Commissioner of the Icelandic Police, based on permission from the Data Protection Authority. For each crash, roadside elements, which were expected to influence the consequences of the crash, were derived from written text descriptions and or photos in the police reports and coded. More detailed information on the causes of crashes was also coded into new variables. In some cases, photos and/or text descriptions were missing, and consequently, there might be some underreporting of these factors. In total, 712 injury crashes were investigated.
Of the 712 single-vehicle injury crashes, 12 crashes were fatal crashes, 101 crashes were serious injury crashes, and 599 were minor injury crashes. The injury severity of each crash is categorized based on the most serious injury among all vehicle occupants in the crash. There were 1544 persons involved in the 712 single-vehicle injury crashes, 14 fatalities, 134 seriously injured, 961 with minor injuries, and 435 persons were not injured.
Most single-vehicle injury crashes, 626, or 87.9%, were run-off-road crashes. Of the 113 crashes where the most severe injury was fatal or serious, 107 or 94.7%, were run-off-road crashes. Single-vehicle injury crashes involving a crash with road equipment are not classified as run-off-road crashes in the national database; such crashes are classified into their own crash types, such as crashes with a light pole, guardrail, or traffic sign, etc., and are included in the dataset.
In 182 of the 712 single-vehicle injury crashes, or 25.6%, the driver was a foreign tourist. These 182 crashes could be categorized as follows: Three of them were fatal crashes, 33 were serious injury crashes and 146 were minor injury crashes. There were 513 persons involved in the 182 single-vehicle injury crashes of foreign tourist drivers: 5 fatalities, 46 were seriously injured, 290 with minor injuries and 172 persons were not injured. The average number of occupants per vehicle in crashes involving foreign tourist drivers is higher than in crashes with drivers living in Iceland, or 2.82 versus 1.95, respectively. This difference is statistically significant at the 99% level, according to a t-test.
Analytical methods and description of variables
There are three injury classifications in the data set: fatal injuries, serious injuries, and minor injuries. Cases with property damage only are not included in the data set because police records on them are much less comprehensive than for injury crashes, and it is not required to report non-injury crashes to the police in Iceland. The number of fatal injury crashes is low, making a separate statistical analysis of that category impossible. For this reason, fatal and serious injury crashes were combined into one category of high severity. The high severity crashes are defined as crashes where at least one vehicle occupant was fatally injured or received serious injury. Minor injury crashes remain as one low severity category, which is defined as crashes where the most severe injury in the crash, across all occupants, was a minor injury.
To explore the effect of the observed driver, vehicle, road, roadside, and environmental variables on the probability of high or low severity, conditional on a crash having occurred, we use a binary logit model (Washington et al., 2011):
where is the probability of crash having most severe injury in category , and the categories are (1) low severity, and (2) high severity (fatal and serious injury). The propensity function is:
where is a vector of estimated coefficients, and is a vector of observed data variables for crash in injury severity category 2, which is here taken as the high severity category. The is an unobserved error term. We have taken the propensity of the low severity category as the base case and its value is fixed, . The fundamental assumptions of the model are that: the model is conditional on a crash having occurred; the propensity towards an injury category can be written as a linear-in-parameters function of observable variables with an added unobserved heterogeneity error term, which is identically and independently type I extreme value (Gumbel) distributed; the observed injury category is the one with the highest propensity; the estimated coefficients are invariant over the time period; the data are representative of the population of crashes being studied.
In the first phase of the model building, all the variables that are expected to have a correlation to the most severe injury are added to the model. Then, the hypothesis of no significant difference from zero is tested for each coefficient on each variable using the Student's t-test. Coefficients that are not statistically significantly different from zero at the 90% level are constrained to zero. The reason for using a 90% level of significance, rather than the more commonly used 95% level, is that the dataset is not large, and it is worth erring on the side of inclusion at this stage so that all reasonably significant variables may be investigated further.
Since the dependent variable is based on the most severe injury in the vehicle, the number of vehicle occupants will matter for the analysis. To explore the effect of the number of vehicle occupants, the data set is divided into three groups based on vehicle occupancy, crashes with a) one occupant, b) two occupants, or c) three or more vehicle occupants. Models are built for each of the three sub-datasets. Then, a log-likelihood ratio test (LR-test, a chi-square distributed test statistic) is used to test if this division of the data set is statistically significantly better than using a combined model with a single variable for the number of vehicle occupants.
Two additional experiments are carried out regarding the effects of the number of vehicle occupants on the results of the injury severity model. First, non-linear effects of the number of vehicle occupants are tested by adding the number of vehicle occupants in the second power to the model, based on the undivided data set, which includes a variable for the number of vehicle occupants. Second, indicator variables for the different vehicle occupancies are tested.
To find how much the probabilities of the severity categories of single-vehicle injury crashes change on the average when each of the explanatory variables in the model, changes from 0 to 1 for all observations, the average pseudo-elasticity is calculated (Shankar & Mannering, 1996; Ulfarsson & Mannering, 2004).
Descriptive statistics for the 55 explanatory variables used in the binary logit model are shown in Appendix A.
Results
In Table 1, the estimation results for the binary logit model of the severity of single-vehicle injury crashes on state roads in rural surroundings is presented. The model includes 15 explanatory variables. The coefficient estimates and standard errors, found by the method of maximum likelihood for the injury category high severity, i.e. when the most serious consequence of the crash, across all occupants, is fatal or serious injury, can be seen in the table. The dataset in this study consists of injury crashes only. The low severity of a crash, meaning that the most serious consequence of the crash is minor injury, is the base case with coefficients restricted at zero.
|
Contributing factor |
High severity of crash (Fatality or serious injury) |
|
|---|---|---|
|
Roadside elements |
|
|
|
Roadside hazards: Rock |
1.28584 (0.42836)** |
|
|
Roadside hazards: Steep transverse slope |
1.01683 (0.45358)* |
|
|
Road characteristics |
|
|
|
Winter conditions (snow, ice or slush) on road surface |
-0.83447 (0.26631)** |
|
|
Specific roads: Section of the Ring Road along the south coast |
1.56396 (0.38681)** |
|
|
Specific roads: Reykjanesbraut |
0.98499 (0.47986)* |
|
|
Region: Northwest |
0.69735 (0.36557) |
|
|
Region: East |
0.84516 (0.29899)** |
|
|
Environmental characteristics |
|
|
|
A gust of wind or strong wind |
0.87344 (0.41343)* |
|
|
Vehicle characteristics |
|
|
|
Vehicle type: Heavy truck |
1.06867 (0.49549)* |
|
|
Vehicle type: Full-size SUV |
0.63045 (0.36802) |
|
|
Old vehicle (≥ 11 years) |
0.62561 (0.25094)* |
|
|
Number of vehicle occupants |
0.10994 (0.04009)** |
|
|
Driver characteristics |
|
|
|
Foreign tourist driver |
0.61648 (0.29351)* |
|
|
Driver is (or is suspected to be) intoxicated |
1.79044 (0.35562)** |
|
|
Age of driver: 21–24 |
-0.66656 (0.36969) |
|
|
Constant |
-3.03688 (0.29900)** |
|
|
No. of observations |
712 |
|
|
Log-likelihood for constant only |
-311.515 |
|
|
Log-likelihood at convergence |
-262.711 |
|
|
|
0.157 |
|
Standard errors of parameter estimates are in parentheses.
Level of significance: all greater than 90%, * > 95%, and ** > 99%.
Positive coefficients in Table 1 increase the probability of high severity conditional on a single-vehicle injury crash, and the probability of low severity decreases. Negative coefficients in Table 1, on the other hand, decrease the probability of high severity conditional on a single-vehicle injury crash, and the probability of low severity increases.
As mentioned in section 3, the effects of the number of vehicle occupants were tested, first by dividing the dataset into three occupancy groups (one occupant, two occupants, or three or more occupants), second by adding a squared term for the number of vehicle occupants, and thirdly by using indicator variables for the occupancy groups. The results of these tests revealed that it was statistically sufficient, at the 95% significance level, to include a linear variable on the number of vehicle occupants in an undivided model. Model fit was not improved by dividing the model, squaring the number of occupants, or using indicator variables.
To find how much the probabilities of the severity categories of single-vehicle injury crashes change on average when each of the explanatory variables in the model, which can be classified as 0/1 indicator variables, changes from 0 to 1 for all observations, the average pseudo-elasticity was calculated. The results are presented in Table 2.
|
Contributing factor |
High severity of crashes |
Low severity of crashes |
|
|---|---|---|---|
|
Roadside elements |
|
|
|
|
Roadside hazards: Rock |
172.9% |
-24.6% |
|
|
Roadside hazards: Steep transverse slope |
124.3% |
-18.9% |
|
|
Road characteristics |
|
|
|
|
Winter conditions (snow, ice or slush) on road surface |
-50.8% |
13.4% |
|
|
Specific roads: Section of the Ring Road along the south coast |
232.8% |
-30.3% |
|
|
Specific roads: Reykjanesbraut |
119.2% |
-18.2% |
|
|
Region: Northwest |
76.6% |
-12.1% |
|
|
Region: East |
99.3% |
-14.4% |
|
|
Environmental characteristics |
|
|
|
|
A gust of wind or strong wind |
101.9% |
-15.7% |
|
|
Vehicle characteristics |
|
|
|
|
Vehicle type: Heavy truck |
133.0% |
-20.0% |
|
|
Vehicle type: Full-size SUV |
67.4% |
-10.9% |
|
|
Old vehicle (≥ 11 years) |
69.3% |
-9.4% |
|
|
Driver characteristics |
|
|
|
|
Foreign tourist driver |
67.0% |
-9.9% |
|
|
Driver is (or is suspected to be) intoxicated |
288.7% |
-35.1% |
|
|
Age of driver: 21–24 |
-43.6% |
9.8% |
|
|
Mean probability |
0.159 |
0.841 |
|
Referring to Table 1 and Table 2, seven factors are found to more than double the probability of high severity of single-vehicle injury crashes, where high severity means that at least one of the vehicle occupants suffers fatal or serious injuries, all other things being kept constant. These factors are: Driver is (or is suspected to be) intoxicated, location on the Ring Road along the south coast of Iceland, rock in the roadside, heavy truck involved, steep transverse slope, location on the road Reykjanesbraut (connecting the capital area and the international airport in Iceland), and lastly, a gust of wind or strong wind. One factor, location in ‘Region: East’ in Iceland, almost doubles the probability of high severity of crashes according to the model. Four additional factors, location in ‘Region: Northwest’ in Iceland, old vehicle (≥ 11 years), full-size SUV, and a foreign tourist driver also increase the probability of high severity of crashes, range 67.0%–76.6%, but two factors, winter conditions on road surface and 21–24-year-old driver, decrease the probability of high severity of crashes by 50.8% and 43.6%, respectively.
Discussion
Below, the results of the estimated severity model of single-vehicle injury crashes on state roads in rural areas are discussed and interpreted and, where appropriate, compared to previous research results. Crash research commonly considers driver injury, however, in this analysis, the injuries of all occupants in a vehicle are considered and the most severe injury forms the resulting injury category of the crash. The section is organized into subsections for each of the five groups of explanatory variables in the model, namely, 5.1 Roadside elements, 5.2 Road characteristics, 5.3 Environmental characteristics, 5.4 Vehicle characteristics, 5.5 Driver characteristics.
Roadside elements
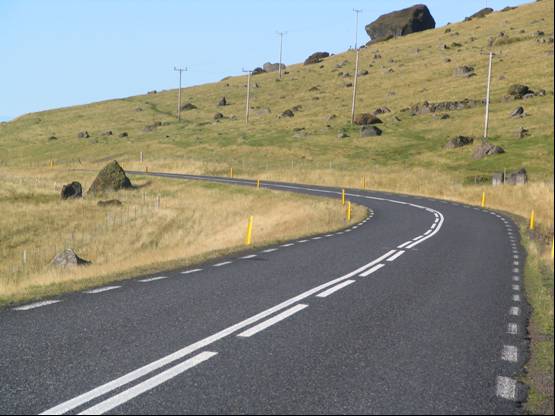
Roadside hazards: Rock
The probability of high severity of a single-vehicle injury crash increases when the vehicle in question hits a rock in the roadside, see Table 1. For an example, see Figure 1. The probability of high severity increases on average by 173%, and the probability of low severity decreases on average by 25%, see Table 2. This finding is in line with Weiss et al. (2014) who found side objects associated with a significant increase in the probability of fatal injuries for both single-vehicle and two-vehicle crashes involving young drivers. Holdridge et al. (2005) do not address standalone rocks in their study on the crash severity impacts of fixed roadside objects. However, they found that large wooden poles (e.g. trees and utility poles) increase the probability of fatal injury when they are hit in crashes. Their study focused on driver injury severity. It could be argued that crashing into a rock is somehow similar to crashing into a large wooden pole.
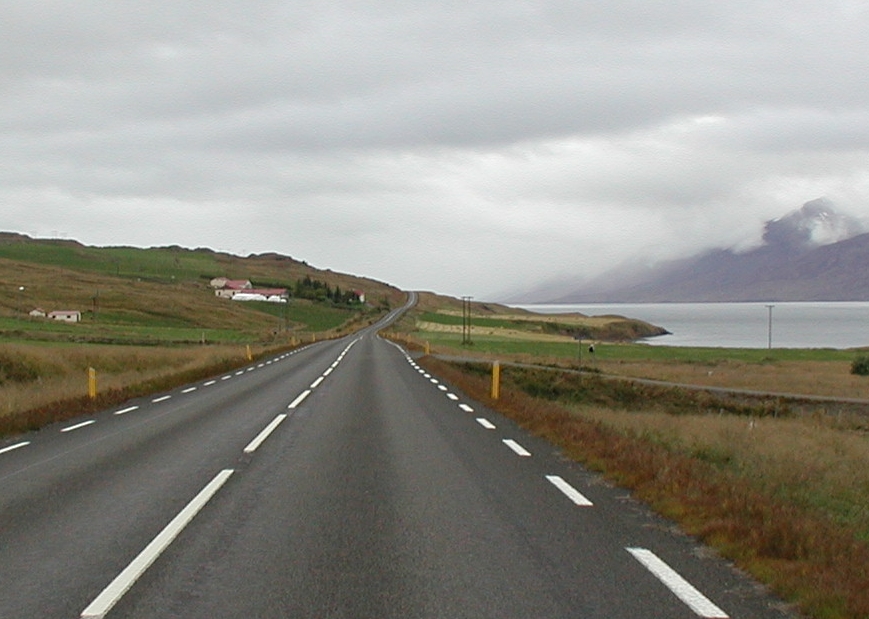
Roadside hazards: Steep transverse slope
When a vehicle crashes into a steep transverse slope, the probability of high severity of a single-vehicle injury crash increases, see Table 1. Figure 2 shows an example of a side road with a steep transverse slope. The probability of high severity increases on average by 124%, see Table 2. This is expected because crashing into a steep transverse slope can be comparable with crashing into an unforgiving roadside object or a wall. Some vehicles that crash into a steep transverse slope get airborne and collide abruptly with the ground. This is consistent with the Roadside Design Guide of the American Association of State Highway and Transportation Officials (FHWA, 2011), where it is described that despite less exposure, transverse slopes are generally more critical than foreslopes or backslopes to errant motorists, because run-off-road vehicles strike transverse slopes head-on.
Road characteristics
Winter conditions on the road surface
Winter conditions, snow, ice, or slush on the road surface decrease the probability of high severity of single-vehicle injury crashes, see Table 1. The probability of high severity decreases by 51% on average, see Table 2. This is in line with expectations because poor road surface conditions are likely to cause drivers to reduce speed. The higher the speed, the probability of serious injuries of vehicle occupants increases (Elvik, 2012). The results are consistent with the findings of Wu et al. (2016), that ice on road surfaces decreased the probability of incapacitating injuries or fatality of drivers in rural single-vehicle crashes by 50.4%. Wu et al. (2016) explain that it is harder for drivers to control vehicles under inferior road surface conditions, making them drive more slowly and carefully relative to normal conditions.
Specific roads: Section of the Ring Road along the south coast
The probability of high severity of a single-vehicle injury crash increases when the crash occurs on the section of the Ring Road (road no. 1), which runs along a considerable part of the south coast of Iceland, see Table 1. On average, the probability of high severity increases by 233%, and the probability of low severity decreases by 30%, see Table 2.
A possible explanation is that this part of the Ring Road mostly goes through lowland areas and includes many straight road sections. In turn, drivers might feel safe driving faster than they should, and a lack of change in scenery might cause inattention or even drowsiness. Some sections of the road are narrow, with limited shoulder widths and the roadsides are in many cases not forgiving. The south coast is a popular tourist route with numerous tourist attractions. A round trip from Reykjavík capital area to one of the most popular attractions, Jökulsárlón, which is a glacier lagoon, takes about 14 hours. Foreign tourists were the drivers in 58.8% of the high-severity single-vehicle crashes on this section of the Ring Road. Perhaps they are tempted to drive faster than is safe and it is also possible that they are tired, e.g. jet lag or a long drive.
Specific roads: Reykjanesbraut
When a single-vehicle injury crash occurs on the road Reykjanesbraut (road no. 41), which runs between the Reykjavík capital area and the international airport in Keflavík, the probability of high severity increases, see Table 1. On average, the probability of high severity increases by 119%, see Table 2. More than 60% of this road is a 2+2 road with grade-separated interchanges and a wide median with a guardrail between driving directions. The speed limit on this road is 90 km/hour, as on other paved rural roads in Iceland, and is not determined by road width, road geometry, roadside features and environment. As a result, it can be argued that some drivers might be tempted to drive faster than permitted. The roadsides along this road are not totally forgiving, it can be reasoned that the road is more dangerous than it appears. Seven of the 41 injury crashes (17.1%) on road no. 41, were classified as high severity crashes, see Appendix A. Six of those were run-off-road crashes and in one crash, a light pole was hit.
Foreign tourist drivers are involved in only two of the 41 injury crashes, or 4.9%. Neither of the two crashes resulted in high severity but it was concluded that the most probable cause of both crashes was connected to driver fatigue. Some foreign tourist drivers are tired after a long flight or a long drive. Drivers living in Iceland are involved in most of the single-vehicle injury crashes on Reykjanesbraut. They may as a group be more likely to consider this road exceptionally good and drive faster than they should. As a result, the impact speed in a crash is higher, increasing the probability of serious injuries of the occupants of the vehicle (Elvik, 2012).
Region: Northwest
The probability of high severity of a single-vehicle injury crash increases when the crash occurs in the Northwest region of Iceland, see Table 1. On average, the probability of high severity increases by 77% when the crash occurs in the Northwest region, see Table 2. Thirteen of the 78 injury crashes (16.7%) occurring in the Northwest region were categorized as high-severity crashes, see Appendix A. Ten of these 13 high-injury crashes occurred on roads other than the Ring Road (road no. 1). Most of these roads are legacy roads with bad geometry and unforgiving roadsides.
Region: East
When a single-vehicle injury crash occurs in the East region of Iceland, the probability of high severity increases, see Table 1. On average, the probability of high severity increases by 99% when the crash occurs in the East region, see Table 2. Twenty-five of the 111 injury crashes (22.5%) occurring in the East region were categorized as high-severity crashes. Because of an extensive change of road numbers in the East region in 2017 it is not possible to comment on the share of the Ring Road (road no. 1) when referring to the severity of crashes. However, long stretches of the roads in the East region are narrow with bad geometry and unforgiving roadsides and increased probability of high severity can be expected.
Environmental characteristics
Gust of wind or strong wind
The probability of high severity of a single-vehicle injury crash increases if there is a gust of wind or strong wind noted as a contributing factor to the crash, see Table 1. On average, the probability of high severity increases by 102%, see Table 2. This result is in line with expectations because wind gusts can occur suddenly and drivers might not have time to react, such as by decreasing speed. This result is consistent with the findings of Lio et al. (2019) and Yasmin et al. (2014), but according to Edwards (1998), the evidence for crash severity in high winds was inconclusive.
Vehicle characteristics
Vehicle type: Heavy truck
When the vehicle in a single-vehicle injury crash is a heavy truck, the probability of high severity increases, see Table 1. On average, the probability of high severity increases by 133%, and the probability of low severity decreases by 20%, see Table 2. This could possibly be explained by the stiffness of the driver cabin not being sufficient (EU, 2023), or safety features such as airbags not being present (CEDR, 2023). Euro NCAP has announced plans for a new truck safety rating scheme (Euro NCAP, 2023). According to the plans, Occupant Status Monitoring (OSM), systems that monitor the status of the driver (e.g. regarding distraction and fatigue), will be added in 2027. In 2030, occupant protection will also be added (Euro NCAP, 2023). In a study by Alogaili and Mannering (2020), the probability of a fatality of a Saudi driver in a single-vehicle crash increased when driving a heavy-duty truck.
Vehicle type: Full-size SUV (Sport Utility Vehicle)
The probability of high severity of a single-vehicle injury crash increases when the vehicle is a full-size SUV, see Table 1. On average, the probability of high severity increases by 67%, see Table 2. This is consistent with the results of Ulfarsson (2003). However, he found that the probability of fatality of a driver in a single-vehicle injury crash in Iceland increases for SUV drivers compared to a passenger car. Ulfarsson (2003) reasoned that SUVs are more likely to roll over than passenger cars, and the structural characteristics of SUVs, in general, are different from what applies to passenger cars; less efficient energy absorption area can be mentioned as an example. This result is also in line with the findings of Gong and Fan (2017), as the outcome of their study indicated that young and middle-aged drivers were associated with a higher probability of being seriously injured or killed when driving an SUV or a van.
Old vehicle (≥ 11 years)
When the vehicle in a single-vehicle injury crash is an old one, 11 years old or older, the probability of high severity increases, see Table 1. On average, the probability of high severity increases by 69%, see Table 2. This aligns with what was expected because newer cars are generally equipped with more safety features. The results are also consistent with the results of Kim et al. (2013), who concluded that the probability of severe injuries increased if the vehicle was 11 years old or older.
Number of vehicle occupants
To account for the effect of the number of vehicle occupants on the results of the estimated injury severity model, a variable with this information was included in the model. Further tests regarding the possible non-linearity effects of this variable were explained in sections 3 and 4 of this article and were not found statistically significant. Hence, the number of vehicle occupants was used as a linear variable.
As expected, the probability of high severity increases when the number of vehicle occupants is greater. This fits the results of Roque et al. (2015) who studied the factors influencing run-off-road crash severity on freeways in Portugal that were not designed in line with the forgiving roadside concept. They estimated models for two outcome variables: the driver injury and the most severely injured occupant, respectively. Among their findings for the latter case was that when the number of vehicle occupants is greater, then run-off-road crashes are more likely to result in a severe or fatal injury to an occupant. Roque et al. (2015) argue that this is expected because more persons may be injured, and the occupants are closer to the vehicle frame, other hard objects, and other occupants.
Driver characteristics
Foreign tourist driver
On average, the probability of high severity increases by 67% when the driver is a foreign tourist compared to a driver living in Iceland, see Table 2. This result is expected in part because it cannot be ruled out that unfamiliarity with the Icelandic road system, e.g. one-lane bridges and sheep grazing close to the road, might cause foreign tourist drivers to drive faster than the conditions allow. Another reason could be that the foreign tourist drivers are tired after long flights and or driving distances, which in turn decreases their alertness.
Driver is (or is suspected to be) intoxicated
If the driver is (or is suspected to be) intoxicated, i.e. under the influence of alcohol or illegal drugs, or even both, it increases the probability of high severity of single-vehicle injury crashes in rural surroundings considerably, see Table 1. On average, the probability of high severity increases by 289% and the probability of low severity decreases by 35% when the driver is under the influence of alcohol and or illegal drugs, see Table 2. This result is expected because an impaired driver is more likely to be reckless and drive at a higher speed, which in turn influences impact speed in crashes (Elvik, 2012) and thereby increases the probability of serious injuries of the driver and/or the occupants of the vehicle.
This result is in line with the outcome of other studies, e.g. Kim et al. (2013), regarding the effect of alcohol, and Wu et al. (2016), who studied contributing factors to driver-injury severity in single-vehicle crashes.
No foreign tourist driver involved in a crash analyzed in this study was (or was suspected to be) intoxicated. The problem of intoxication is limited to drivers living in Iceland. This is, for example, consistent with the results of Wen and Xue (2020), who found that familiar drivers under the influence of alcohol are estimated to increase their probabilities of suffering from serious injuries and fatal injuries when involved in mountainous highway single-vehicle crashes.
Age of driver: 21–24
Drivers in the age category 21–24 have a decreased probability of high severity of single-vehicle injury crashes, see Table 1, compared to older and younger drivers. The probability of high severity decreases on average by 44% when the age of the driver is 21–24, see Table 2. This is what regards the driver, in line with the results of Yasmin et al. (2014) where if a driver is less than 25 years old, it decreases the probability of serious/fatal injury of the driver and, regarding fatal injury, is also consistent with the results of Kim et al. (2013) for the age group 16–24.
A possible explanation is that the physical condition of many drivers in this age group is good. Therefore, they are less likely to suffer serious injuries in car crashes. It might be argued that the passengers of the drivers in question are likely to be of similar age and therefore in good condition as well. In addition, drivers in this age group are likely to have gained more driving experience than those aged 17–20.
Conclusions
Nine roadside elements were tested in the model (see Appendix A). Two of them, rocks in the roadside and steep transverse slopes, existing at many places where access roads enter main roads, turned out to be significant. Both elements more than double the probability of high severity of single-vehicle injury crashes on rural roads, where high severity means that at least one of the vehicle occupants suffers fatal or serious injuries, all other factors being kept constant. Improvements to these roadside elements often cost relatively little. This knowledge helps prioritize projects on improving roadsides to make them more forgiving.
An important point regarding the benefits of measures aimed at making roadsides more forgiving is that such improvements can often go unnoticed by road users. Therefore, it is unlikely that road users will adapt their behavior, e.g., increase their driving speed, and thereby outweigh the safety benefits of the measures.
Improved and additional data coding of the roadside elements, which might threaten road safety, and, where applicable, measuring and coding the perpendicular distance from the road edge to the dangerous roadside element, is essential to enable research into the effects of these elements on traffic safety. Special data fields in police reports for these issues would make it generally possible to evaluate the effects of roadside elements on road safety.
To strengthen the analysis of the contribution of roadside elements to the severity of run-off-road crashes and to monitor the effects of improvements in the future, it is therefore recommended that additional information on roadside elements be coded and added to the standard police record crash data.
The results also revealed five other contributing factors, which more than double the probability of high severity of single-vehicle injury crashes on rural roads. Those are: Driver is (or is suspected to be) intoxicated, location on the Ring Road along the south coast of Iceland, heavy truck is involved, location on the road Reykjanesbraut (a road connecting Reykjavík capital area and the international airport in Iceland), and a gust of wind or strong wind. Driver intoxication (or suspected intoxication) increases the probability of high severity of single-vehicle injury crashes in rural surroundings considerably. This is expected and found elsewhere, but it is noteworthy that the problem of intoxication (or suspected intoxication) is here limited to drivers living in Iceland. Not a single foreign tourist driver was involved in single-vehicle injury crashes associated with intoxication (i.e. under the influence of alcohol or illegal drugs).
Funding
No external funding was used in this research.
Declaration of competing interests
The authors report no competing interests.
Ethics statement
The data processing in this study was approved by the Icelandic Data Protection Authority in decisions dated 18 January 2017, and 25 January 2019.
CRediT contribution statement
Audur Th. Arnadottir: Conceptualization, Data curation, Formal analysis, Investigation, Methodology, Project administration, Validation, Visualization, Writing—original draft, Writing—review & editing.
Gudmundur F. Ulfarsson: Conceptualization, Formal analysis, Methodology, Supervision, Writing—review & editing.
Sungyop Kim: Formal analysis, Supervision, Writing—review & editing.