Identification of hazardous road locations using ambulance data
Abstract
Background
Police underreporting of traffic crashes is a substantial challenge in Denmark, as in many other countries. Alternative data sources are highly warranted for site-specific road traffic safety work. This study aimed to test the potential benefits and drawbacks of a merger of ambulance data, including crash coordinates, and hospital patient data.
Methods
We tested a definition of a traffic crash based on a merger of hospital patient data and ambulance data, including prehospital medical records information and ambulance coordinates in Aalborg Municipality in the North Denmark Region of Denmark from 2016 to 2019 and presented a method of identification of hazardous intersections, road sections and local traffic areas. We compared selected police data characteristics for the same area and period.
Results
Compared to police data in the same study period, we found 3.2 times as many unique crash sites through the use of combined hospital patient and ambulance data. We showed that as many as 47% of the crash sites found in the ambulance records were located outside the network of major roads, whereas 16% were located at intersections of major roads and 38% on sections of major roads. We found a certain imprecision in the identification of crash locations because some crash coordinates were physical addresses of buildings only close to the crash sites. Furthermore, we noted that the data privacy of patient data is an issue.
Conclusions
Ambulance data have clear-cut potential in site-specific road traffic safety work. However, data quality assurance is necessary prior to the application of the data for black spot identification. As such, more precise coordinates are needed, as well as further methodological development and an anonymisation procedure legally approved by the authorities to make data available for traffic safety work operations.
1. Introduction
Knowledge of the exact location of traffic crashes is essential in site-specific road traffic safety work. Hazardous road locations or ‘black spots’ are locations on the road network, intersections, roundabouts and road sections where crashes tend to cluster. There can be one or more contributory factors to a hazardous location, and new crashes may be prevented by eliminating these factors.
Hazardous road locations are traditionally identified using police crash data registered by the police at the crash site. However, the police are not present in all crash cases, and they often only register car crashes, which may result in an overrepresentation of these compared to underreported pedestrian falls and bicycle-related crashes (Olesen, Madsen, et al., 2021; Olesen, Petersen, et al., 2021). This discrepancy affects policymakers as car infrastructure is prioritised and rebuilt at the expense of vulnerable road users (VRUs). In particular, the prevention of single crashes among VRUs is overlooked.
Alternative crash data comprising crash coordinates are warranted. Some Danish hospitals report coordinates of traffic crashes when they treat patients injured in traffic crashes. All Danish hospitals are obliged to record the type of traffic area and the means of transportation for patients involved in a traffic crash. A small study from Odense documented that the location of 69% of trauma centre cases could be determined by combining hospital occurrence and ambulance pick-up data (Danielsson et al., 2016).
Another possible data source is ambulances. Danish ambulance data include coordinates and the prehospital medical report, which details the causes for calling the emergency number, injury conditions and equipment related to traffic crashes.
1.1. Literature review
A previous Danish study identified all 4,563 cyclist crashes between 2014 and 2017 in the municipality of Copenhagen (Berg & Augustsson, 2018) based on ambulance data. GIS analysis was used to define clusters of crashes within 25 meters of each crash. The study found that ambulance data may identify hazardous locations with the most serious cyclist crashes, but data quality needs to be assured specifically the quality of GPS coordinates. Similar studies that include ambulance coordinates have been carried out in Norway (Vivento AS & Agenda Kaupang AS, 2015), Canada (Morency et al., 2012; Morency & Cloutier, 2006), Iran (Shabanikiya et al., 2020) and Malaysia (Rahman et al., 2016). The Norwegian project identified approximately 1% of all ambulance runs as traffic related. The coordinates of these runs were mapped onto the road network and the road authorities sought to identify hazardous road locations in attempts to use public registries for traffic safety purposes. The Canadian study from 2006 aimed at locating intersections and road sections on the Montreal Island with clustering of pedestrians involved in multiparty crashes through a search of ambulance data in a five-year period. This Canadian project identified 22 serious black spots with more than eight clustered pedestrian crashes in the central parts of Montreal. Based on this alternative black spot identification using ambulance data, Morency and Cloutier suggested that more resources should be used for prevention of crashes involving vulnerable road users. In 2012, Morency et al. estimated crash rates of various types of local areas in Montreal. The crash rate was calculated as the number of crashes divided in an area by the number of square metres of the area type. Afterwards the area types were ranked. Based on this work, Morency et al. (2012) found that freezing rain causing slippery road surfaces is particularly dangerous for vulnerable road users. The Canadian research group has also worked with use of ambulance data in crash models for cyclists and pedestrians. Two other studies have used ambulance data coordinates for identification of hot spots of crashes. An Iranian study by Shabanikiya et al. (2020) identified hot spots through use of GIS tools of pedestrian crashes whereas the Malaysian study by Rahman and colleagues (2016) made heat maps on basis of merged crash data from emergency rooms and ambulances both for all road users and specifically for children and youth.
Attempts to make use of ambulance data on a permanent basis have been made in Norway and Denmark. However, the Norwegian project ended in 2017 (Vivento AS & Agenda Kaupang AS, 2015), whereas the Danish project stopped in 2023 (to our knowledge, without being reported).
1.2. Study aim
Danish hospitals register around ten times as many injuries after road crashes compared to police-registered road crashes, which are currently used in site-specific road safety work (Olesen et al., 2019). However, hospital registrations do not currently contain records of where the crash occurred, and therefore hospital registrations cannot be used in the road authorities’ important site-specific road safety work.
However, many of the injured arrive at hospitals by ambulance, and data from these ambulances shows where the patient - in this case the injury after road crashes - is picked up.
The aim of this study was to investigate how large a proportion of hospital-recorded crashes can be mapped in this way, but also to investigate whether there are patients brought to hospital by ambulance after a road traffic crash that are not registered as a road traffic crash at the hospital but are only in ambulance data. Finally, the goal was to see if these now mapped hospital-recorded crashes give a different picture of the hazardous road locations - both where the crashes occur, and which road user groups are involved.
The goal was to develop a method that can allow a larger proportion and a more accurate distribution of road user groups to be included in the site-specific road safety work - in practice, a larger proportion of crashes involving vulnerable road users and compare the results with a site-specific road safety work based on police-recorded crashes.
2. Materials and methods
2.1. Study population
We included all patients who called the national emergency number requesting an ambulance to an address within the municipality of Aalborg in the North Denmark Region (appr. 221,000 inhabitants, with 144,000 citizens in the city of Aalborg) from 2016 to 2019. All hospital contacts related to a traffic crash in the same municipality (Aalborg University Hospital) and period were included as well.
2.2. Ambulance data source
When you call the national emergency number (112) in Denmark, the police will answer the call. If it is of a medical nature, they will forward it to an Emergency Medical Coordination Centre, where a healthcare professional answers the call. The healthcare professional assesses its urgency and severity using a criteria-based decision support tool, the Danish Index for Emergency Care (Andersen et al., 2013; Danish Regions, 2022). This contains 37 symptoms and situations with subcategories and recommended response levels. The Danish Index for Emergency Care category and logistic data concerning ambulance dispatch, such as type of unit and coordinates, are stored in a logistic dispatch system at the Emergency Medical Coordination Centre.
All Danish ambulances use the same electronic prehospital medical record, which contains patient information, observations and treatments related to the situation. Note text fields are available, although they are not routinely used or required for documentation. Similar to a logistic system, the electronic prehospital medical record also contains the Danish index for emergency care category and coordinates.
Data from the 112 calls, the logistic dispatch systems and the prehospital medical record will be collectively referred to as ‘ambulance data’ henceforth to aid readability.
Coordinates in ambulance data may include the location of the caller, a physical address or manually recorded coordinates by the police or healthcare professionals.
From the ambulance data, we retrieved the time and date of incident, main cause for calling the emergency number, coordinates, injury-related information of the patient and equipment used (deployed), trauma mechanisms and text in the notes field.
2.3. Hospital patient data source
All patients with a hospital contact in Denmark receive a diagnosis according to the International Statistical Classification of Diseases and Related Health Problems (10th Revision), as well as administrative codes for procedures and descriptions.
We retrieved the time and date of arrival, ICD-10 diagnosis, registration of related traffic area location and registered means of transportation from the regional patient administrative system.
An injury severity score was calculated from ICD-10 diagnoses for hospitalised patients. We considered the following types of injuries as serious: fractures, major lesions, internal lesions, nerve damage, amputations and certain other lesions resulting in major symptoms, e.g. concussions (Melchiorsen et al., 2024).
2.4. Combined dataset
In Denmark, all contacts with public services, including hospitals, use a unique personal identification number. Among other things, this enables the linkage between registries and data sources. As such, ambulance data and hospital patient data were combined.
We defined patients involved in a traffic crash as either 1) those who had traffic crash as the main cause for contacting the emergency number according to the Danish index, 2) those whose registration in the prehospital medical record was related to traffic crashes or 3) ambulance patients brought to a hospital and registered there as having been involved in a traffic crash according to the regional patient administrative system (See Figure 1). We included pedestrian falls in our definition of a traffic crash even though it is not considered as such in the official Danish statistics.
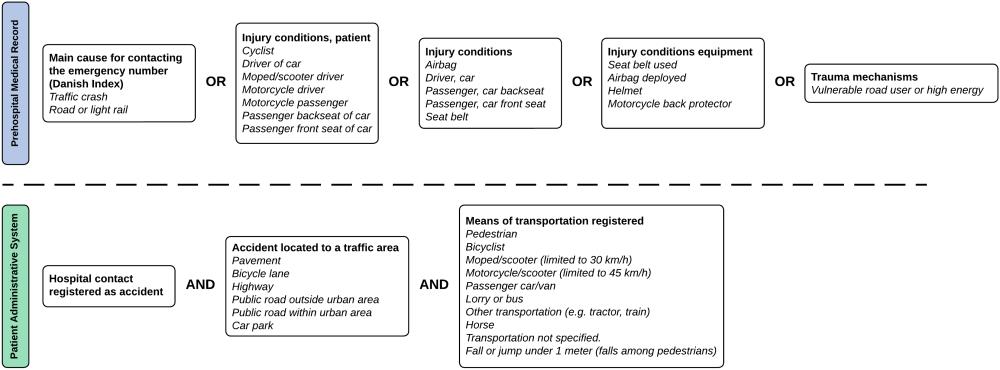
The definitions 1)-2) based on the prehospital medical records were evaluated through this project whereas definition 3) based on the hospital patient data was from another project (Olesen et al., 2019). The included variables (above the dashed line in Figure 1) used to define a traffic crash were determined following an initial manual review of the prehospital medical records and subsequent revisions of the definition. We first classified all ambulance runs into three groups: highly likely traffic crashes, probable traffic crashes and probably not traffic crashes. Then a review of 1,800 randomly selected prehospital medical records in the three groups (600 highly likely, 400 probable and 800 probably not traffic crashes) by two traffic researchers was used to form the definitions 1)-2) above. The two traffic researchers assessed whether an ambulance was sent to a true traffic crash or not, and subsequently, their concordance was evaluated using Cohen’s kappa coefficient. In cases of systematic discrepancies, the researchers evaluated and refined the definitions. After agreement on the definitions, we calculated the percentage of true traffic crashes in each of the three groups (see Results’ section).
After combining the ambulance and hospital patient data, we reassessed our definition of a traffic crash in the merger through a review of the data of 100 randomly selected ambulance runs to defined traffic crashes. A traffic researcher read all available data and evaluated whether or not runs were for a true traffic crash.
We retrieved data from the Danish police records of injured persons in traffic crashes in Aalborg Municipality in the period from 2016 to 2019. These data were compared with the combined ambulance and hospital data with regard to gender, age group, and road user type. No formal statistical tests were performed due to dependencies in data because most police recorded injuries require an ambulance.
2.5. Map matching of crash coordinates
As explained above, the crash coordinates were registered in three different ways. Unfortunately, the specific type of the coordinate was not recorded in the data. Because not all the coordinates were actual crash sites and could instead be addresses of nearby buildings, we matched the registered coordinates to a map of the road network according to some rules. Through reassurance of the combined data, all unique crash sites were identified. Thus, in cases where several ambulances were present at one crash site (same location, date and time), only one set of crash coordinates and crash circumstances was retrieved for final analysis. The roads were divided by traffic function into main roads (major roads and distributor roads) and local traffic areas, which are the remaining roads between major roads. Next, the major roads were divided into intersections and sections, where intersections are all intersections at which three or more major roads meet, and sections are the major roads between two intersections.
For each major road, all crashes that occurred within 30 meters were projected onto it by the shortest distance. Crashes within a certain radius from the centre of intersections (distance between the intersection centre and the most distant start of a turning lane) were connected to that intersection. The remaining crashes were map-matched to the local traffic areas.
2.6. Black spot identification methodology
In this study, the identification of hazardous road locations or black spots took place using the method described in a 2005 thesis (Madsen, 2005). This method ranks intersections and road sections in two steps. The first ranking is based on crash density, in which intersections and sections with the highest crash densities are selected. Then the traffic volume–controlled crash rate is estimated for each of the selected locations. Then as the second step, a new ranking is created based on crash rate, and the locations with the highest crash rates are defined as black spots for intersections and road sections. This is a common approach in Denmark and is a rather simple practical method for finding black spots that implicitly controls for traffic volume after selecting hazardous locations with many crashes. The formulas for the crash densities (CDs) of intersections and road sections based on data from a specific range of years are as follows:
The formulas for the crash rates (CRs) of intersections and road sections are provided below:
We estimated the crash density (CD) of local traffic areas using the following formula (Morency et al., 2012):
The local traffic areas were ranked in the same way as intersections and road sections and were termed ‘black areas’.
2.7. Ethics
In Denmark, legislation demands patient consent to access medical records or to have medical records provided. When it is not possible to obtain patient consent, according to Danish legislation, the Danish Patient Safety Authority may waive this requirement and approve the handover of specific data from patient medical records. This was the case for this study, where the Danish Patient Safety Authority approved the handover of data from the prehospital medical records for the study (ID number 31-1521-254). According to Danish legislation, no further approval (e.g. by ethics committee) was required.
2.8. Statistical analyses
We used the chi-squared test for comparisons of number of crashes variables and applied a significance level of 5%. As mentioned above, we also estimated Cohen’s kappa coefficient as a measure of interrater reliability (concordance) (Kirkwood & Sterne, 2003).
2.9. Qualitative evaluation of the data reassurance process
In the work with data, we estimated the average time consumption used for the identification of each crash location. Furthermore, we qualitatively monitored the process and noted and discussed subsequent problems to be solved before deployment into a national traffic safety system in municipalities.
3. Results
Initial reviews of 1,800 prehospital medical records were used to determine the definition of a traffic crash in ambulance data. The first assessment by two traffic researchers of 600 ambulance runs classified as highly likely traffic crashes revealed a Kappa coefficient of 0.88, which can be interpreted as very satisfactory concordance. Discussions on the lack of concordance and a renewed review led to the finding that 86% of the highly likely traffic crashes were true traffic crashes, whereas 14% were not. We decided to restrict our focus to ‘highly likely’ traffic crashes defined as depicted in Figure 1, thus forgoing the data on ambulance runs from classes of ‘probable’ (8% true traffic crashes and kappa coefficient of 0.96) and ‘probably not’ traffic crashes (0.3% true traffic crashes and kappa coefficient of 0.53) because the prevalence of true traffic crashes in these classes was low. Concludingly, discarding the ‘probable’ and ‘probably not’ traffic crashes from consideration.
The subsequent merger of ambulance data and hospital patient data provided us with data on 3,358 ambulance runs to traffic crashes in the four-year period between 2016 and 2019. Figure 2 shows the result of the merger, where sets A–D comprise the union of traffic crashes with crash coordinates obtained through ambulance data (except for 132 crashes that occurred before 1 February 2016 when the registering of coordinates was initiated). Subgroup A comprises injured persons who were brought to hospital by an ambulance and classified as traffic injured in the hospital but not in the prehospital medical record. Subgroup B is the intersection of traffic-injured patients classified as such in both data sources. Subgroup C includes persons who were classified as traffic injured in the prehospital medical record and brought to hospital with an ambulance but not classified as injured in traffic in the hospital records. Subgroup D comprises persons to whom an ambulance was sent out but not transported to the hospital.
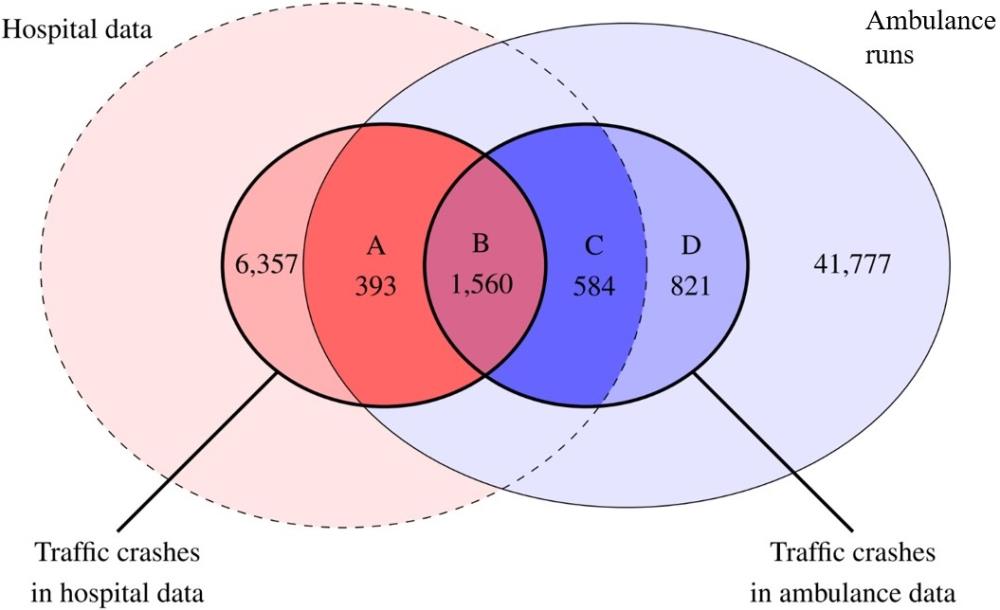
Through this merger, crash coordinates were obtained for 24 % ((393+1,560)/8,310) of all traffic crashes in hospital patient data. Hospital patient data in Denmark typically do not include crash coordinates, except in limited areas of the country. The merger of data sources in Figure 2 shows that 7.4% ((393+1,560+584+821)/(393+1,560+584+821+41,777)) of ambulance runs were identified as traffic crashes defined through one of the sources or both. There were relatively many traffic crashes registered in the emergency room (n = 6,357) that were not connected to an ambulance run. These could possibly be cases of referrals between hospitals, treatment of traffic crashes in which the patient approached the emergency unit by themselves without an ambulance. Or instances in which the patient had an ambulance run in another municipality but was subsequently treated at Aalborg University Hospital (no data access implying that the distribution is unknown). We aimed to characterise subgroups A–D to explain their differences. Patients in subgroup D were not treated in the emergency room for the following reasons: the patient had died at the crash scene, the patient refused transport to the hospital or the patient did not require hospital treatment. Patients in subgroup C were transported by ambulance for treatment in the emergency room, but their cases were not registered as traffic crash related. However, cases under subgroup C may still have information regarding road user type from the ambulance data. Table 1 depicts the distribution of road user type overall and by subgroup, and the statistically significant differences between the subgroups (p < 0.001) are evident, such as in the disproportionate number of people injured in cars and vans. Table 1 shows that the proportion of vulnerable road users is relatively high in subgroup A, which contains ambulance runs of patients whose cases were only registered as traffic crashes in the emergency room. The proportion of car/van drivers and passengers is small in subgroup A, whereas in subgroup B, this group constitutes half of the patients and the next largest group was cyclists which constituted one-third of the group. There were many car/van drivers and passengers in subgroup C as well, but approximately half of the patients lacked information on road user type. Of the known case types in subgroup D, the majority were car/van drivers and passengers.
| Road user type | A N (%) |
B N (%) |
C N (%) |
D N (%) |
Total N (%) |
| Pedestrian* | 143 (36%) | 83 (5%) | 8 (1%) | 0 (0%) | 234 (7%) |
| Cyclist | 154 (39%) | 456 (29%) | 104 (18%) | 24 (3%) | 738 (22%) |
| Moped driver | 28 (7%) | 110 (7%) | 16 (3%) | 7 (1%) | 161 (5%) |
| Motorcyclist** | <5 | 62 (4%) | 19 (3%) | 9 (1%) | 92 (3%) |
| Car or van driver** | 42 (11%) | 831 (53%) | 131 (22%) | 277 (34%) | 1,281 (38%) |
| Truck or bus driver** | 13 (3%) | 8 (1%) | <5 | <5 | 21 (1%) |
| Other vehicle type | 7 (2%) | <5 | <5 | <5 | 10 (0%) |
| Unknown type | <5 | <10 | 306 (52%) | 504 (61%) | 821 (24%) |
| Total | 393 (100%) | 1,560 (100%) | 584 (100%) | 821 (100%) | 3,358 (100%) |
3.1. Comparison with police-recorded traffic injuries
We compared the gender, age, and road user type distributions of patients in the 3,358 ambulance runs with the 963 police-recorded injured in traffic crashes in the same geographic area and period (Tables 2-4). Relatively more males were treated in ambulances than females whereas the gender gap in police data was smaller. However, the most striking fact is the relatively high percentage of patients in ambulances with missing gender and age (Table 3). This information was missing because many patients in group D were not registered by their personal identification number which comprises birthday and registered gender. The age distributions were relatively similar.
| Gender | Ambulance data N (%) |
Police recorded traffic injuries N (%) |
| Female | 1,356 (40%) | 442 (46%) |
| Male | 1,701 (51%) | <520 |
| Unknown | 301 (9%) | <5 |
| Total | 3,358 (100%) | 963 (100%) |
| Age group | Ambulance data N (%) |
Police recorded traffic injuries N (%) |
| 0-14 | 190 (6%) | 48 (5%) |
| 15-17 | 114 (3%) | 48 (5%) |
| 18-24 | 632 (19%) | 238 (25%) |
| 25-44 | 843 (25%) | 280 (29%) |
| 45-64 | 790 (24%) | 251 (26%) |
| 65-74 | 280 (8%) | 60 (6%) |
| 75+ | 219 (7%) | <40 |
| Unknown | 290 (9%) | <5 |
| Total | 3,358 (100%) | 963 (100%) |
| Road user type | Ambulance data N (%) |
Police recorded traffic injuries N (%) |
| Pedestrian* | 234 (7%) | 86 (9%) |
| Cyclist | 738 (22%) | 216 (22%) |
| Moped driver | 161 (5%) | 53 (6%) |
| Motorcyclist** | 92 (3%) | 59 (6%) |
| Car or van driver** | 1,281 (38%) | 526 (55%) |
| Truck or bus driver** | 21 (1%) | 15 (2%) |
| Other vehicle type | 10 (0%) | 8 (1%) |
| Unknown type | 821 (24%) | |
| Total | 3,358 (100%) | 963 (100%) |
In Table 4, the distributions of road user type in both ambulance data and police data are found. Information on this characteristic is missing in a total of 24% of the ambulance runs while no lack of information is seen in the police-recorded traffic injuries. The missing problem occurred primarily in groups C and D cf. Table 1. Removing the unknowns and recalculating percentages, leaves one with similar distributions regarding road user type. The data comprised date and time of the injuries and those variables were also very similar in ambulance and police data.
3.2. Misclassification of traffic crashes
Because some of cases identified as traffic crashes in the merger of the data from the two sources (ambulance and hospital data) could be misclassified due to registration errors, we assessed the legitimacy of the definition by reading the notes fields of a random sample of 100 defined traffic crashes. Table 5 summarises the results of this assessment and presents a count of empty case notes and case notes without any traffic-related information.
| Assessment based on case notes | A | B | C | D | Total |
| Yes, traffic crash | 11 | 46 | 11 | 8 | 76 |
| No, not a traffic crash | 1 | 3 | 4 | ||
| Crash with horse | 2 | 2 | |||
| Mountain bike crash | 1 | 1 | |||
| No case note | 14 | 14 | |||
| No traffic info in the note | 1 | 2 | 3 | ||
| Total | 11 | 47 | 17 | 25 | 100 |
The assessment revealed that only 7% were clearly not traffic crashes (horse ‘crashing’ with no vehicle involved, mountain bike crash outside a conventional traffic area, and four cases that were clear errors after reading the case notes). The remaining 93% were traffic crashes based on the definition from the registries, but 17% could not be confirmed by the case notes due to the lack of (traffic) information. Concludingly, we also keep the approximately 7% misclassified crashes in the black spot analysis aware of the error as an operational approach.
3.3. Results of black spot identification
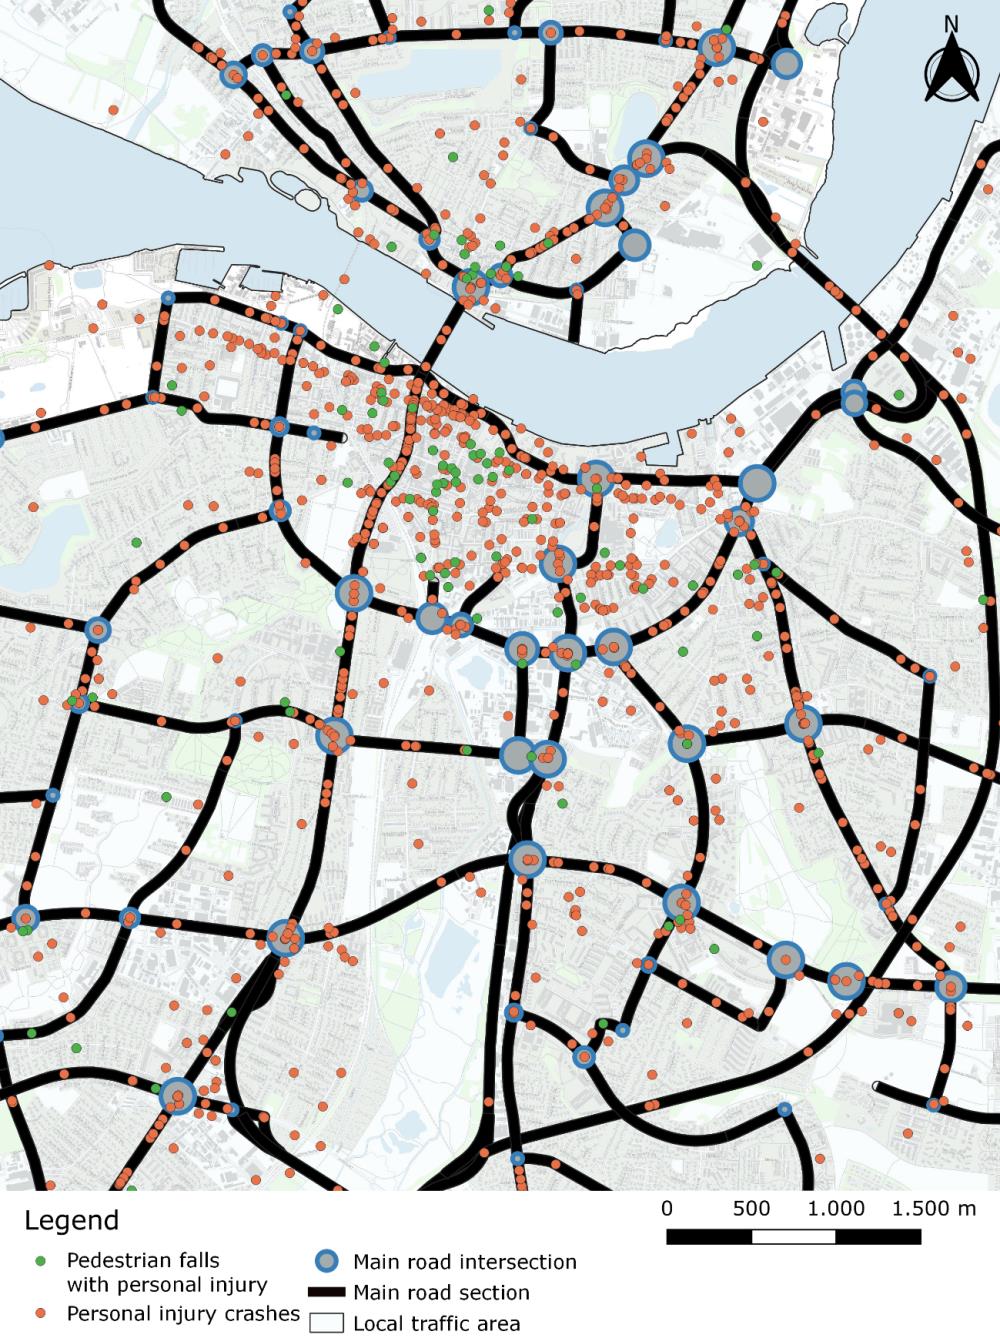
We identified 2,466 unique crash locations among the 3,358 ambulance runs, since for many traffic crashes, more than one ambulance was requested. Technically, we merged calls whose sites were less than 10 meters apart on a similar date with close occurrence times. The identified crash coordinates were spread out in all of Aalborg Municipality, as shown in Figure 3. By ‘personal injury’, we mean an injured person in a traffic crash or pedestrian fall. Figure 4 zooms in on the city centre of Aalborg. Pedestrian falls are marked in a separate colour, since single falls are not traffic crashes according to the official Danish definition (requires at least one wheeled vehicle involved, including bicycles). Figure 4 also shows the network of major roads (heavy black lines) in Aalborg, along with intersections between major roads (blue circles).
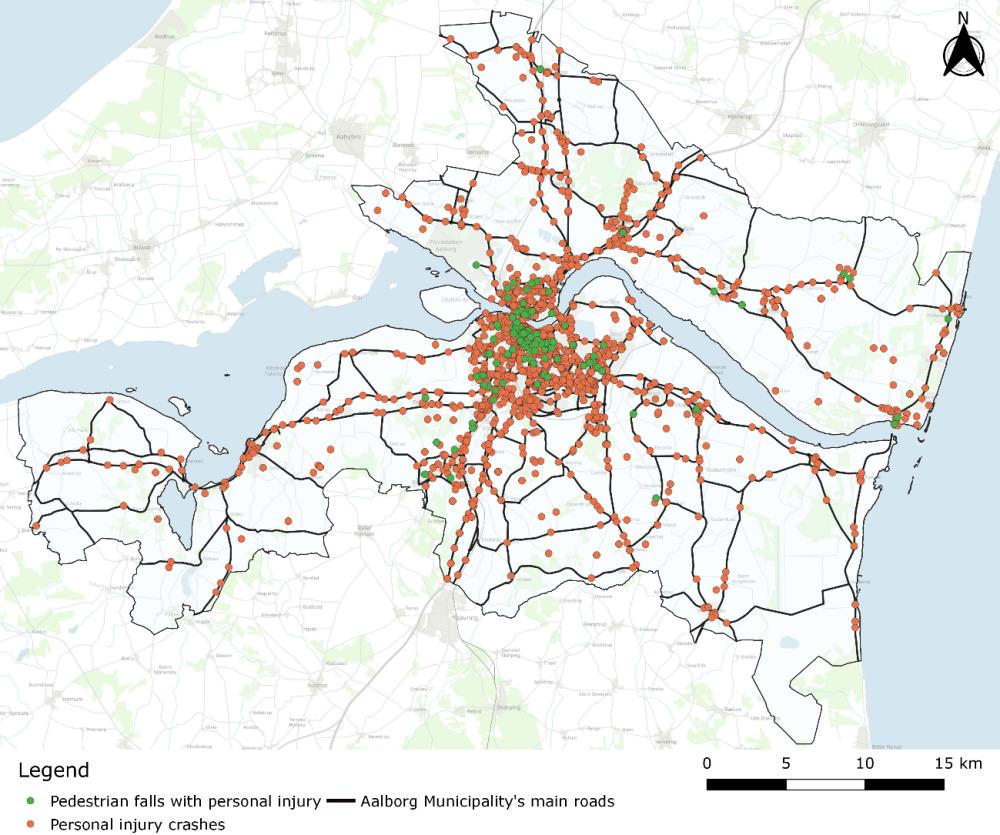
Of the 2,466 unique crash locations, 387 (16%) occurred at intersections of major roads, 928 (38%) occurred on major road sections, and the remaining 1,151 (47%) occurred in local traffic areas limited by the major road network. For comparison, we extracted data of crashes with personal injury in police data for the same period from 2016 to 2019 and found a total of 768 unique crash sites within the borders of Aalborg Municipality and thus 3.2 times more crash sites in the ambulance data compared to police data.
Through the hazardous location identification process described in the Methods section, we located nine hazardous intersections between major roads, 12 hazardous major road sections, and 14 hazardous local traffic areas. We used various cut-offs for the three types of road infrastructure, with the overall aim of obtaining a manageable number of black spots and areas. Thirty-one intersections were selected with a cut-off point of more than four crashes. After applying a crash density cut-off of more than 1.5 crashes per year, 19 intersections remained, and after applying a crash rate cut-off of 0.15 crashes per one million vehicle kilometres, nine hazardous intersections were identified. The corresponding cut-off points for major road sections were more than four crashes (76 sections selected), crash density above two crashes per year (36 sections left), and crash rate of more than one crash per million vehicle kilometres (12 black sections).
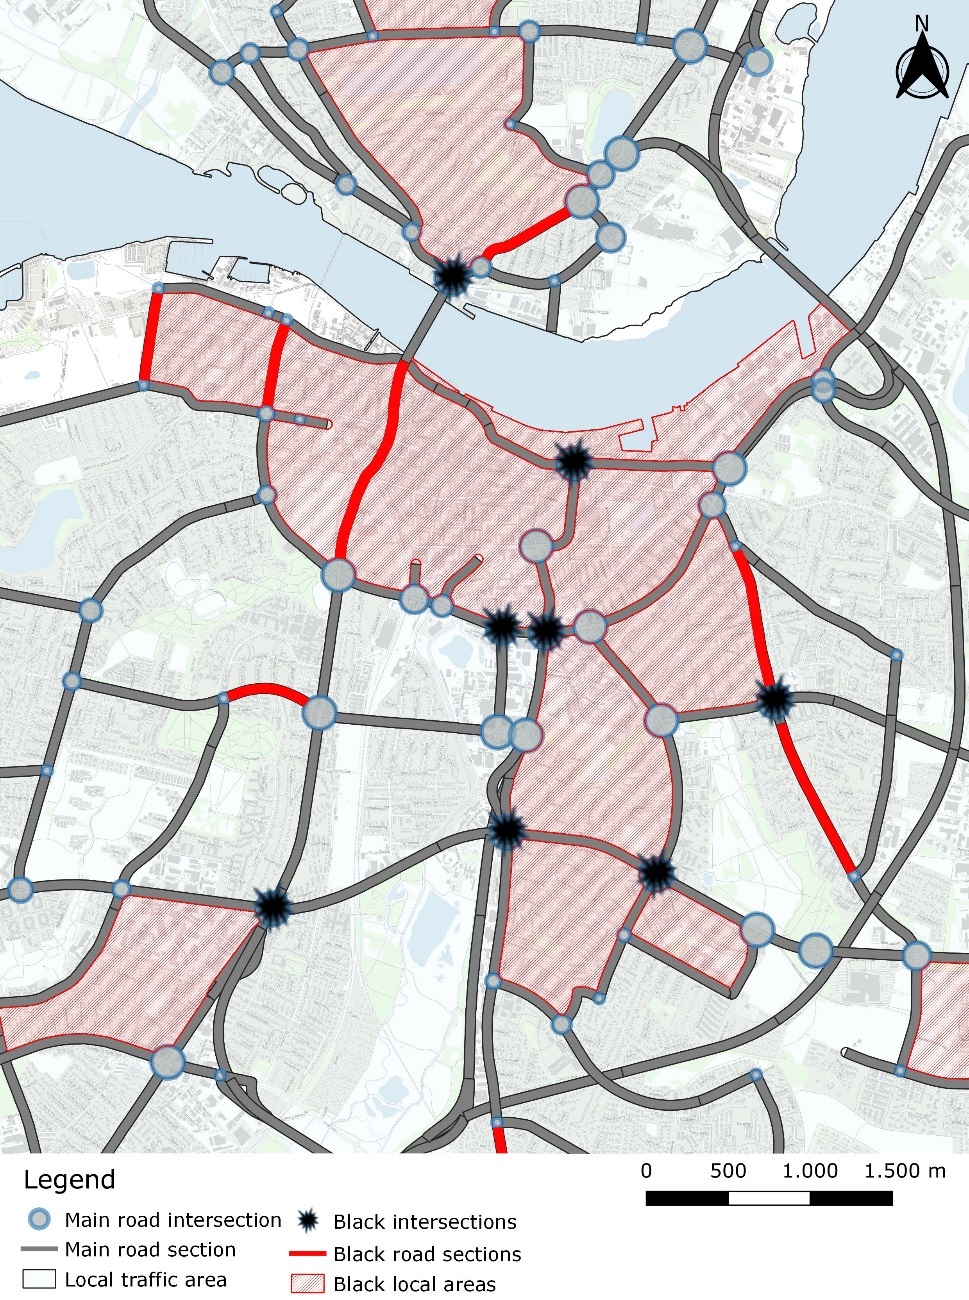
The black area identification was a bit different. Here, we first excluded local traffic areas with less than 10 crashes, which resulted in 33 local traffic areas for further consideration. Selection based on a crash density of more than three crashes per square kilometre made us select 14 black areas. Figure 5 shows the black intersections, black road sections and black areas in the city centre of Aalborg.
3.4. Characteristics of black spots
The identified black or hazardous intersections of major roads were all large and congested locations with heavy traffic volumes, and most of them were well known in the traffic safety work of the municipality. All identified black major road sections, except one, were parts of roads with large traffic volumes (of motor vehicles). The 14 identified black local areas are all situated in the city centre of Aalborg, with large volumes of pedestrian and cyclist traffic.
In Table 6, we provide an overview of the distribution of road user type by crash location traffic area type. In multiparty crashes, the road user type was determined at random among the involved parties in the dataset. Table 6 shows that local traffic areas differed from the major roads and intersections between them in terms of frequency of crashes with pedestrians and cyclists (p < 0.001). In local traffic areas, there were relatively fewer car and van crashes and more crashes with unknown road user type.
| Road user type | Major road intersections N (%) |
Major road sections N (%) |
Local traffic areas N (%) |
Total N (%) |
| Pedestrian* | 27 (7%) | 58 (6%) | 143 (12%) | 228 (9%) |
| Cyclist | 109 (28%) | 223 (24%) | 385 (33%) | 717 (29%) |
| Moped driver | 27 (7%) | 47 (5%) | 82 (7%) | 156 (6%) |
| Motorcyclist** | 13 (3%) | 27 (3%) | 40 (3%) | 80 (3%) |
| Car or van driver** | 145 (37%) | 438 (47%) | 210 (18%) | 793 (32%) |
| Truck or bus driver** | <5 | <5 | 13 (1%) | 17 (1%) |
| Other vehicle type | <5 | <5 | 7 (1%) | 10 (0%) |
| Unknown type | 62 (16%) | 132 (14%) | 271 (24%) | 465 (19%) |
| Total | 387 (100%) | 928 (100%) | 1,151 (100%) | 2,466 (100%) |
Nine hundred twenty-five of the 2,466 unique crashes (38%) involved road users who sustained serious injuries and were subsequently brought to a hospital. Table 7 shows the distribution of road user type by traffic area for these unique crashes with serious injury, which exhibited statistically significant differences (p < 0.001). Relatively more pedestrians, much less car and van drivers and (again) more cases with unknown road user type in the local traffic areas were the predominant differences compared to the major roads and intersections. Finally, attention must be paid to the gross numbers of crashes in the three types of traffic areas: 136 (15%) at intersections between major roads, 281 (31%) on major road sections and 508 (55%) crashes with serious injury in local traffic areas.
| Road user type | Major road intersections N (%) |
Major road sections N (%) |
Local traffic areas N (%) |
Total N (%) |
|
| Pedestrian* | 10 (7%) | 28 (10%) | 76 (15%) | 114 (12%) | |
| Cyclist | 53 (39%) | 109 (39%) | 197 (39%) | 359 (39%) | |
| Moped driver | 15 (11%) | 21 (7%) | 45 (9%) | 81 (9%) | |
| Motorcyclist** | 6 (4%) | 14 (5%) | 19 (4%) | 39 (4%) | |
| Car or van driver** | 30 (22%) | 91 (32%) | 54 (11%) | 175 (19%) | |
| Truck or bus driver** | <5 | <5 | <10 | <10 | |
| Other vehicle type | <5 | <5 | <5 | <5 | |
| Unknown type | 19 (14%) | 17 (6%) | 109 (21%) | 145 (16%) | |
| Total | 136 (100%) | 281 (100%) | 508 (100%) | 925 (100%) | |
As stated in the Methodology section, the crash coordinates in the dataset were derived by one of three different methods, including for example the address of the nearest house. A manual assessment was therefore necessary to determine the best estimate of the accident coordinates. The time consumption needed for this data reassurance before black spot identification can be estimated to be 5 minutes per each of the approximately 840 annual ambulance runs to traffic crashes, which translates to 70 employee-hours per year. The ambulance personnel did not use extra time than the efforts already made in registering the runs.
It should be added that our project to link prehospital data with hospital patient data has received a researcher licence from the Danish Patient Safety Authority. This also means that if this method is to be lifted from research to regular operations, there are privacy issues to be resolved that may necessitate a change in legislation.
4. Discussion
This study demonstrated how patient records from ambulances and position data from ambulances, as a relatively new source of traffic crash information, can be used in traffic safety work performed by road authorities. In Aalborg Municipality, we found 3.2 times more unique crash sites in ambulance records than in police data for the same period from 2016 to 2019, which clearly shows the potential of ambulance run records for the identification of hazardous locations on the road network. We argue that since police crash data are underreported, new data sources are necessary to gather information on crashes of vulnerable road users, as well as data on traffic crashes outside the network of major roads. We showed that approximately 47% (1,151 of 2,466) of the crash sites found in the ambulance records were located outside the network of major roads, whereas 16% were at the intersections of major roads and 38% were on sections of major roads. The identified hazardous locations among intersections of major roads were all large intersections with high traffic volumes that were well known from police data. Almost all the black sections of major roads were also parts of major roads that had high traffic volume and thus a greater likelihood of traffic conflicts and eventually crashes. As something new, we decided to address the crash density per square kilometre in the areas delimited by the major roads and treat these areas as homogeneous units in the analysis. We identified 14 local traffic areas as hazardous—all located in the city centre with heavy cyclist and pedestrian traffic. We considered these local traffic areas homogenous as a way of facilitating prevention through mass action. For example, if there are many pedestrian falls in an area, a mass action measure could be to check the area for uneven pavement tiles. Another example is if there is a high number of single-vehicle accidents involving bicycles, the area could be inspected for inappropriate design of road surfaces on the routes many cyclists use. A third example is if an analysis of crashes in the black local traffic areas reveals a disproportionate number of crashes during the winter months, the level of winter maintenance in this specific area could be increased. A fourth example is if a local traffic area has many houses, small local roads and vulnerable road users, such as school children, more speed reduction facilities to prevent new crashes can be implemented. Decisions on mass actions can be made based on descriptive analyses combined with maps of crash coordinates in local traffic areas.
Around 55% of crashes with serious injury based on ambulance data occurred off the main road network, in contrast to police-recorded crashes, which were stated to primarily occur on main roads (including intersections). A focus solely on police-recorded crashes can thus mean that municipalities’ preventive work will be mistakenly conducted primarily on main roads. Therefore, using ambulance data in road safety work can therefore help solve this problem.
We compared the gender, age and road user type of patients in ambulance runs with the police-recorded injured in traffic crashes and found similarity which may suggest that ambulance and police data ‘catch’ similar injuries, but ambulance data revealed more than three times more traffic injuries than available in police records.
4.1. Limitations
However, this study found that, in preparing ambulance data for traffic safety work, quality assurance of data is necessary. We estimated the annual time consumption for ambulance data quality assurance at 70 employee hours, which is a relatively low cost. In this context, it is important to remember that the use of police data also requires data quality assurance before specific black spot identification is conducted. We advocate that ambulance data can be utilised as a highly useful supplement to police data to reduce the effect of underreporting. As explained in the results, ambulance data are especially useful in relation to the many crashes in local traffic areas.
The results found in Tables 1, 6 and 7 do, however, also indicate that there are problems with the lack of information, for example, regarding road user type in the ambulance records. Except in cases with detailed traffic crash information in the ambulance descriptive notes, we do not obtain data on the crash situation, which is typically necessary for the prevention of new crashes through, for example, rebuilding infrastructure. Furthermore, for cases in which no valid personal identification number was registered in the ambulance, it was not possible to confirm a hospital contact, and only ambulance data could be used.
Another problem is the error rate of the identification of ambulance runs for patients injured in traffic crashes documented in Table 5. Errors must be expected because humans are involved in the registration of a crash. In particular, personnel in the emergency room are second hand witnesses to the crash. Based on the reading of 100 random ambulance records, we argue that the error rates are small: 4% for decidedly non-traffic-related injuries or 7% if we consider the crashes of horse and mountain bike riders as non-traffic related. The error rate could potentially be reduced through the use of AI, specifically in the review of case notes, which should be tested.
Another limitation is that in this specific dataset, we do not know the source of the crash coordinates. This problem can perhaps be remedied by obtaining coordinates from the crash location where the ambulance stops for a longer time, but this must be studied before launching ambulance data for road traffic safety work in operation.
We found that the use of ambulance data is associated with misclassification. But – so is the use of police data in the site-specific road traffic safety work. In Denmark, research has demonstrated that for example the police-reported crash severity is highly misclassified because it is evaluated by the police and not by the medical doctor treating the injured (Kjærgaard & Lauritsen, 2024).
4.2. Comparison with the literature
Morency and colleagues (2012; 2006) introduced the use of ambulance records for the identification of hazardous road locations. They identified both specific black spots on the road network and pointed out smaller geographical areas with the potential to prevent traffic crashes. Morency et al. performed their black spot identification through the use of relatively simple GIS hot spot recognition tools, for example, with no control for traffic volumes. as we incorporated into our identification process. Traffic volumes are essential, and we stress that future research should find a way to also incorporate the volumes of cyclist and pedestrian traffic in the identification of hazardous locations. More recent work by Rahman et al. (2016), Shabanikiya et al. (2020), Vivento AS and Agenda Kaupang AS (2015) and Berg and Augustsson (2018) attempted to operationalise the road traffic safety use of ambulance data but did not control for traffic volumes either. They identified hazardous locations as hot spots in the GIS tool, that is, as simple clustering of crashes above a certain number within a prespecified radius. Our method of identifying hazardous areas outside the network of major roads is similar to the method of Morency and colleagues, but this method could also use some refinement. One suggestion is to use the area’s population, commercial space and number of employees to calculate an indicator of the traffic volume in the area.
4.3. Potential and challenge
As a final remark, we argue that based on the experiences of this research project, the potential of using a combination of ambulance, hospital and police records in road safety work is substantial. Ambulance data can be merged with hospital patient data and quality-checked in municipalities at a relatively low cost. However, a major challenge in extending our work to day-to-day running black spot recognition is the need for access to an anonymised part of ambulance and hospital patient data in municipalities. This raises ethical and legal issues about access to and sharing patients’ medical record data. The preventive benefits of enhanced black spot recognition are at such a level that legal approval of and a practical solution to data anonymisation should be worked out.
5. Conclusion
This project has demonstrated that there is great potential for better utilisation of the combination of ambulance and hospital patient data in site-specific road safety work through the relatively simple linking of the two data sources. The developed method can be put into operation without major costs, but we also point to opportunities to improve the method using AI. However, there are several administrative issues regarding the security of patient data that must be resolved before the method can be put into regular operation.
CRediT contribution statement
Anne Vingaard Olesen: Data curation, Formal analysis, Funding acquisition, Methodology, Writing—original draft. Tim Alex Lindskou: Methodology, Writing—review & editing. Rasmus Øhlenschlæger: Formal analysis, Visualization, Writing—review & editing. Torben Anders Kløjgaard: Conceptualization, Data curation, Writing—review & editing. Anders Brogaard Tallaksen: Data curation, Formal analysis, Visualization, Writing—review & editing. Jens Lauritsen: Data curation, Methodology, Writing—review & editing. Erika Frischknecht Christensen: Conceptualization, Funding acquisition, Writing—review & editing. Harry Lahrmann: Conceptualization, Funding acquisition, Methodology, Writing—review & editing.
Declaration of competing interests
The authors have nothing to declare.
Funding
The study was funded by TrygFonden (grant number 115826).
Declaration of the use of generative AI in writing
The authors did not use generative AI in the writing process.
Ethics statement
The Danish Patient Safety Authority approved the handover of data from the prehospital medical records for the study (ID number 31-1521-254).
Editorial information
Handling editor: Haneen Farah, Delft University of Technology.
Reviewers: Baran Ulak, University of Twente; Lars Ekman, Swedish Transport Administration.
Submitted: 18 May 2024; Accepted: 1 March 2025; Published: 31 March 2025.