Analyzing the safety effects of different operating speeds for an autonomous shuttle bus service
Abstract
This study aims at evaluating the impacts of different operational speeds of an autonomous shuttle bus service on road safety by increasing Connected and Automated Vehicles (CAVs) Market Penetration Rate (MPR) and combining network characteristics. A microscopic simulation analysis was performed in order to quantify the impact of road safety of an automated shuttle bus service within traffic. In the traffic network of Villaverde, Madrid, several scenarios were simulated using the Aimsun software considering the various CAV MPRs (0%–100%), and the different operational speeds of the service, namely 15, 30, and 45 km/h. From the microscopic simulation, the vehicle trajectories were extracted and analyzed using the Surrogate Safety Assessment Model (SSAM) software that identified conflicts. Statistical analysis was then performed using negative binomial regression using the frequency of conflicts that the shuttle bus service was involved in as the dependent variable. The analysis revealed that the conflict frequency is lower when the shuttle bus operates at 45 or 30 km/h compared to 15 km/h, with the 45 km/h speed showing the largest reduction. This reduction in conflicts is probably due to the shuttle bus adapting more easily to the average traffic speed and is more synchronized with traffic flow. Furthermore, greater CAV MPR results in steadily decreased conflict frequency probably due to the automated shuttle’s adaptability and collaboration with automated and connected traffic vehicles. The current study establishes a solid relationship for the conflict frequency of AV shuttles enabling stakeholders to optimize road safety towards a future of automated traffic.
1. Introduction
Connected and Autonomous Vehicles (CAVs) are anticipated to become more prevalent in urban road networks in the subsequent decades. CAVs have the potential to significantly transform how transportation and road networks operate by increasing road capacity, improving fuel efficiency, and emitting fewer pollutants into the environment (Elvik, 2021; Fagnant & Kockelman, 2015; Mersky & Samaras, 2016; Ye & Yamamoto, 2018). Furthermore, road safety is anticipated to be enhanced with the CAV evolution and dominancy since several road collisions will be prevented. Taking into account recent outcomes from existing literature, road conflicts could be significantly decreased based on the increasing Market Penetration Rates (MPRs) of CAVs (Papadoulis et al., 2019).
Connected and Automated Transport Systems (CATS) are anticipated to be the first to line up with their large-scale business cases. Specifically, it is expected that CATS will improve aspects such as urban mobility, and will be able to make transit systems more competitive to be chosen by commuters. The steadily increasing MPR of automated transit services seems to have the potential to shorten travel times (Ziakopoulos et al., 2021) and when compared to mixed traffic situations, point-to-point services that use a dedicated lane show fewer delays (M. G. Oikonomou et al., 2020). Many studies have investigated the safety level by investigating the conflicts of the entire network and some of them investigated the impact of the increasing MPR on conflicts (Arvin et al., 2020; Guériau & Dusparic, 2020; Papadoulis et al., 2019; Sinha et al., 2020).
Nevertheless, none of the studies has investigated the safety at a vehicle-level as well as modeled statistically the safety level. This stands as the motivation of the current study, which more specifically focuses on automated shuttle bus services that are expected to be the first to align with their large-scale business cases. Focusing on automated public transport, a recent study revealed that passengers of autonomous shuttle services stated that their most concerned attribute is speed (C. Chen, 2019). Consequently, the operational speed of the automated shuttle service was taken into consideration in the analysis of present research focusing on its impact on safety in order to accomplish a more attractive experience to the passengers.
Since the use of surrogate safety measures provides a reliable path to assess the safety of automated systems (Wang et al., 2021), the current study aims at evaluating the impacts of different operational speeds of an autonomous shuttle bus service on road safety by increasing the MPR of CAVs and taking into account network characteristics. In this regard, a dense urban traffic network in Madrid, Spain was utilized. Realistic data from the network and traffic were inserted in the Aimsun Next software; a simulation software, in which there is the ability of modelling CAVs by adjusting Car Following, Lane Changing and Gap Acceptance behavioral models (Aimsun, 2020). The trajectories of the vehicles were extracted from the microscopic simulation, and the vehicle trajectories that were extracted were analyzed using the Surrogate Safety Assessment Model (SSAM) software in order to identify traffic conflicts. After the extraction of traffic conflicts, in order to shed more light into the statistical significance of the relationships, statistical analysis performed combining the network characteristics and the frequency of conflicts. Specifically, the present study also aimed to further enrich the safety evaluation by performing statistical analysis on microsimulation inputs in the form of Negative Binomial (NB) modeling.
Simulation techniques were deemed as the most optimal to analyze the effects of CAVs and their performance (D. Chen et al., 2017; Lam, 2016; Scheltes & de Almeida Correia, 2017; Shen et al., 2018; Talebpour et al., 2017; Zellner et al., 2016). The examined hypothetical situations of CAVs could not be accomplished with another method with the same level of detail. Numerous sources, including network geometry, traffic volume, and modal split, are used as inputs to the simulation. A variety of impacts can be analyzed using the data produced by the microscopic simulation. Every vehicle interacts with other cars and the surroundings are monitored. Researchers can simulate the operation of every vehicle inside the network and analyze many traffic-related impacts, like safety impacts, while taking traffic features into account by modeling traffic flows, which leads to more precise estimates (Lopez et al., 2018; Zhu & Zhang, 2017).
This study is structured as follows; after the current introduction to the study topic and aim, the method follows, including five main subsections. The first one relates to the simulation aim, preparation, and network. The second one introduces some parameters of the surrogate safety analysis which are considered into the analysis, while the third one relates to the measurements analyzed by this study. Furthermore, the fourth one presents the descriptive statistics of the measurements and the fifth subsection explains the background of the chosen statistical analysis of the surrogate safety measurements. After that, results are presented by including the statistical model and main outcomes derived from the simulation data along with the predictive performance of the model. Then, the outcomes are discussed and cross-validated by existing literature along with future research proposals and study limitations. Finally, overall conclusions are presented, which include a brief summary of the purposes of the study and its findings, as well as how stakeholders or policymakers might benefit from it.
2. Research Methodology
2.1. Simulation Setup
The study network represented the Villaverde district of the city of Madrid, Spain and was designed in the Aimsun Next mobility software. The simulated network, as shown in Figure 1, consisted of 668 road segments with a total length of 23 km and 365 nodes reaching approximately 2 km2. The network geometry was exported from the OpenStreetMap digital map platform. In addition, the peak hour traffic conditions were simulated and corresponded to a travel demand of 5,784 passenger car and 716 truck trips. The travel demand was created using volume data that were collected for the year 2018 (representative traffic volume prior to the COVID-19 pandemic) from about 80 detectors and provided by the EMT Madrid (Empresa Municipal de Transportes de Madrid - www.emtmadrid.es). Moreover, the transport network of the Villaverde district was also included in the simulated network. More specifically, 23 conventional bus lines and 39 public transport stops, as well as the frequencies and waiting times at stops were considered. In addition, the control plans of traffic lights for signalized intersections were provided by EMT Madrid and included in the simulation model, as well.
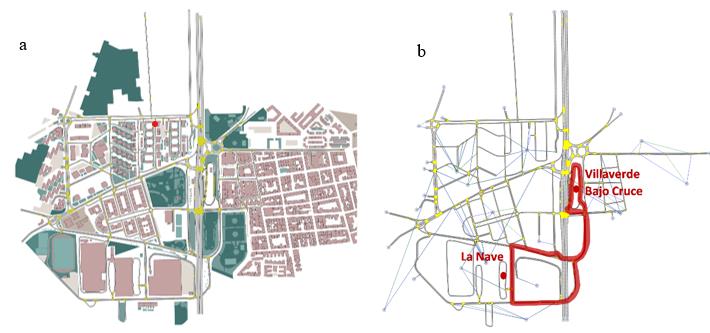
In the aforementioned network, an automated shuttle bus service was implemented and its impact on safety was investigated. The shuttle bus service was designed to operate in parallel with the existing public transport (the 23 bus lines) and its line connected the “La Nave”, a public facility that encompasses numerous activities, with the “Villaverde Bajo Cruce” subway station, as depicted in Figure 1. The total length of the service circular route was 1.6 km and had two bus stops in total. The service included one electric shuttle bus operating with a frequency of 15 minutes, which means that there were four departures in the simulated peak hour. The shuttle bus dimensions were 12 m in length and 2.55 m in width and had a total capacity of 60 passengers and 25 passengers seating. Its maximum desired speed was 60 km/h, maximum acceleration 1.36 m/s2, maximum deceleration 10 m/s2 and weight 15,845 kg.
Focusing on the simulated scenarios, three different sets were considered to represent three different operational speeds for the shuttle bus, which were 15 km/h, 30 km/h, and 45 km/h. The sets consisted of eleven microscopic simulation scenarios that differed in the market penetration rate of CAVs (from 0% to 100% with 10% increments). Specifically, the CAV market penetration rates concerned both passenger cars and trucks and replaced the respective conventional vehicle percentages. The CAV driving profile of passenger cars was simulated as a more aggressive profile than human-driven passenger car one, due to the fact that evolved CAVs would present advanced sensing and cognitive ability, data fusion usage, confidence in taking decisions, smaller gaps, early anticipation of lane changes and less time in give way situations. For modelling trucks and the shuttle buses, it was assumed that their driving profile was more cautious than a human-driven passenger car due to their reduced values on maximum acceleration and deceleration, presenting limited sensing and cognitive ability, longer gaps, early anticipation of lane changes and longer time in give way situations. These driving profiles were defined setting various parameters in the Aimsun software, i.e. acceleration and deceleration, reaction time, lane changing model parameters and overtaking behaviour, based on a comprehensive literature review conducted within LEVITATE project, and can be found in a recent study conducted by Chaudhry et al. (2022).
Overall, thirty-three microscopic simulation scenarios were formulated and for each one ten different replications with random seeds were simulated as well. From the simulation of these scenarios, traffic data was recorded every 10 simulation minutes. Furthermore, the vehicle trajectories were also extracted per 0.4 seconds, equal to the simulation time step. The simulation time step was set to 0.4 seconds since its value has to be multiple of the reaction time of the vehicles in the Aimsun software. The reaction time of the CAVs was considered 0.4 seconds based on CAV parameters that the LEVITATE project indicated (Chaudhry et al., 2022) and hence the simulation step was set to 0.4 seconds.
2.2. Surrogate safety analysis
From the aforementioned microscopic simulation scenarios, the vehicle trajectories were extracted and analyzed using the Surrogate Safety Assessment Model (SSAM) software. The software processed the vehicle trajectory data given through the microscopic simulation and identified conflicts. A conflict is identified when the time-to-collision (TTC) and post-encroachment time (PET) are lower from preset thresholds, with 1.5 seconds and 5.0 seconds default values, respectively. In the present study, the TTC threshold value was different in case of the connected and automated passenger cars due to their smaller standstill distance and was set to 0.5 seconds instead of 1.5 seconds, based on the framework conducted through the LEVITATE research project. More information can be found in research conducted by Weijermars et al. (2021).
The extracted data from the surrogate safety analysis provided data for each scenario set contained information for each conflict that occurred during the simulation time. Each row of the data represented one conflict by offering measures regarding the conditions that the conflict occurred such as its type, involved vehicle IDs, road segment ID where the conflict occurred and multiple surrogate safety measures (i.e. TTC, PET, speed, heading, deceleration, etc.). Afterwards, the vehicle IDs were matched with the corresponding vehicle types by using a relevant API in Aimsun software. Similarly, the road segment IDs were matched with multiple characteristics derived from the network through the Aimsun software. In the final data frame, only the conflicts in which the automated shuttle was involved in were included, resulting in a total number of 5,500 rows. The data (5,500 rows) was then aggregated by many critical measures in order for the frequency of conflicts (at the automated shuttle bus level) to be calculated and analyzed. The used measures as well as their description are described below.
2.3. Measurement description
The aggregation of the conflict database (each row representing one conflict: 5,500 rows in total) was conducted using critical measurements described in Table 1. The aggregated data frame consisted of 530 rows and was structured in order to be analyzed and consequently investigate the relationship of conflict frequency that the shuttle bus was involved in with regards to its speed, MPR and network characteristic. In Table 1, for each measurement, the software source (Aimsun or SSAM), type of measurement as well as a short description with its responses if the measurement is categorical are given. The measurements concerned multiple aspects such as the different shuttle operational speeds (i.e., 15 or 30 or 45 km/h), the MPR of fully connected and autonomous vehicles within the traffic (i.e., 0-100%), number of lanes, road type (i.e., primary, residential, and tertiary), conflict type (i.e., rear-end, lane change, and crossing), traffic control type (i.e., give way, stop sign, traffic light and none), and the responsible vehicle (i.e., shuttle or other) in each conflict. In the aggregated database, an additional column was created with the number of the occurred conflicts (i.e., conflict frequency) for each of the aforementioned variables and aimed to be the dependent variable of the statistical modelling.
| Measurement | Software | Type | Description |
| Conflict frequency | SSAM | Integer | The recorded frequency that the AD shuttle bus is involved in a conflict either as a responsible or non-responsible vehicle. |
| MPR | Aimsun | Integer | The Market Penetration Rate of fully autonomous vehicles within the traffic:
|
| Number of Lanes | Aimsun | Integer | How many number of lanes had the road segment where the conflict occurred. |
| Scenario | Aimsun | Categorical | The three dedicated scenarios under the same traffic conditions changing the shuttle operational speed:
|
| Road Type | Aimsun | Categorical | In which road type segment did the conflict occur:
|
| Conflict Type | SSAM | Categorical | Which type was the recorded conflict:
|
| Control Type | Aimsun | Categorical | What was the type of traffic control in the road segment where the conflict occurred:
|
| Responsible Vehicle | SSAM | Categorical | Which vehicle was the responsible vehicle for the occurred conflict:
|
2.4. Descriptive statistics
Table 2 illustrates descriptive statistics with regards to the examined variables for 530 dedicated situations (i.e., different MPR levels, along with different operational speeds, etc.) that the 5,500 conflicts of the shuttle bus involved in. The variables were divided into integers and categorical and different descriptive statistics are given for these two categories. Sample size, minimum value, mean, maximum value, and standard deviation were estimated for integer variables and sample size and a sample of each response were estimated for each categorical variable.
| Variable | N | Min | Mean | Max | SD | Response Frequency |
| Integer Variables | ||||||
| Conflict frequency | 530 | 1 | 10.38 | 124 | 19.67 | - |
| MPR | 530 | 0 | 47.60 | 100 | 31.71 | - |
| Number of Lanes | 530 | 1 | 1.36 | 3 | 0.69 | - |
| Categorical Variables | ||||||
| Scenario | 530 | - | - | - | - | Scenario 15km/h: 180 Scenario 30km/h: 178 Scenario 45km/h: 172 |
| Road Type | 530 | - | - | - | - | Primary: 66 Residential: 223 Tertiary: 241 |
| Conflict Type | 530 | - | - | - | - | Crossing: 274 Lane change: 109 Rear end: 147 |
| Control Type | 530 | - | - | - | - | Give Way: 84 None: 328 Stop: 34 Traffic Light: 84 |
| Responsible Vehicle | 530 | - | - | - | - | Other Vehicle Responsible: 278 Shuttle Bus Responsible: 252 |
2.5. Negative binomial regression
In contrast to conventional multiple regression, negative binomial regression uses as the dependent (Y) variable an observed count that has a negative binomial distribution. Therefore, the non-negative integers 0, 1, 2, 3, etc. are possible values for the dependent variable. Negative binomial regression is a generalization of Poisson regression that loosens the restrictive assumption that the variance must be equal to the mean value made by the Poisson model. The Poisson-gamma mixed distribution serves as the foundation for the traditional negative binomial regression model. This approach is popular because it enables the use of a gamma distribution to model Poisson heterogeneity (Hilbe, 2007).
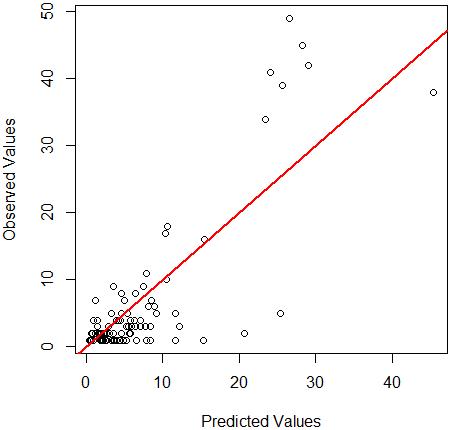
For the current study, the Negative Binomial regression model was chosen because the investigated dependent variable is the frequency of conflict frequency, which is a non-negative integer. Furthermore, the dependent variable follows the negative binomial distribution and the variance is greater than the mean of the dependent variable. The data cleaning and aggregation as well as the data analysis process were conducted in the R studio and specifically the library MASS (Brian et al., 2022) used for the negative binomial regression analysis. In order to accept the final model, some acceptance criteria adhered. Firstly, only statistically significant independent variables were included in the model (based on the p-value). Additionally, highly correlated independent variables were excluded from the model. Moreover, the sign of the estimate was checked to have a practical meaning with regard to the effect on the dependent variable. Then, the extracted metrics (i.e., AIC, Theta, Std. Error, 2xlog-likelihood, and pseudo R2) were checked to be at an acceptable level. Furthermore, it is worth mentioning that a random split following the same distribution of the sample was implemented. This split was divided into a train (80% of the sample size) and a test set (the remainder 20% of the sample size) in order to check the predictive performance of the model. The model was trained on the train set and tested on the test set. For this purpose, a scatterplot (Figure 2) was created with actual (or observed) and predicted values of the test set to assess the predictive accuracy of the model.
3. Results
The conflict frequency of the shuttle bus was modeled using negative binomial regression and taking into account the surrogate safety measurement of conflict frequency, as stated previously. The final model is presented in Table 3, after a considerable number of repetitions for finding the optimal model and simultaneously all the independent variables to be statistically significant. For each variable, its regression estimates, standard error values, z value, p-value, and statistical significance are included. Then, at the end of the tables AIC, Theta, Std. Error, 2xlog-likelihood, and pseudo R2 were estimated and checked to be at an acceptable level.
| Parameters | Estimate | Std. Error | z value | Pr(>|z|) | Sig. |
| Intercept | -11.929 | 0.972 | -12.271 | < 0.001 | *** |
| 30km/h operational speed [Ref. 15km/h] | -0.530 | 0.102 | -5.189 | < 0.001 | *** |
| 45km/h operational speed [Ref. 15km/h] | -0.659 | 0.101 | -6.487 | < 0.001 | *** |
| MPR | -0.003 | 0.001 | -2.186 | 0.029 | * |
| Residential road segment [Ref. Primary] | 7.649 | 0.631 | 12.115 | < 0.001 | *** |
| Tertiary road segment [Ref. Primary] | 8.965 | 0.674 | 13.308 | < 0.001 | *** |
| Lane change conflict [Ref. Crossing] | -1.509 | 0.123 | -12.311 | < 0.001 | *** |
| Rear end conflict [Ref. Crossing] | -0.783 | 0.116 | -6.773 | < 0.001 | *** |
| No control [Ref. Give way] | 0.628 | 0.150 | 4.205 | < 0.001 | *** |
| Stop sign [Ref. Give way] | -1.014 | 0.231 | -4.393 | < 0.001 | *** |
| Traffic light [Ref. Give way] | -2.141 | 0.298 | -7.187 | < 0.001 | *** |
| Shuttle responsible vehicle [Ref. Other] | 1.711 | 0.102 | 16.812 | < 0.001 | *** |
| Number of lanes | 4.728 | 0.321 | 14.707 | < 0.001 | *** |
3.1. Model first insights
Each sign of estimates indicates whether the dependent variable has increased or decreased. Comparing the estimates, it is revealed that when the shuttle bus operational speed is 45km/h or 30km/h the conflict frequency is decreased compared to the 15km/h operational speed, while the 45km/h speed presented the highest value. In addition, the higher MPRs of CAVs cause lower conflict frequency. On the other hand, the frequency of conflicts seems to be greater in the case of residential or tertiary road segments with regards to the primary roads. Road segments that control traffic by a stop sign or traffic lights indicate lower conflict frequency than those that control traffic by a give-way sign. The existence of a traffic light in a road segment causes the lowest conflict frequency. On the contrary, the non-controlled road segments present a higher frequency of conflicts compared to those that are controlled by a give-way sign. Furthermore, the road segments with more traffic lanes represent an increased frequency of conflicts. Focusing on the type of conflict, it appears that crossing conflicts have the highest frequency, followed by rear-end conflicts and then lane change conflict type. Finally, the frequency of conflicts seems to be higher in the case of the shuttle bus being the responsible vehicle for the conflict compared to when another vehicle is the responsible one.
Given the estimates of each parameter and the range of each parameter, the road segment type seems to induce the greatest impact on the conflict frequency. Then, at the same extension, the number of lanes seems to impact highly the conflict frequency taking into account that it ranges from 1 to 3. After that, conflict type, traffic control type and if the shuttle is responsible for the conflict seem to be quite equal to the induced impact. Then, the different operational speeds of the AV shuttle follow and impact statistically significant conflict frequency but not with the same magnitude as the aforementioned variables. Finally, the MPR follows which ranges from 0 to 100 and for MPR equals 100, the estimate is equal to -0.3, which is a lower estimate than the others.
3.2. Model Predictive Performance
To evaluate the negative binomial model ability to predict outcomes, a train and test split was applied. The scatterplot of Figure 2 was made using the test set; observed and predicted values. The true and accurate predictions are located in the diagonal line of the scatterplot. Based on this and that in this case the majority of the points are located near the diagonal showing the residuals distance, the predictive performance of the model can be validated and consequently be generalized to other applications.
4. Discussion
The current study aimed at modelling the frequency of traffic conflicts of an automated shuttle service using traffic microsimulation and the SSAM software. Towards that end, negative binomial models were utilized. The key contribution of the current study is the establishment of a solid relationship between the conflict frequency of a shuttle bus service and its different operational speeds, CAV MPRs and traffic network characteristics. From the statistical relationship, the trend of each independent variable is concluded and discussed as well as the magnitude of the marginal effect can be extracted depending on the range of each independent variable.
According to the statistical analysis, the conflict frequency is lower when the shuttle bus operates at 45 or 30 km/h compared to 15 km/h, with the 45 km/h speed showing the largest reduction. A possible explanation of this outcome is that the shuttle bus adapts to the average traffic speed and thus is more synchronized with the prevailing traffic flow avoiding dangerous and close interactions with other vehicles that induce conflicts with the traffic vehicles. Specifically, the average speed of the prevailing traffic ranges between 28-30 km/h through the increasing MPR and this can be validated by another publication with the same traffic network (M. Oikonomou et al., 2022). This is in line with the existing literature since another study revealed that as average speed increases, rear-end conflict numbers are more probable to be lower, and combining the outcome that high variations in speed increase conflict counts (Katrakazas et al., 2021). This outcome was concluded for the entire traffic network in that paper, but can be applied and generalized in the current study as the operational speed of the bus is being compared to the average speed of the network. It is worth noting that this outcome is valid for the range of speed between 15 and 40 km/h, and probably with an even lower or a higher operational speed results could be totally contradicting, and potentially the bus would be involved in more conflicts.
Taking into account the regression results, greater CAV MPR results in steadily decreased conflict frequency at the shuttle bus level. For instance, when MPR is 0%, i.e. without the existence of CAVs within traffic, the shuttle bus is involved in the highest possible number of conflicts. However, with the increase of MPR e.g., 100%, the shuttle is involved in the lowest possible conflicts. This phenomenon is likely due to the automated driving shuttle’s adaptability and collaboration with CAV traffic. Accomplishing a greater collaboration with automated traffic, the shuttle bus succeeds in reducing its involvement in traffic conflicts. This steady drop in the conflicts with the increasing MPR is concluded in other research studies as well (Mousavi et al., 2021; Papadoulis et al., 2019; Sha et al., 2022).
Focusing on the network and road characteristics, it is revealed that the frequency of conflicts is greater in the case of residential or tertiary road segments compared to the primary roads. The greatest conflict frequency was recorded in the tertiary road segments, probably due to the lower speeds as well as the sharp turns and crossings. With regards to the number of lanes, the road segments with more traffic lanes represent an increased frequency of conflicts. The traffic lanes within the simulated network ranged between 1 and 3. With more lanes, probably the shuttle bus was involved in more frequent dangerous interactions (i.e., conflicts) due to the fact that the rest of the vehicles were overtaking the shuttle bus causing more lane-changings. Traffic-controlling road segments with stop signs or traffic lights show a lower conflict frequency than those with give-way signs. The least amount of conflicts occurred when a traffic light was present along a road segment, probably due to a more synchronized flow preventing harsh brakings and maneuvers. Contrarily, the uncontrolled road segments exhibit a higher frequency of conflicts due to the exact opposite argumentation of the traffic lights, as mentioned previously. Uncontrolled road segments are quite opposite to the synchronized flow generated by the traffic lights and thus harsh braking and maneuvers could be recorded.
If we concentrate on the type of conflict, crossing conflicts seem to occur more frequently, followed by rear conflicts and lane change conflicts. This is in opposition to the existing literature since another study using SSAM revealed that rear-end conflicts are more within both automated and conventional traffic and then lane change and crossing conflicts follow (El-hansali et al., 2021), this outcome can be the opposite since it refers to the entire traffic and not at a vehicle level. When the shuttle bus is the responsible vehicle for the conflict, conflicts seem to occur more frequently than when another vehicle is the responsible one.
Additional effects in relation to other services, as well as taking into account various networks, vehicle types, and automation levels, need to be further researched for future study aspects. The safety impact of automated transportation systems could be improved by running additional scenarios of services at operational speeds other than the ones that were examined and combining various driving parameters, apart from speeds, of the autonomous shuttle buses (such as headway, acceleration, and deceleration, etc.). There are certain limitations to the current study. Since traffic microsimulation was used, it was impossible to avoid making assumptions about the modeling of CAVs. In addition, non-motorised road users, such as pedestrians and cyclists, were not considered in simulations and left for future research aiming at giving insights about impact of automated shuttle service on vulnerable road user activity. As a result, other surrogate safety measurements in addition to those under consideration will be able to provide information on additional effects of automated shuttle service operation on road safety that were not evaluated in the current study.
5. Conclusions
Τhe current study aimed to evaluate the impacts of various operational speeds for autonomous shuttle bus services on traffic safety using traffic microscopic simulation. A microscopic simulation analysis was performed for this reason in order to produce several measurements that quantified the effects of automated shuttle bus service under various traffic circumstances. In Villaverde, Madrid, thirty-three (33) scenarios were created using the Aimsun Next mobility modeling program. Simulation scenarios considered various CAV market penetration rates within the current traffic demand (0 - 100 % increasing by 10 %) applied to passenger cars and trucks, and different operational speeds for the automated shuttle bus service, namely 15, 30, and 45 km/h. From microscopic simulation data, statistical analysis using negative binomial mainly revealed that the conflict frequency is lower when the shuttle bus operates at 45 or 30 km/h compared to 15 km/h, with the 45 km/h speed showing the largest reduction due to the shuttle bus adapting more easily to the average traffic speed and is more synchronized with traffic flow. Furthermore, greater CAV MPR results in steadily decreased conflict frequency probably due to the AV shuttle’s adaptability and collaboration with automated and connected traffic vehicles. Finally, the key contribution of the current study is the establishment of a solid relationship between the conflict frequency that the shuttle bus was involved and its various speed selection, MPR and network characteristics and could help stakeholders optimize road safety towards a fully automated transportation future.
CRediT contribution statement
Maria G. Oikonomou: Conceptualization, Data curation, Formal analysis, Methodology, Writing—original draft. Marios Sekadakis: Conceptualization, Formal analysis, Methodology, Writing—original draft. Christos Katrakazas: Conceptualization, Methodology, Writing—review & editing. George Yannis: Supervision.
Acknowledgements
The authors would like to thank EMT (Empresa Municipal de Transportes de Madrid - www.emtmadrid.es) Madrid, Spain and Tecnalia Research and Innovation Bilbao, Spain for providing all necessary data exploited to accomplish this study.
Declaration of competing interests
The authors declare that the contents of this article has not been published previously. As there are no competing interests to declare, this manuscript is submitted with full transparency and adherence to the journal’s guidelines.
Ethics statement
This study can be exempted from requiring ethical approval as it is based on a traffic simulation model and does not involve human participants and personal data.
Declaration of generative AI use in writing
The authors declare that no generative AI was used in this work.
Funding
The SHOW project (www.show-project.eu) has received funding from the European Union’s Horizon 2020 research and innovation programme under grant agreement No 875530. The document reflects only the author’s view, the EU is not responsible for any use that may be made of the information it contains.
Editorial information
Handling editor: Haneen Farah, Delft University of Technology.
Reviewers: Attila Borsos, Széchenyi István University; Paolo Intini, University of Salento.
Submitted: 19 February 2024; Accepted: 1 March 2025; Published: 26 March 2025.