Assessing micromobility safety on horizontal curves of bike lanes: a video motion analysis methodology
Guest editor: Ragnhild Davidse, SWOV Institute for Road Safety Research, the Netherlands
Reviewers: Haneen Farah, Delft University of Technology, the Netherlands
Willem Vlakveld, SWOV Institute for Road Safety Research, the Netherlands
Received: 31 January 2024; Accepted: 25 July 2024; Published: 20 September 2024
Abstract
This study introduces a novel surrogate safety indicator, the ‘effective radius’, and a dynamic tracking methodology for assessing the safety of micromobility (MM) users on isolated bike lane curves, with a focus on geometric characteristics. The methodology involves six main pillars, including site selection, geometric data collection, video recording, speed and position extraction, visualization, and analysis. Naturalistic video data of bike lane users are captured to observe user behavior, and specific points along the curve centerline are identified for monitoring lateral position and speed on a selected curve site in Valencia, Spain. The analysis centers on a bidirectional bike lane featuring a sharp horizontal curve, incorporating the effective radius criteria to evaluate MM users' responses to geometry and environmental conditions. Findings reveal significant variation in effective radius, especially during left turns, primarily due to the geometry factor and the lane's positioning outside the curve. Lateral displacement heat maps indicate that left-turn users often have higher tendencies to violate dedicated lanes, posing collision risks. The speed analysis underscores potential conflicts and reduced handling capabilities for users breaching lane boundaries. The imperative need for well-informed design and safety measures in micromobility infrastructure is emphasized, considering the impact of geometric factors on user behavior and safety.
Keywords
bike lane, horizontal curve, micromobility, motion analysis, road safety, user behaviour
Introduction
Micromobility safety: navigating current risks
European and Chinese cities increasingly promote micromobility, particularly cycling, as a key daily transportation mode (Uijtdewilligen et al., 2023). Despite efforts to enhance cycling-walking-public transport connectivity, recent crash data reveals a decline in the safety of these vulnerable users. Micromobility is classified into four types (A, B, C, D), based on their maximum speed, weight, and whether they are powered or unpowered. The micromobility users studied in this research include unpowered bicycles and powered e-scooters that belong to class A and weigh below 35 kg (Hossein Sabbaghian et al., 2023). According to the Spanish General Directorate of Traffic (DGT), out of 305 689 crashes that occurred over five years since 2018, 29 913 involved micromobility users, among which e-scooter-related crashes surged (Sanjurjo-De-No et al., 2023). Intersection areas pose heightened side-impact collisions risks for both bicycles and e-scooters, especially during motor vehicle turns across bike lanes (Pérez-Zuriaga et al., 2023). The German In-Depth Accident Study (GIDAS) also reports a steady increase in bicycle accidents in Germany since 1999 (GIDAS, n/d). In the Netherlands, with a substantial 28% bike mode share, over 63% of serious injuries since 2021 occurred without motor vehicle involvement (Aarts et al., 2022; Bos et al., 2022; GIDAS, n/d; SWOV, 2023). In 2022, cyclists accounted for nearly 40% of road deaths in the Netherlands with 290 cases (SWOV, 2024). While the significant cycling mode share is a contributing factor, other influences on the rise in road deaths need assessment (Swarttouw, 2023). In response, Dutch authorities have regulated speed in build-up areas to 30 km/h, aiming to reduce the intensity of cyclist-car collisions. Nonetheless, addressing non-motor vehicle incidents is crucial for minimizing serious injuries among Micromobility users, as studies indicate a significant number of injuries result from falls and conflicts among vulnerable users (DGT, n/d; Haarbrink, 2021; IenW, 2018; Reijne et al., 2022). Additionally, many non-hospitalized incidents go unreported, concealing the potential contributing factors. The Road Safety Strategic Plan in Europe, with the goal of achieving zero fatalities or serious injuries in traffic accidents by 2050, emphasizes prioritizing safety in road designs from the outset and taking into account behavioral studies (DGT, n/d; Haarbrink, 2021; IenW, 2018; Reijne et al., 2022).
Behavioral patterns and safety assessment measures
Maneuvering and behavioral patterns of micromobility (MM) users, influenced by environmental factors such as geometry, degree of sight, grading, side barriers, vegetation, and pavement condition in bike lanes, significantly contribute to most single-user and between-user accidents (Hossein Sabbaghian et al., 2023). Recent behavioral studies primarily focus on capturing the naturalistic riding behavior dynamics of road users to predict their future positions or compute surrogate measures of safety (SMoS) (Nabavi Niaki et al., 2019). These studies serve three main purposes: proactive safety performance assessment, development of real-time collision warning systems, and assistance in decision-making for automated driving (Bao et al., 2012; Lu et al., 2021; Mullakkal-Babu et al., 2020).
Surrogate Measures of Safety (SMoS) are commonly classified based on their application (direction, operational attributes), usefulness scope, and time nature of the data (Mullakkal-Babu et al., 2020). Regarding their application scope, SMoS are categorized by interaction dimensions, including longitudinal interaction, lateral interaction, and two-dimensional interaction. Common longitudinal SMoS indicators include TTC (Time to Collision), GT (Gap Time), DRAC (Deceleration Rate to Avoid Collision) or DST (Deceleration to Safety Time), and PICUD (Potential Indicator of Collision with Urgent Deceleration). Lateral SMoS like PET (Post-Encroachment Time) are used to predict risks in lane change controllers, intersections, and lateral maneuvers. Some SMoS have applications in both longitudinal and lateral driving scenarios, such as Time to Accident (TA), Conflicting Speed (CS), and Single-step Probabilistic Driving Risk Field. In terms of operational attributes, SMoS are divided into four groups: time-based (e.g. TTC and GT), distance-based (e.g. PICUD), deceleration-based (e.g. DRAC), and others (Lu et al., 2021). Additionally, SMoS indicators can be either continuous (TTC, DST, GT) or discrete (TA, CS, PET) in terms of time (Kathuria & Vedagiri, 2020).
Recent research identifies latent variables like driver anticipation associated with road geometric design that predict user behavior, in addition to interaction variables (Afghari et al., 2023). Sharp curves, a significant element of road geometry, globally contribute to frequent crashes. In the Netherlands, 4 out of 62 fatal crashes in 2019 are linked to sharp curves (Davidse et al., 2020).
Bike lane horizontal curves are categorized into four types: first curves (not influenced by a preceding curve), isolated curves (preceded and followed by a tangent), reverse curves (followed immediately by a curve in the opposite direction), and consecutive curves (succeeding in the same direction). Calculating the forces experienced by cyclists on these curves is crucial for optimizing bike lane designs. Ul-Abdin et al. (2020) developed an optimized bike lane system using theoretical trigonometric derivations to determine the optimal radius of curvature, considering centrifugal, centripetal, and gyroscopic forces, and accounting for variations in the center of gravity location—whether on the cyclists, the bicycle, or the connection point with the road. (Nee & Herterich, 2022) constructed a mathematical model of road cycling on various routes using the Frenet-Serret frame, revealing that braking before the point of maximum curvature is necessary to minimize centripetal acceleration, facilitating acceleration through pedaling out of a bend. Other studies have focused on velodrome cycling, creating predictive models to assess the power exerted by cyclists and the centripetal forces due to tire scrubbing and tipping during cornering (Bos et al., 2024).
This study prioritizes safety assessment for isolated curves due to their higher prevalence in a bike lane network and impact on users control and fall incidents as well conflicts between cylists and scooter users. It introduces the Surrogate Measure of Safety (SMoS) indicator ‘Effective Radius (EFR)’ using a dynamic tracking approach. This two-dimensional and trajectory-based measure, coupled with an innovative methodology, is valuable for identifying potential geometric design issues on bike lanes. According to the International Encyclopedia of Transportation (Laureshyn et al., 2016; Saunier & Laureshyn, 2021), ‘the validity of SMoS is the degree to which it measures what it is supposed to measure, that is, road safety or, in practical terms the expected frequency of crashes. While the goal is to have a clear and stable relation to the expected number of crashes expressed in mathematical terms, as of today the documented attempts to establish such relations are few and not always conclusive’. (Wang et al., 2021) highlight the importance of Surrogate Safety Measures (SSM) for traffic safety evaluation, particularly when reliable statistical safety models are unavailable. This is often due to complex site characteristics or nontraditional traffic safety treatments, where historical crash data is insufficient or nonexistent for developing predictive safety models.
In line with these definitions, EFR measure assesses the difference between the actual curve radius and the radius of user's motion footprint on curves. This allows us to identify where and to what extent lane violation and lane excursion occur, as well as the share of violations in each defined segment. In fact, EFR can measure safety risks for both free-riding assessments and for interaction assessment, when crash data for micromobility users becomes available.
The literature review indicates that road safety assessment studies utilizing dynamic tracking employ three data collection methods: observational (manual tracking, automated tracking), experimental (instrumented bikes, driving simulator e.g., CarSim, TruckSim, BeamNG), and GPS/GNSS (Global Positioning/Navigation Satellite Systems) tracking. Furthermore, methods for result analysis can be categorized into dimensionality reduction techniques (e.g., Principal Component Analysis), statistical models for count data (e.g., Random Parameters Negative Binomial Lindley Model, Mixed Multinomial Logit Model), and traditional count distribution models (e.g., Poisson, Negative Binomial). Additionally, approaches for analyzing reliability in naturalistic driving data and general regression models contribute to a comprehensive classification framework.
The observational tracking method involves discreetly recording users with video as they naturally move along their designated path. The camera placement ensures users are unaware of being recorded, allowing for the observation of their genuine riding/driving behavior. For video processing, researchers have employed semi-automated tracking software, such as Kinovea (version 8.26). (Kathuria & Vedagiri, 2020) utilized this software to investigate pedestrian and motor vehicle interactions through trajectory-based data acquisition. Kinovea is a reliable tool for distance measurement and trajectory-based analysis (Puig-Diví et al., 2019), offering adjustable video frame rates and 2D calibration through a ground reference for environmental coordinate transformation. With the progress of artificial intelligence, researchers are employing fully automated tracking through computer vision technology. (Gildea et al., 2023) integrated computer vision (CV) and artificial intelligence (AI) to predict and mitigate the risk of single bicycle crashes at cyclists-tram crossings. Their predictive model extracts safety-critical details from video data, improving proactive risk assessment for cyclists. (Arun et al., 2023) utilized artificial intelligence and safety field theory to analyze videos, estimating the risk and severity of crashes in road user interactions. Earlier, (Zaki & Sayed, 2013), introduced a framework for automating the clustering of trajectories through CV to predict future user positions.
Secondly, experimental studies often used instrumented bike/scooter, simulation software, and simulation laboratories. (Cavadas et al., 2020) introduced surrogate safety measures, predicting accident probabilities using Extreme Value theory. Their bivariate EV models extend existing methods, highlighting the significant impact of driver characteristics and road design on accidents, with a specific application to passing maneuvers. Simulation-based approaches are commonly using naturalistic data for verification. In 2019, Dhahir and Hassan analyzed combined GPS-based naturalistic driving and CarSim simulation data, determining failure probabilities and reliability indices for vehicle stability, driver comfort, sight distance, and vehicle rollover. They developed safety performance functions incorporating exposure variables, curve geometry, and reliability indices (Dhahir & Hassan, 2019). Other researchers used reliable simulation software to analyze how road geometry affects user dynamics (Afghari et al., 2023; Hossein Sabbaghian et al., 2015; Kordani et al., 2015). (Kordani et al., 2015) used dynamic simulation approach (CarSim and TruckSim), collected side friction, and lateral acceleration data of road users along horizontal curves when coincided with vertical sag curves.
The last data collection method involves real-time tracking of road users through their mobile phones, incorporating GPS. (Afghari et al., 2023) utilized a mobile application to gather individual free-flow speed profiles on selected freeway curves, obtaining High-Frequency Floating Car Data. The study correlated curve start positions with speed and deceleration/acceleration profiles, considering geometric features (horizontal radius, deflection angle, vertical grade, number of lanes, road width, superelevation, Stopping sight distance at curve start), operational factors (speed limit), and pavement characteristics (minimum measured friction coefficient). Results revealed a connection between driver anticipation, road geometry, and road ‘predictability’ as a latent variable applicable in a crash count model. (Chen et al., 2020) used bicycle app data to develop Safety Performance Functions (SPFs) for bicyclists at intersections.
Geometric characteristics of a bike-lane can affect safety for Micromobility (MM) users. Besides, MM users' behavior is still understudied (Vansteenkiste et al., 2013).In critical segments like sharp horizontal curves with restricted sight distance, risky behavior patterns of users such as lane violation, lane transgressing, and speeding, could lead to serious safety concerns.
Therefore, the objective of this study is to propose a naturalistic data-driven methodology to identify surrogate safety measures that can be used to assess safety on isolated horizontal curves. The proposed procedures can be applied to any curve case study with a larger sample size to draw conclusions about any objective factor that may affect safety of users of horizontal curve of a bike lane.
Methodology
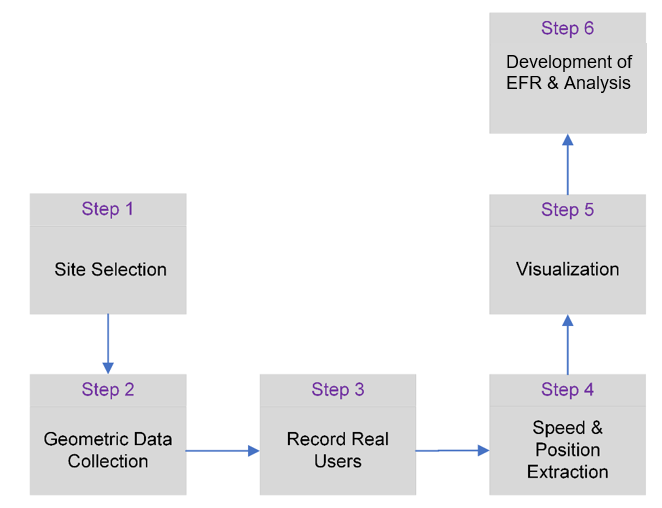
This study proposes a novel surrogate indicator for curve safety assessment, utilizing a naturalistic framework to track the speed and trajectory of micromobility (MM) users on bike lanes through motion analysis. An isolated sharp curve with critical geometry (small radius and sharp deflection angle) serves as the initial analysis focus, selected from a total dataset of 30 isolated curves collected during fall 2022 in Valencia, Spain. Figure 1 outlines the methodology in six main pillars, each with corresponding steps to be discussed in detail in the following sections.
Site selection
The initial steps in the motion analysis methodology involve selecting a case study site and collecting geometric data. Various curves with different degrees of curvature and radii are identified across all city divisions (northeast, northwest, southeast, and southwest) to ensure a representative stratified random sample of the entire network. Additionally, cases are chosen based on bike lane traffic volume to streamline data collection, enabling the recording of a sufficient number of users in a shorter time frame. The selected sites are labeled based on their location and order of selection. For example, the third site chosen in the northwest side of the city is named NW3. They are further classified into flat (>90 degrees), sharp (<90 degrees), and 90-degree curves. The details, including coordinates, are stored in an Excel file. Additionally, a kml file is generated, featuring all identified curves and the final selections, differentiated by colors. The map includes labels and information on the type of curves.
While the primary goal of this study is to illustrate the applicability of the proposed methodology through a single case study, achieving conclusive results requires the analysis of a more diverse set of cases from different divisions to enhance the robustness of our approach. It is crucial to emphasize that this methodology excludes other curve types, such as reverse curves and successive curves. In most cases, sharp and consecutive changes in deflection angles on these curve types pose challenges for bike lane users, leading to violations. Such curves are typically encountered when there are inevitable obstructions like bus stops, buildings, or trees along the bike lane.
Geometric data collection
After site selection, the subsequent step involves gathering precise geometrical data for the selected curves. To achieve this, the last orthophoto map of Valencia and the curve alignment creation tool in the Civil 3D CAD software are utilized. Freehand drawing, using the tangent-tangent (with curves) tool, is employed to sketch bike lane curves on the imported orthophoto. The created curve is then adjusted to align with the center line of the selected isolated curve on the bike lane. Subsequently, in the alignment grid view, geometric parameters of the created curve are extracted and recorded in the external Excel file established in the previous step. These parameters encompass curve radius, deflection angle, chord length, and degree of curvature.
Record real users
In the third step, naturalistic video data of bike lane users is collected using Garmin Virb Cameras and tripods. The wide lenses of the Garmin Camera facilitate a 360-degree coverage of the entire curve (HD 1080p) when placed near the bike lane. The Camera is also equipped with GPS that could capture position of the tripods at a frequency of 10 Hertz. The adjustable tripods, reaching up to 6 meters in height, have the camera fixed on top and are wirelessly controlled via Bluetooth. The tripods are strategically placed to offer a close-up view of the entire curve without drawing attention from users. This is monitored throughout the data recording by observing the gaze and head movements of passing users, and if it is determined that the camera attracts attention, it is relocated.
Speed and position extraction
The video data recorded in the third step must undergo undistortion before extracting the speed and position of the users. This is achieved using a Python script based on the OpenCV library and calibration parameters obtained from the camera. Subsequently, the undistorted videos are imported into Kinovea software for trajectory and speed extraction.
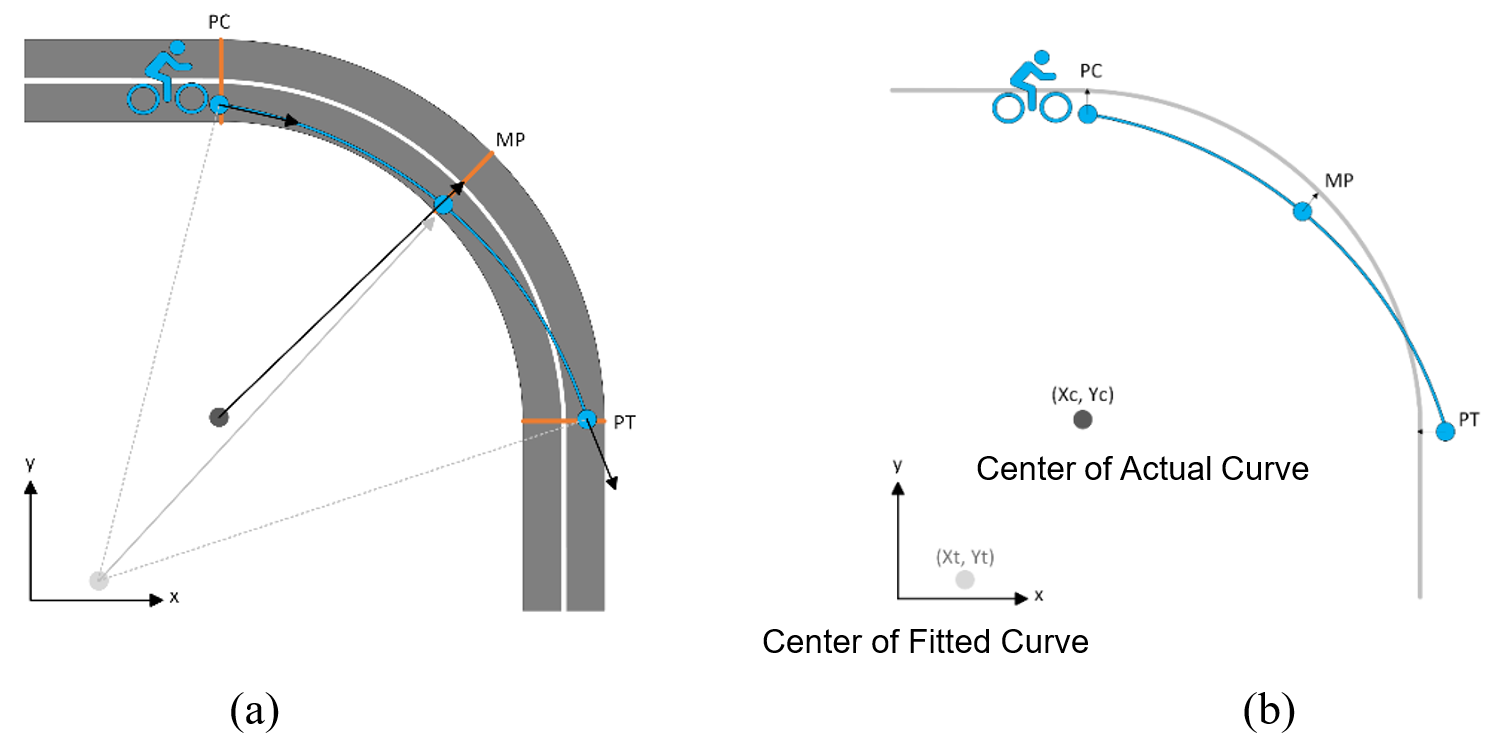
To monitor the lateral position and speed of Micromobility (MM) users, three specific points along the curve centerline were identified: Point of Curvature (PC), Midpoint (MP), and Point of Tangency (PT)(see Figure 2). These points act as crucial markers with specific coordinates and corresponding timestamps. These data is obtained from those users riding under free flow condition to shape and calculate effective trajectory curves and their corresponding radii based on actual user trajectories. Additionally, the directional movement on the curve is categorized into Left-Turn (LT) and Right-Turn (RT) movements, allowing for a comprehensive assessment of directional effects. In Figure 2, subfigure (a) shows the actual curve (white line) and fitted trajectory (blue line) passing through three points: PC, MP, and PT. Cyclists' directions and normal vectors are estimated from 3D to 2D video data. Subfigure (b) displays the actual curve's center (Xc, Yc) and the trajectory center (Xt, Yt), along with lateral distance vectors always perpendicular to the center line.
Visualization, analysis, and development of effective radius
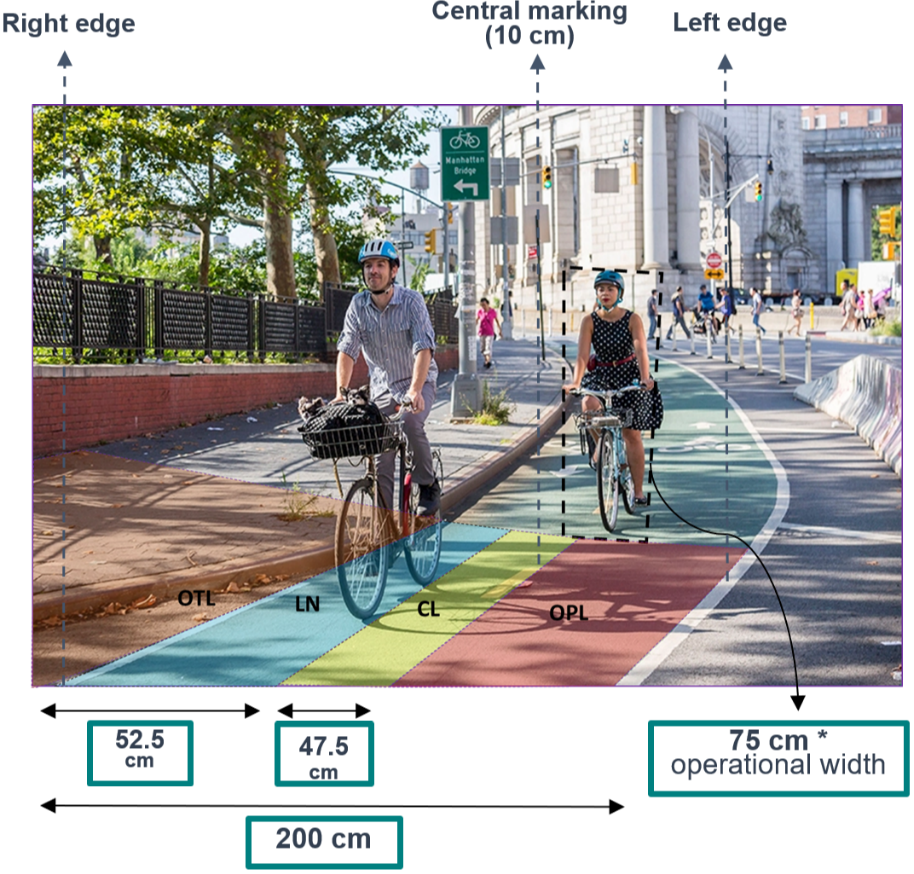
The coordinates and corresponding timestamps obtained in step 2.4 are utilized for estimating the effective radius and conducting speed analysis. In order to evaluate rider displacement and assess the risk of lane violations, four lateral regions of interest were segmented along the curve (see Figure 3): on the centerline (CL) with a ±47.5 cm buffer from each edge of the central marking (10 cm width), within the lane (LN), on the opposite lane (OPL), and outside the bike lane (OTL). The buffer selected for the CL region is based on the standard operational width considered for cyclists (75 cm), divided in half to account for users riding closest to each edge of the central marking and the potential for collisions with opposing users.
For speed analysis, the average speed of each user along the horizontal curve was calculated from observed speeds at specific points. Kinovea software tracked the lateral position coordinates (x, y) and speed of each user type (cyclists and e-scooterists) after grid system calibration using on-site references. Data from 74 users (50 cyclists and 24 e-scooterists) were used to derive effective radius, displacement heatmap, and speed patterns. Kinovea's reliability in evaluating motion patterns is supported by previous studies (Laureshyn et al., 2016; Wang et al., 2021).
Results
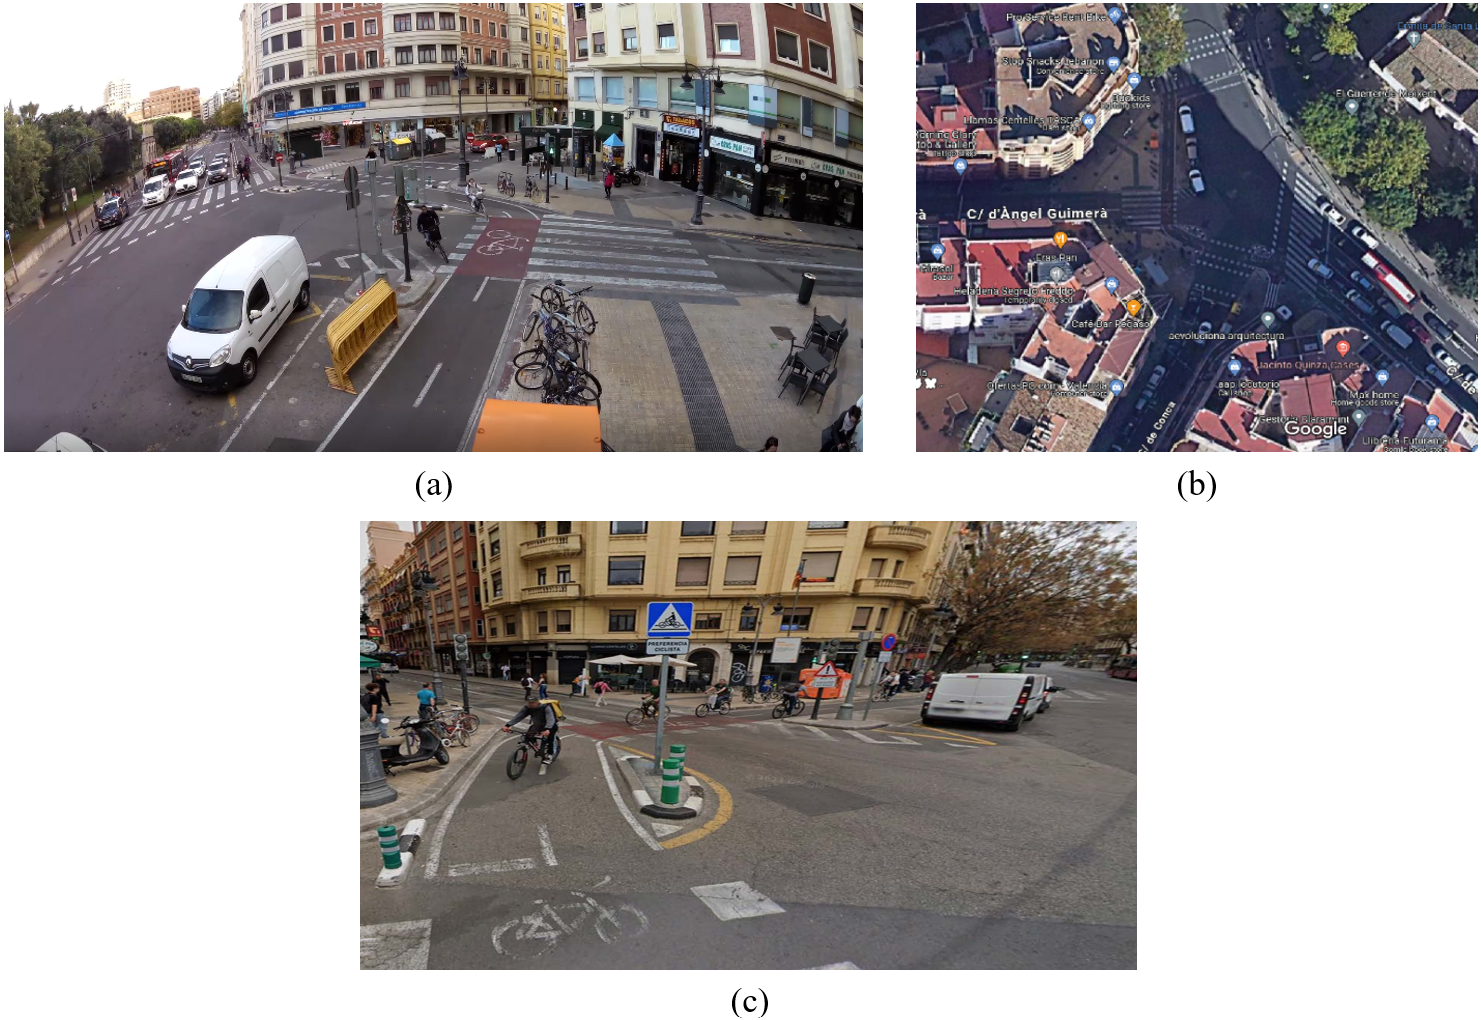
In this section, effective trajectory arcs and correlated displacement of bike users on Left-Turn (LT) direction are presented so as to prove the usefulness of the proposed methodology. Additionally, a comparison between both travel directions –Left-Turn and Right-Turn– is included to illustrate the differences of effective radius among different directions and user types. The selected curve site, labeled as SW1 (coordinates: 39.470317, -0.383590), and located in the southwest region of the city of Valencia (see Figure 4), has the following geometric characteristics: Radius = 5.11 meters, Deflection Angle = 70.5 degrees, Length = 6.3 meters, Degree of curvature = 341 degrees. The curve is positioned at a streetlight, and data were recorded only during green-light periods for cyclists to ensure the inclusion of free-flow movements.
Effective radius
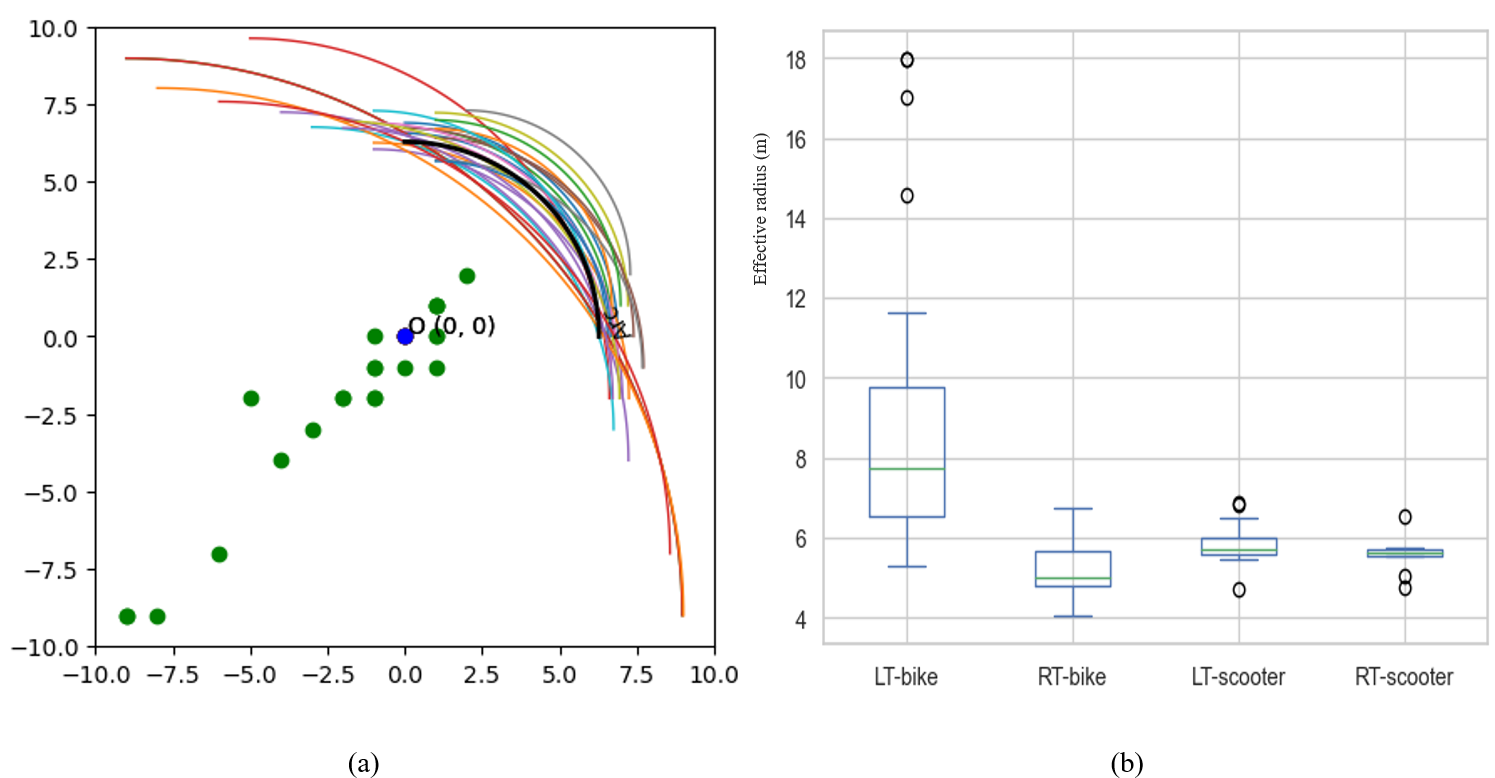
The effective trajectory arcs and their centers for the LT movement of bike users are illustrated in Figure 5a. The actual curve is represented by the black arc and blue center, while the colored arcs with their corresponding green centers demonstrate the effective curve for 25 bike users in that direction. In Figure 5b, a box-whisker plot is shown for both travel directions and types of users (25 users per type per direction), revealing a significant dispersion of the effective radius for LT movement. The dispersion can be attributed to bike lane-side conditions, particularly when lanes are situated on sidewalks, and in the LT, users tend to cut the curve and violate the opposite lane probably to maintain their speed or to distance themselves from nearby pedestrians. In this case study, for RT movement, due to the presence of segregator, users were tending not to violate their lanes, as it could leave them with no space to maneuver in case of encounter maneuvers. Accordingly, cyclists exhibit larger lateral acceleration, role angles, and steering angles comparing to e-scooters (Dozza et al., 2022). This can explain why e-scooterists had similar patterns regardless of their travel direction. The roll angle refers to the tilt of a vehicle's body about its longitudinal axis, while the steering angle describes the direction the wheels are turned relative to the vehicle's straight-ahead position.
Lateral displacement
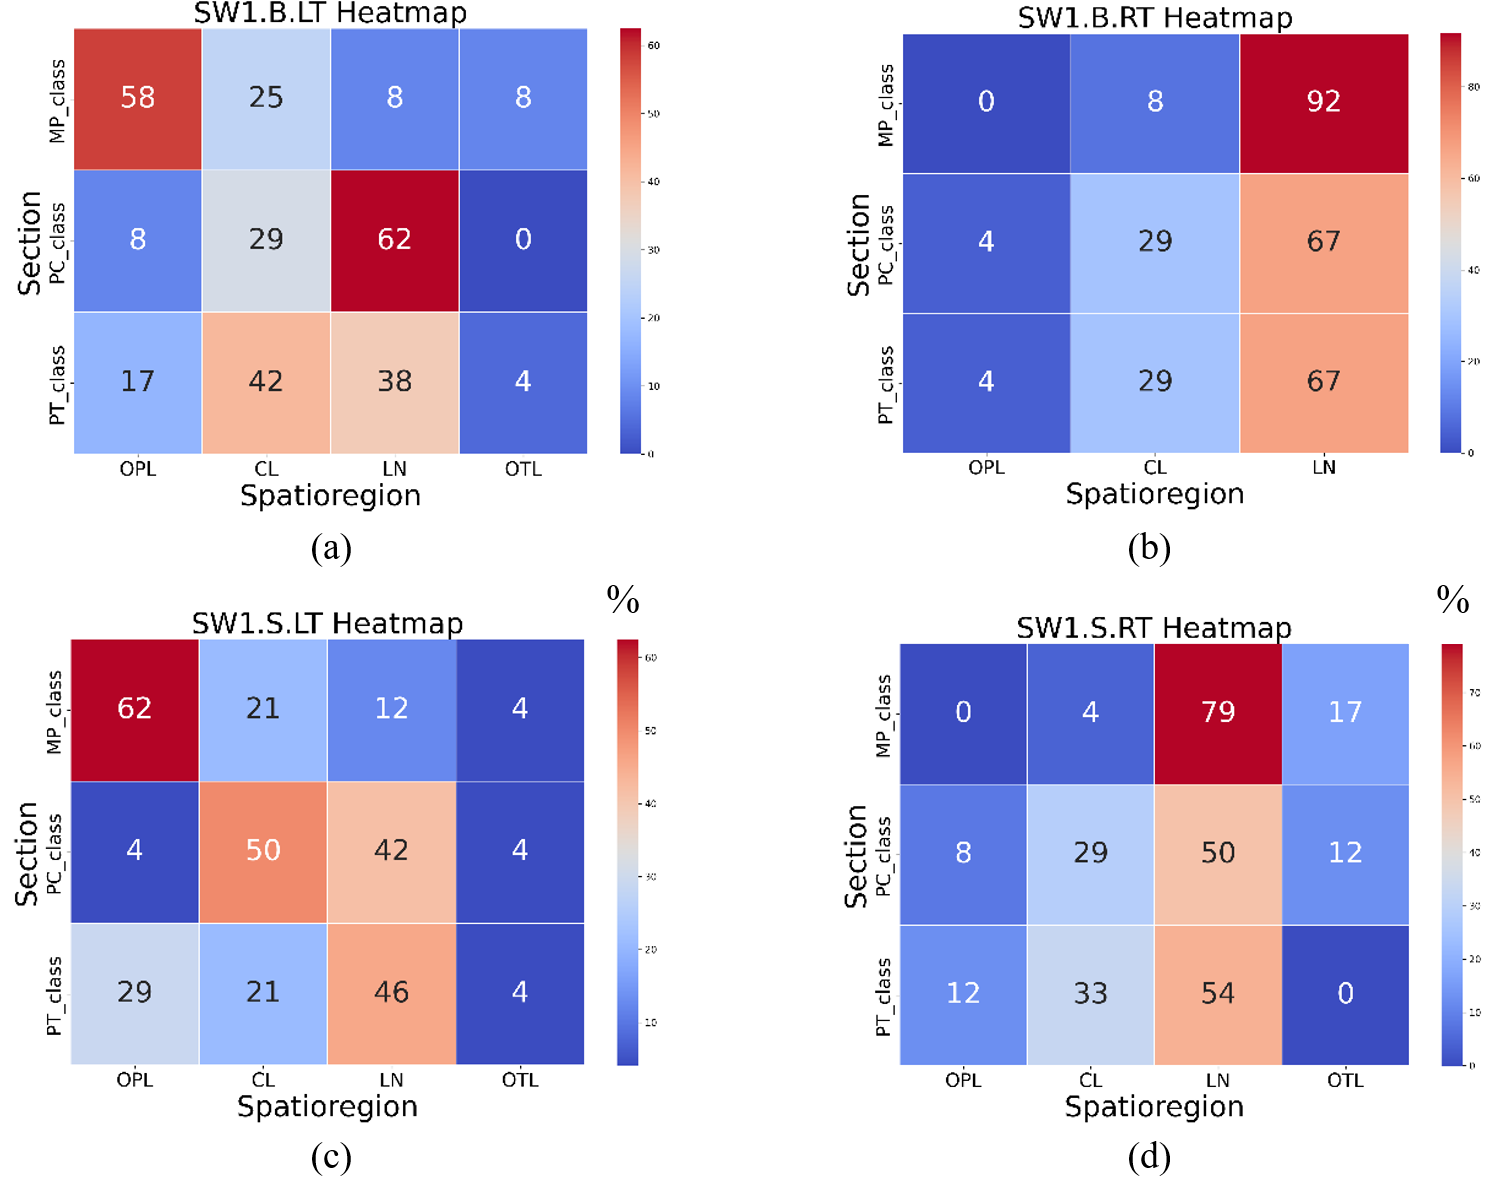
A heat map is created from observed MM user displacements relative to the centerline at key points (PC, MP, and PT). Displacements are categorized into four regions: on the center line (CL), within the lane (LN), on the opposite lane (OPL), and outside the bike lane (OTL). Figure 6 displays a heatmap where the Y-axis represents PC, MP, and PT sections, and the X-axis indicates the defined regions of interest on the bike lane. It visualizes the proportion of micromobility users in these regions through a curve.
Results show that the highest displacement of bike users to the opposite lane in the left turn (LT) direction occurred at MP (Figure 6a and Figure 6c), with above half of users veering into the opposite lane. The variation in effective radius could primarily be influenced by the geometry and users' desire to maintain their speed, as well as by the perception of free-riding users on crossing segments parallel to pedestrians' crosswalks. Conversely, over 70% of users at MP stayed in their lane during right turns, with cyclists showing the highest compliance at 92% (Figure 6b and Figure 6d). This indicates that users navigating inside the curve adhered to their lanes better than those on the outside (left-turn). However, 17% of right-turning scooter users at MP left the bike lane, increasing their risk of conflicts with cars or solid objects. In the CL region, scooters were more prone to crossing conflicts on PC, particularly during left turns (50% on PC). Overall, scooter behavior on this curve is riskier, making them more vulnerable to head-on and crossing conflicts, and collisions with cars, trees, and pedestrians.
Speed analysis
User speeds in the sections of interest were estimated using Kinovea, based on time stamps and distances between segments. Table 1 provides a descriptive analysis of these speeds by section. The standard deviation indicates that left-turn cyclists have up to six times more deviation from the mean speed across all sections. The highest 85th percentile speed among cyclists is in the PT section. For scooters, the MP section is more critical, with most right-turn users exceeding 20 km/hr and a maximum speed of 42 km/hr.
|
|
Speed.PC |
Speed.MP |
Speed.PT |
|||||||||
|---|---|---|---|---|---|---|---|---|---|---|---|---|
|
|
Bike-LT |
Bike-RT |
Scooter-LT |
Scooter-RT |
Bike-LT |
Bike-RT |
Scooter-LT |
Scooter-RT |
Bike-LT |
Bike-RT |
Scooter-LT |
Scooter-RT |
|
Median |
15.000 |
11.000 |
15.000 |
13.000 |
19.000 |
13.000 |
13.000 |
14.000 |
23.000 |
12.000 |
15.000 |
14.000 |
|
Mean |
16.000 |
11.000 |
15.040 |
14.680 |
19.800 |
13.600 |
14.520 |
16.520 |
23.640 |
11.520 |
14.520 |
16.160 |
|
Std Dev |
6.076 |
1.225 |
3.942 |
4.327 |
6.621 |
2.986 |
5.796 |
7.832 |
6.855 |
2.002 |
4.602 |
4.598 |
|
Variance |
36.917 |
1.500 |
15.540 |
18.727 |
43.833 |
8.917 |
33.593 |
61.343 |
46.990 |
4.010 |
21.177 |
21.140 |
|
Minimum |
8.000 |
9.000 |
8.000 |
9.000 |
8.000 |
9.000 |
9.000 |
8.000 |
12.000 |
8.000 |
8.000 |
11.000 |
|
Maximum |
28.000 |
32.000 |
42.000 |
24.000 |
33.000 |
19.000 |
30.000 |
42.000 |
32.000 |
16.000 |
23.000 |
29.000 |
|
85th percentile |
22.000 |
12.000 |
19.000 |
20.400 |
27.200 |
17.400 |
18.000 |
22.400 |
31.000 |
13.000 |
19.800 |
19.800 |
|
|
||||||||||||
According to the Dutch design manual for bicycle traffic (CROW), the design speed for a bike lane curve with a 5-meter radius (our case study) is 12 km/hr. Table 1 shows that, except for right-turn cyclists, the 85th percentile speeds of all users exceed this design speed, in one case by up to 15 km/h (bike LT on MP). Currently, there are no speed limit signs to enforce lower speeds on these curves, and even the general speed limit of 20 km/hr is frequently violated by cyclists (see Table 1). For instance, during a left turn, the 85th percentile speed was around 27 km/hr in the middle of the curve. These findings highlight the urgent need for speed control strategies by enforcement and signage for micromobility.
Speed-EFR correlation
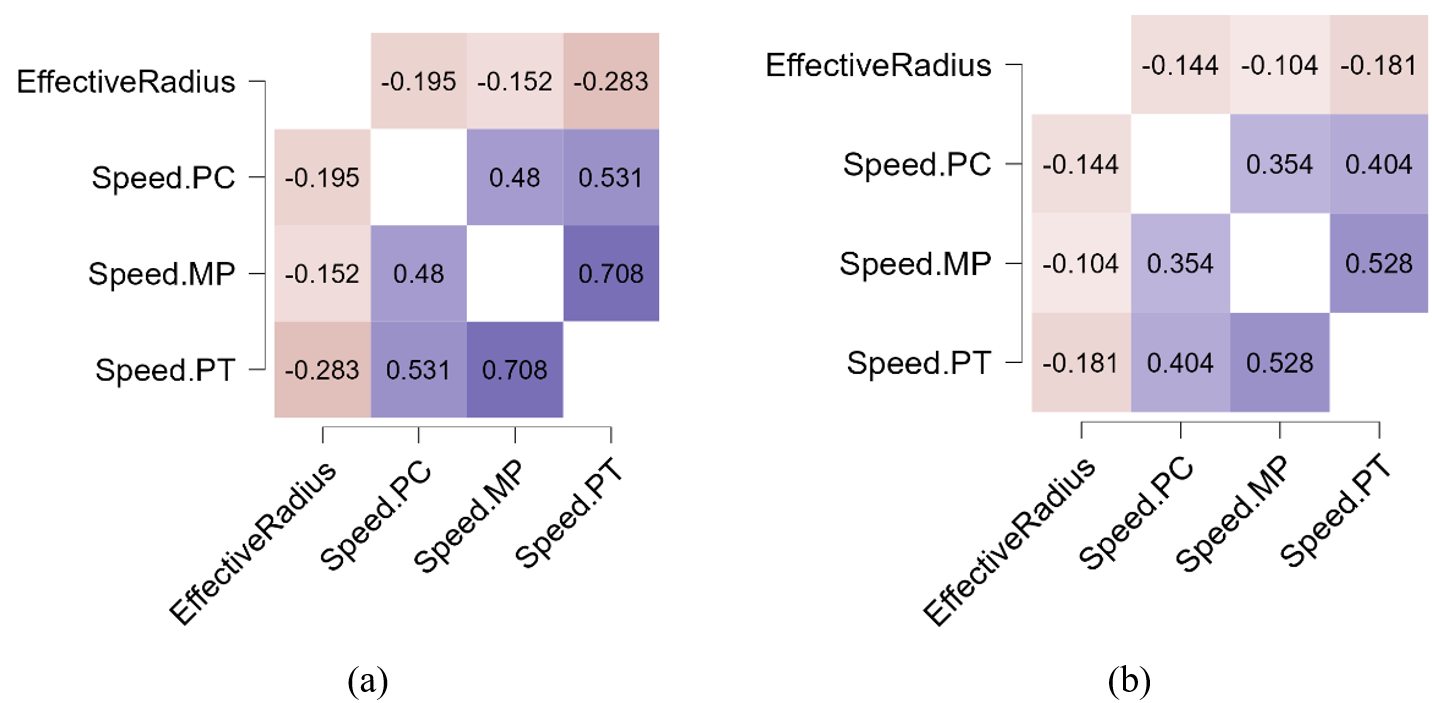
To assess any correlation between EFR and speed, a statistical correlation analysis was conducted in JASP (version 18.3). Due to high dispersion and non-normality, two non-parametric methods, Spearman and Kendall, were employed. Spearman's rho and Kendall's tau B are robust methods against non-normal data and enable capturing monotonic relationships between variables, with Spearman's rho being more sensitive to large deviations and Kendall's tau B placing equal weight on all discordant pairs, thus providing complementary perspectives in analyzing the correlations. The results revealed statistically significant negative correlations between speeds and EFR on the PT section (see Table 2). This suggests that as EFR increases, speed on PT could decrease, and vice versa. Figure 7a and Figure 7b depict correlational heatmaps for each method, providing a visual representation of these findings.
|
Pearson |
Spearman |
Kendall |
||||
|---|---|---|---|---|---|---|
|
r |
p |
rho |
p |
tau B |
p |
|
|
EffectiveRadius - Speed.PC |
0.117 |
0.245 |
-0.195 |
0.051 |
-0.144 |
0.042 |
|
EffectiveRadius - Speed.MP |
0.123 |
0.223 |
-0.152 |
0.132 |
-0.104 |
0.140 |
|
EffectiveRadius - Speed.PT |
0.029 |
0.775 |
-0.283 |
0.004 |
-0.181 |
0.010 |
|
Speed.PC - Speed.MP |
0.507 |
< .001 |
0.480 |
< .001 |
0.354 |
< .001 |
|
Speed.PC - Speed.PT |
0.555 |
< .001 |
0.531 |
< .001 |
0.404 |
< .001 |
|
Speed.MP - Speed.PT |
0.653 |
< .001 |
0.708 |
< .001 |
0.528 |
< .001 |
Discussion
In this section, the proposed method is compared with other methods, and the advantages and disadvantages of each are discussed. Two major aspects of the proposed method are using naturalistic video data and employing computer vision software to extract user motions from the videos.
With advancements in Artificial Intelligence (AI) and Computer Vision (CV), researchers assessing micromobility safety increasingly use these technologies to automate user tracking and extract detailed operational parameters. The computer-based software (Kinovea) used for this study has been validated in many previous research with similar objectives (Kathuria & Vedagiri, 2020; Paolino & Zampa, 2023). These studies mainly focused on users' motion parameters, including the speed, acceleration, deceleration, lane changing, and trajectory, to proactively assess risky movements by observing naturalistic maneuvers. In such studies, users are unaware they are being recorded, allowing for the assessment of genuine behavior. However, this approach faces legal limitations. In some countries, identity protection laws require researchers to apply for permissions limited to certain areas or prohibit the use of regular cameras. Instead, thermal cameras may be required to protect users' identities.
There are also studies using surveillance camera data and computer vision to address traffic congestion. A significant difference between these studies and the proposed method is that users are usually aware they are being recorded, often warned by signage about the presence of cameras. For example, in a study on road congestion surveillance by (Rodríguez-Esparza et al., 2024), an optimized algorithm was used to automatically detect, segmentize, and post-process video data of traffic surveillance cameras.
Another aspect that differentiates this method from others is whether the objective is to assess solely the users' motion or their interactions. This study focuses on the motion tracking of individual users under free-riding conditions, wherein the dynamic response (trajectory) of each individual users is calculated, visualized and statistically compared. In this process, the EFR is compared with the actual curve radius and risky maneuvers and their frequency are identified. The idea of the method was inspired by a recently established method known as movement-based safety analysis, which involves more accurate estimation of time-based interaction measures, such as Time-to-Collision (TTC) and Post-Encroachment Time (PET), during near-miss scenarios (Nabavi Niaki et al., 2019). Interaction-based studies primarily concentrate on refining algorithms for automated data extraction. For instance, a recent study by (Gildea et al., 2023) a cyclist tracking algorithm was introduced, employing computer vision (CV) to evaluate single bicycle crashes (SBC) or falls (SWOV, 2023). This algorithm integrates three main components: object detection to identify bicycle position and orientation, semantic segmentation to delineate bicycle and rider, and human pose estimation for assessing rider posture and lean angle.
Other studies fall into two categories: semi-naturalistic and simulation-based approaches. These approaches predominantly employ instrumented devices like sensors, cameras, and simulators with virtual reality capabilities to evaluate bike lane safety. In a recent study by (Almallah et al., 2024), a simulator was used to evaluate different on-road cycling lane layouts, finding that colored lanes improve safety on left alignment curves, while uncolored lanes are safer for straight and right curves. Another study combined traffic simulations with instrumented bicyclists, observing their behavior in different road conditions (Johansson, 2023). (Shoman et al., 2023; Uijtdewilligen et al., 2023) analyzed data from instrumented city bicycles to study user behavior, demographics, perceptions, and dynamics. They introduced behavioral risk indicators (BRIs) based on user perceptions and experiences rather than trajectory analysis, focusing on speed and surveys regarding bike lane conditions and interactions.
Finally, it should be noted that the main limitation of this study is the lack or nonexistence of crash data on conflicts between cyclists, scooters, and fall incidents. Therefore, EFR is initially designed to pinpoint individual risky behavior patterns (free riding), demonstrating that a practical and fast safety risk assessment can be performed even without crash data. EFR is considered useful because many injuries among micromobility users result from unreported falls, often due to user riding behavior influenced by design. To assess the safety of a design regarding falls, individual user motion must be studied before examining interactions between users. This means that our big data that in proactive safety assessment had included near-misses and historical crash data, will now also include individual risky maneuvers. This will increase the accuracy of the overall assessment. EFR helps evaluate the risk of individual motions (free riding) to estimate fall risk, even before considering crash data. With advancements in big accident data collection, such as using CAVs, crash data can eventually be incorporated to optimize assessments. At this stage, EFR is specifically designed to address conflicts between micromobility users and objects/pedestrians on sidewalks during curve navigation, rather than conflicts with cars. Therefore, relevant accident data to associate with EFR will involve only micromobility users and pedestrians.
Conclusions
The methodology presented in this study introduces a innovative surrogate indicator for curve safety assessment, utilizing a naturalistic framework to monitor the speed and trajectory of Micromobility (MM) users on bike lanes. Focusing on isolated sharp curves with critical geometry, this approach provides valuable insights into user behavior and risk factors. It also facilitates the exploration of additional safety variables and graph visualizations in future studies, thereby advancing curve safety assessment for micromobility users. Employing visualization techniques like trajectory plans, heat maps, and box-whisker plots, this method uncovers crucial insights into lane violations and collision risks. The segmentation and graphs utilized offer a deeper understanding of user behavior's cause and spatio-temporal data as they navigate through the curve. In summary, this method effectively assesses curve safety, highlighting potential collision hotspots and speed-related risks. Furthermore, the adaptability of this approach allows for its application to diverse environmental features, enabling future studies to explore additional safety variables and graph visualizations. Overall, the methodology presented here demonstrates promise in advancing curve safety assessment for micromobility users.
The main limitation of this study was the lack of crash data related to conflicts between cyclists, scooters, and fall incidents. The authors believe that with access to such data, a significant extension of this study could involve associating these data with the proposed EFR measure. This would optimize the safety assessment and help identify the most critical black spots.
Declaration of competing interests
The authors declare that they have no known competing financial interests or personal relationships that could have appeared to influence the work reported in this paper.
Funding
This study has received funding from the Ministry of Science and Innovation in Spain under the number MCIN/AEI/10.13039/501100011033.
CRediT contribution statement
Morteza Hossein Sabbaghian: Conceptualization, Data curation, Formal analysis, Investigation, Methodology, Validation, Visualization, Writing—original draft, Writing—review & editing.
David Llopis-Castelló: Conceptualization, Methodology, Supervision, Writing—review & editing.
Alfredo García: Conceptualization, Methodology, Supervision, Writing—review & editing.