Keep me safe—evaluation of safety perception of different bicycle facilities
Guest editor: Ragnhild Davidse, SWOV Institute for Road Safety Research, the Netherlands
Reviewers: Paul Schepers, Rijkswaterstaat, the Netherlands
Aslak Fyhri, Institutes of Transport Economics, Norway
Received: 31 January 2024; Accepted: 12 November 2024; Published: 17 December 2024
Abstract
Bicycle traffic constitutes a central aspect of present and future inner-city traffic. Therefore, cyclists' safety is increasingly the focus of research. A current discussion is whether a structural separation between bicycle and motorized traffic using light segregation improves road safety and the perceived safety of cyclists compared to a design using markings or other forms of light segregation. The field study was conducted on a street in Zurich that is a source of conflict for cyclists with motorized traffic by implementing four different forms of light segregation and examining their influence on the safety assessment. The (1) colored bicycle lane was supplemented by (2) a continuous line, (3) light segregation that still allows cyclists or cars to ride over them (discs), and (4) light segregation with guide beacons that do not allow cyclists nor cars to ride over them. A video-based traffic analysis was conducted for each stage to assess the conflicts between cyclists and motorized traffic. Regarding safety perception, cyclists were asked before and after each conversion about their general safety assessment and perception of the specific street section. Moreover, the conversions were presented to participants via pictures before they were implemented in order to assess if a safety assessment based on pictures is comparable to a perceived safety perception in reality. Objectively, fewer adaptive actions were recorded for all three conversions compared to the initial design. Significant differences were found between the conversions regarding perceived safety, with the light segregation using discs being rated as the safest. The safety assessment based on pictures, however, revealed no significant differences. These results are a basis for further research on safety assessments and the relationship between objective and subjective safety for cyclists.
Keywords
bicycle lane, expected safety, perceived safety, traffic safety
Introduction
Bicycle traffic is essential to the environmental mobility transition, reducing pollution (Maizlish et al., 2013) and helping to avoid traffic congestion (Hamilton & Wichman, 2018). However, cars have been at the center of attention for a long time, dominating the space on the streets. Recently, many cities have started investing in better infrastructure for cyclists to increase the attractiveness of cycling and to reduce the likelihood of road accidents involving cyclists (Félix et al., 2020; Reichel, 2012).
A common investment is the usage of light segregation, which is defined as ‘[...] the use of physical objects intermittently placed alongside a cycle lane marking to give additional protection from motorized traffic’ (Transport for London, 2014). Different pilot studies investigated the impact of light segregation on various aspects of cycling, such as willingness to cycle in London (Aldred & Dales, 2017) or road user behavior in Christchurch (Koorey et al., 2013).
So far, there is no international standard for light segregation. Therefore, the light segregation forms differ between projects as does the rest of the infrastracture surrounding the bicycle lane. Successful implementation of light segregation in one part of the city does not necessarily mean that it will be suitable for another city or even another place in the same city or even for another city because many aspects, e.g. the composition of traffic from different road users or the different road designs have to be considered.
In the following, we describe the impact of different forms of light segregation at a critical intersection in Zurich on subjective and objective safety.
Study context
In 2020, the inhabitants of Zurich, the most populous city in Switzerland, voted for a more bike-friendly infrastructure. The goal is for cyclists to be able to bike with priority on a network of 130 km throughout the town before the year 2030. However, one requirement was that most of the projects have to be implemented on the existing roads without increasing the road width or building new roads (Stadt Zürich, 2023).
Since 2020, various measures have been taken to improve the quality and safety of cycling, e.g. removal or relocation of parking spaces, signalizing routes, and making them visible with markings or changes to the right-of-way regulations at road junctions. On many sections of the preferential cycle routes, the speed limit is 30 km/h, and car traffic is reduced to increase cyclists' safety. In challenging sections, research is carried out on how this specific section can be improved to increase the safety of cyclists and their perceived safety. One of these challenging sections is addressed in the current study.
Related work
Cyclists must be and are deemed to feel safe to increase the share of cycling in overall traffic. However, since objective and subjective safety do not necessarily correlate (Elvik & Bjørnskau, 2005; Hackenfort, 2012), it is relevant to investigate both aspects before deciding on a specific design. Various studies indicate that the perception of safety is an essential factor regarding the social transition to a higher share of cycling in traffic, especially in emerging cycling cities (Heesch et al., 2011; Kaplan & Prato, 2016; Rondinella et al., 2012). If cyclists generally feel unsafe, they might bike less than they would under different circumstances (Götschi et al., 2016) or even develop cycling avoidance (Chataway et al., 2014). Overestimations of risk, i.e. people feel unsafe, although objectively it is safe, can cause people to be more or even too alert and attentive to the traffic around them. While these cases usually are not a safety problem, the reverse scenario is far more critical: a traffic spot is considered safe although being objectively unsafe; cyclists might then not pay as much attention as needed (Ghielmetti et al., 2017; Hackenfort, 2012; Klebelsberg, 1982; Petermann et al., 2008).
Cycling lanes are generally considered a good choice for reducing the accident rates of cyclists (Park et al., 2015; Pulugurtha & Thakur, 2015), especially if these lanes are wide enough for cyclists to overtake each other. Internationally, colored cycling lanes are used to draw attention of motorized traffic in potential conflict zones (Autelitano & Giuliani, 2021; Fyhri et al., 2021). Furthermore, in some countries, such as Switzerland or Belgium, the red color is used to remind motorized traffic that these areas are primarily for cyclists. However, Autelitano and Giuliani (2021) summarize that it takes more than coloring cycling lanes for cyclists to feel safe.
Accident statistics are often considered to determine the objective safety for cyclists on different infrastructures (Chen et al., 2012). However, at least in dedicated traffic spots, accidents are statistically rare and, therefore, not considered reliable (Smith, 1976). Additionally, accident statistics typically underestimate the accurate number of cycling accidents by far (Hertach et al., 2022; Winters & Branion-Calles, 2017) because less severe accidents or incidents are often not recorded by the police. Therefore, other traffic safety parameters are increasingly considered, such as near misses or conflicts (Steiner et al., 2023). Traffic conflicts are events that are sufficiently close to real crashes (Tarko, 2018). Video-based traffic analysis has become a standard tool for recording traffic conflicts (Beitel et al., 2018; Kronprasert et al., 2021). Nevertheless, the data is difficult to interpret due to a lack of standards and dependencies on road design (Steiner et al., 2023).
While there is ample evidence regarding the impact of adequate cycling infrastructure on increasing cyclists’ safety, the effects of specific cycling lane design on safety perception are understudied, as different researchers point out (Chaurand & Delhomme, 2013; Rietveld & Daniel, 2004; Schepers et al., 2014; von Stülpnagel & Binnig, 2022). Moreover, as infrastructure differs significantly between countries or even cities, so do influencing factors such as speed limits for motorized traffic (Pulugurtha & Thakur, 2015), traffic density (Parkin et al., 2007) or the behavior of motor vehicles (Henson et al., 1997). While the participants of a US study rate cycling lanes almost as uncomfortable as biking on a street without any cycling infrastructure (Foster et al., 2015), in a study carried out in Germany, participants rated cycling on cycling lanes far less dangerous than cycling on a street without a cycling lane (von Stülpnagel & Binnig, 2022).
von Stülpnagel and Binnig (2022) investigated which factors and which design combinations contribute to the subjective safety of cycling lanes. In an image-based online study, they manipulated different factors such as lane surface (green vs. same tarmac as the street), lane width, left cycling lane buffer, such as dashed lines, continuous lines, and physical separations. The authors found that structural separation is perceived as safer than cycle lanes without separation, which is in line with findings from Foster et al. (2015) and McNeil et al. (2015). Both studies collected their data in the US, which has a substantially different urban infrastracture than Switzeland has. In the latter, due to limited available space, the separation of traffic lanes for cyclists, tramways, motorized traffic, and pedestrians is not always possible. Therefore, a study based on a more condensed road design was deemed to be necessary.
Furthermore, like Foster et al. (2015), von Stülpnagel and Binnig (2022) collected the data based on pictures, which might differ from assessments that are collected in real traffic. For this reason, this study additionally aimed to compare the prospective assessment based on images with those assessments of the same situations in real traffic.
Therefore, in this field study, different designs of a cycling lane at a challenging road section are investigated regarding (1) their objective safety based on recorded conflict using video-based analysis, (2) the perceived, and (3) expected safety (based on pictures presented at the first interview).
Based on that, the following research questions were addressed:
1) Does light segregation with discs or guide beacons decrease the number of adaptive actions between cyclists and motorized traffic
2a) Are there any differences in the subjective safety assessments based on these conversions?
2b) Which form of separation is considered the safest by cyclists?
3) To what extent are the expected safety assessments based on pictures comparable to the perceived safety assessment when the conversions are in place?
Method
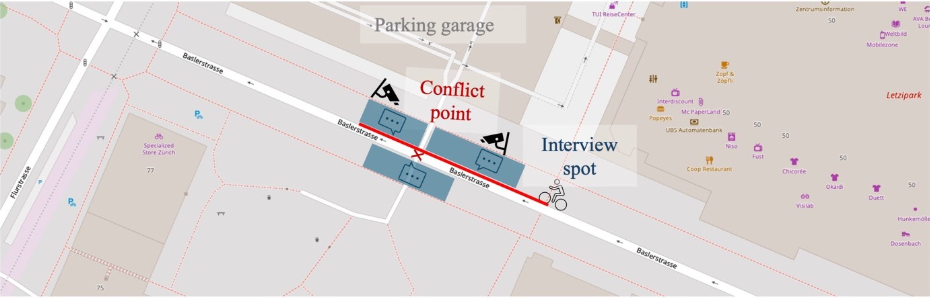
The decision-makers of Zurich focused on the investigated road section due to the concerns raised by cyclists: On the Baslerstrassse, there seemed to be many conflicts between cyclists and motorized traffic close to the shopping mall, Letzipark. Motorized traffic has to cross the bicycle lane and the pavement when entering or leaving the parking garage (Figure 1). Entering the cycling lane might cause conflicts with cyclists who ride along the street straight ahead. To the date of the study, motorized traffic enters the parking garage from both directions. Still, for the most part, conflicts appear with vehicles turning right into the garage, notwithstanding a sign on the right side of the street that is supposed to draw motorists’ attention to cyclists.
The speed for motorized traffic was limited to 30 km/h. A two-meter-wide cycling lane was already marked on the road section in question to alert motorized traffic when entering the parking garage. Red markings are used in different parts of the city to highlight critical traffic points. Therefore, both cyclists and motorized traffic users should be used to it.
City representatives chose the other three options investigated in the following.
In the first step, video capturing was used to identify the extent of the existing conflicts; only after the recordings were done were the first interviews carried out.
Study design
In order to avoid conflicts of interest, the investigating scientists were not involved in the decision-making process of determining the area of interest. Three conversions were in place for one each month over the spring and summer of 2022. The three conversions were: (1) continuous line that is forbidden to cross for motorized traffic under penalty. Therefore, the continuous line was interrupted in two short sections to allow access to the parking garage. (2) Light segregation using additional discs. These elements can be driven over both by cyclists and motorized traffic. And (3) light segregation with guide beacons, which might break if motorized traffic hits them. The aforementioned conversions are shwon in Figure 2.
With respect to research questions 1 and 2, a between-subject design was applied with four experimental conditions. As dependent variables, the recorded conflicts were used to describe objective safety, while the interview questions were used to assess perceived or expected safety. Regarding research question 3, a within-subject design was chosen.
The interviews were conducted three to four weeks after the conversion so bicyclists could get familiar with the new design before they were interviewed. The video recordings took place outside of the interview times. Days with good weather conditions without rain were generally chosen to reach as many participants of the opportunity sample as possible.
Video-based traffic analysis
The video recordings were carried out during all stages on a total of six weekdays (Monday to Saturday) with a focus on peak traffic times so that the evening peak of shopping traffic from Monday to Friday between 4 pm and 7 pm and the shopping traffic on Saturday between 9 am and 7 pm were covered. Two programmable recording devices collected the traffic movements in the entrance/exit area of the parking garage from different perspectives.
The video recordings of 9 hours per stage were evaluated quantitatively and qualitatively following each survey. The quantitative analyses included the determination of traffic volumes using semi-automated techniques. The qualitative analysis focused on the cyclist categorized into (1) the bike passed through without encountering a motor vehicle intending to cross the cycle lane. (2) The bike passed a motor vehicle that intended to cross or actually crossed the cycle lane while no adaptive action of the cyclist (e.g. braking, swerving) was necessary. (3) The bike passed a motor vehicle that intended to cross or actually crossed the cycle lane while an adaptive action of the cyclist (e.g. braking, swerving) was observed. The latter condition was interpreted as a conflict (see examples in Figure 3).


Interviews
The city police supported the interviewers by stopping the cyclists. The cyclists' participation in the interviews was voluntary; the police officers were not involved in the questioning in any form. There were no exclusion criteria for participation, so every cyclist passing the site was stopped. All interviewers were wearing safety vests, which identified them as researchers of the university ZHAW.
Questionnaire
Due to practical considerations, the questionnaire was kept as short as possible. Besides demographics, the participants were asked about their driving behavior, general safety perception as a cyclist, experience with the specific road section, and current safety perception. Additionally, during the first interview period, the cyclists were asked about the expected safety of the three conversions using a photo montage to answer research question three (see translated questionnaire in Appendix A). All safety-related questions were asked on a six-point Likert scale (1 ‘very unsafe’ to 6 ‘very safe’).
Participants
Table 1 shows the demographics of the interviewed bicyclists. Around three-quarters of the interviewees stated they use their bikes daily.
|
Trial |
N |
Daily ride (%) |
E-bike use (%) |
|---|---|---|---|
|
Regular bike lane |
96 (35% f, 64% m, 1% n.s.) |
75 |
31 |
|
Continuous line |
124 (33% f, 67% m) |
73 |
28 |
|
Discs |
112 (45% f, 55% m) |
68 |
31 |
|
Guide beacon |
117 (32% f, 62% m, 6% n.s.) |
76 |
22 |
f = female; m = male; n.s. = not specified
In Table 2, the age distribution of the participants is presented. We interviewed drivers of both traditional bicycles and e-bikes. Every interview took about five minutes.
|
Trial |
N |
|||
|---|---|---|---|---|
|
< 20 y |
20–39 y |
40–59 y |
60+ y |
|
|
Regular bike lane |
4 |
53 |
32 |
7 |
|
Continuous line |
9 |
62 |
41 |
10 |
|
Discs |
8 |
51 |
43 |
10 |
|
Guide beacon |
0 |
64 |
47 |
3 |
y = years
Analysis
Differences in the objective safety in the form of comparing the recorded adaptive actions such as braking or swerving were analyzed with an ANOVA.
For the expected safety based on images, a repeated measurement ANOVA was used because all participants at the first interview rated all three conversions based on images.
An ANCOVA was used to investigate differences in perceived safety differences in real traffic. It is expected that general safety perception in Zurich and general safety perception on bicycle lanes influence the rating, which is why we added them as covariates.
A logistic regression was carried out to investigate factors influencing perceived safety, including the design. Therefore, the safety assessment as the outcome variable was converted into a binary variable, comparing those who rated the current situation as very safe (6 on the Likert scale) compared to the rest. This re-coding was chosen because very high scores were generally reached, and we wanted to distinguish those who felt very confident from the others. Moreover, this came close to a median split.
Results
Objective safety—recorded adaptive actions
Video-based traffic analysis was applied to address the first research question of whether light segregation with discs or guide beacons decreases the number of adaptive actions between cyclists and motorized traffic. For the initial situation with the original colored bike lane (Figure 2, picture A), it was revealed that 20% of the interactions with motorized traffic were linked to an evasive action (Figure 4, Table 3). Exposure-relative, most of the cyclists' adaptive actions were seen when the motorized traffic turned right to enter the parking garage.
Results of an ANOVA show that the conversions, in general, led to significantly fewer recorded adaptive actions (F (3, 1 529) = 8.869; p ≤ .001). Due to a significant Levene`s test, the Brown-Forsythe correction was applied. Post-hoc tests were significant for all three conversions compared to the initial situation: continuous line (p ≤ .001), discs (p ≤ .001), and guide beacons (p ≤ .001). However, the three conversion conditions did not differ from each other.

|
Conversions |
N encounters |
N encounters with a.a. |
|---|---|---|
|
Regular bike lane |
303 |
60 |
|
Continuous line |
377 |
35 |
|
Discs |
418 |
36 |
|
Guide beacons |
435 |
43 |
a.a. = adaptive actions
Subjective safety
Perceived safety in real traffic
A one-way ANCOVA was conducted to investigate whether the perceived safety differs between the original design and the three conversions. We introduced two covariates: (1) general safety perception in Zurich and (2) general safety perception on bicycle lanes. The assumption of equal variances was met. Significant differences were found regarding the safety perception between the implemented measures (Table 4). Post-hoc tests using Bonferroni correction revealed a significant difference between the original design (M = 4.68) and the design using discs (M = 5.18; p < .013; Figure 5) as well as between the original design and the guide beacons (M = 5.00; p = .024).
|
Measure |
Sum of squares |
df |
Mean square |
F |
p |
η2 p |
|---|---|---|---|---|---|---|
|
Design |
16.598 |
3 |
5.533 |
5.928 |
< .001 |
0.039 |
|
General safety perception in Zurich |
8.771 |
1 |
8.771 |
9.398 |
0.002 |
0.021 |
|
General safety perception on bicycle lanes |
46.917 |
1 |
46.917 |
50.270 |
< .001 |
0.104 |
|
Residuals |
405.985 |
435 |
0.933 |
|
|
|
We also investigated which factors besides the conversion influenced the safety perception (Table 5). We found that gender, general safety perception, and perceived conflicts to be significant predictors.
Women expressed a higher safety rating. People who scored high on the general safety perception in Zurich also expressed higher safety ratings. Having previously perceived a conflict at the road section in question influenced the perceived safety negatively. Overall, 29% of the interviewees stated that they had previously experienced a conflict at the investigated road section.

|
Coefficients |
Wald test |
|||||
|---|---|---|---|---|---|---|
|
Estimation |
Standard error |
z |
Wald-statistic |
df |
p |
|
|
Intercept |
-2.376 |
0.855 |
-2.780 |
7.727 |
1 |
0.005 |
|
Gender |
-0.478 |
0.229 |
-2.083 |
4.339 |
1 |
0.037 |
|
Age |
0.110 |
0.156 |
0.709 |
0.503 |
1 |
0.478 |
|
Frequency of bike usage |
-0.166 |
0.177 |
-0.936 |
0.876 |
1 |
0.349 |
|
E-bike usage |
-0.204 |
0.245 |
-0.832 |
0.692 |
1 |
0.406 |
|
General safety perception in Zurich |
0.566 |
0.105 |
5.389 |
29.046 |
1 |
< .001 |
|
Familiarity with the study area |
-0.132 |
0.248 |
-0.530 |
0.281 |
1 |
0.596 |
|
Perceived conflicts |
-1.076 |
0.267 |
-4.027 |
16.219 |
1 |
< .001 |
|
Presented conversion |
0.287 |
0.102 |
2.827 |
7.991 |
1 |
0.005 |
Expected safety based on images
An ANOVA with repeated measurement was carried out to investigate whether the expected safety assessment differs between the original design and the three conversions based on the pictures presented to the participants at the first interview before the conversions were implemented. Due to a significant Mauchly test of sphericity, the Greenhouse-Geisser correction was used. There were no significant differences in the safety assessment based on the pictures of the different lane designs during the first interview period (F (1.86, 158,439) = 0.358, p = .663). Therefore, no post-hoc tests were conducted.
Discussion
We investigated the effect of different forms of light segregation of a cycle lane on different aspects of objective and subjective safety of cyclists on a conflict-prone road section in Zurich. The bike lane was converted using (1) a continuous line, (2) light segregation with flat discs, and (3) light segregation with guide beacons that do not allow cars to override them.
Video-based traffic analyses showed a reduction in cyclists' adaptive actions, such as braking or swerving, for all conversions compared to the baseline situation. Even the minor adjustment of a continuous line decreased the number of adaptive actions. A possible explanation might be that motorized traffic drivers noticed the design change and were more aware of cyclists, additionally based on their potential knowledge that they are not legally allowed to cross a continuous line. However, no difference between the different types of conversions could be found; in the current study, the light separation with the highest level of separation—the guide beacons—did not have a stronger effect on adaptive actions than the other investigated conversions. Therefore, it can be assumed that motorized traffic will not pay more attention to cyclists when entering the parking garage than when using the other conversions, despite the guide beacons separating the bike line.
The results also revealed a high safety rating by the participants at all stages, although conflicts had been reported before and recorded during the study. Regarding the different designs, cyclists in the current study only rated a light separation using disks and guide beacons as safer than the regular cycling lane. The conversion using a continuous line does not affect the perceived safety so much compared to the original design, although it has a legal impact. Motorized traffic is legally not allowed to cross the lane. It can be expected that drivers are aware of this traffic rule. Nevertheless, one explanation for this would be that cyclists do not expect a high level of compliance from car drivers, which is why the ‘hardware design’ with discs on the road—compared to the pure marking design—seems to offer them more safety.
The second most preferred design was light segregation using guide beacons. A contributing factor to why it was only the second choice might be that this design on a two-meter-wide lane hardly makes it possible to overtake slower cyclists within the lane. Furthermore, some cyclists mentioned that the beacons might become dangerous since they cannot swerve if anything happens in front of them in the bike lane.
Presenting the three pictures with the conversions before they were installed revealed no differences, although the assessment in real traffic did. It signifies that the expected safety gain compared to the observed perceived safety gain after the conversions was underestimated. Therefore, a field study should be the preferred design to investigate the perceived safety.
However, field trials such as this one contain certain limitations. Due to legal restrictions in Switzerland, changes to the infrastructure can only be evaluated in pilot tests. But as the infrastructure designs in our study were only implemented in one place, it was not possible to test different orders of the implemented measures and, therefore, rule out order effects. Participants in the last change have probably had already experienced the previous conversions and had greater opportunities for comparison than respondents after the first conversion.
The subjective safety perception was kept to a single item to keep the questionnaire as short as possible. Future studies focusing on perceived studies should extend the questionnaire (Ghielmetti et al., 2017; Hackenfort, 2012) and measure subjective safety perceptions in a more differentiated way.
Another limitation of the current study is that we cannot be sure if or how many cyclists intentionally avoid this area due to its road design and how their safety perception differs from those cyclists who chose this route. Therefore, a sample bias might have occurred. Future research should include this aspect, e.g. by interviewing cyclists on parallel streets.
The presented study recorded short-term effects. Future research should examine whether the effects persist in the long term or how they change. Cyclists might feel safer just because something was changed, even though it was not necessarily an improvement. Conversely, car drivers might be particularly vigilant in the weeks following an infrastructure change, although this may diminish over time.
Additional research should investigate the relationship between expected safety perception and actual safety perception. Conversions that were based on expected safety perception should be evaluated after their implementation.
Cycling lanes must be wide enough for cyclists to overtake each other, as shown in previous studies (Park et al., 2015; Pulugurtha & Thakur, 2015; von Stülpnagel & Binnig, 2022). However, if space limitations exist—which might not only be the case in a few cities—interactions with the lane design have to be considered and tested.
Conclusions
The project provided important insights based on real traffic regarding the future use of the tested elements regarding safety and perceived safety. However, the trial also showed that complex traffic situations could only be alleviated to a limited extent by simple measures. A one-size-fits-all solution is not to be found.
Funding
This research was gratefully funded by the City of Zurich.
Availability of data
The data are available on request to the authors.
Declaration of competing interests
The authors declare no competing interests.
CRediT contribution statement
Tanja Stoll: Formal analysis, Visualization, Writing—original draft, Writing—review & editing.
Désirée Hagmann: Investigation, Writing—review & editing.
Jakob Leitner: Funding acquisition, Project administration, Writing—review & editing.
Markus Hackenfort: Conceptualization, Formal analysis, Supervision, Writing—review & editing.