A method to assess the safety implications of authority transitions in automated driving
Handling editor: Carmelo D'Agostino, Lund University, Sweden
Reviewers: Giulio Bianchi Piccinini, Aalborg University, Denmark
Tejas Chandran, Autoliv Inc., Sweden
Sara Hong, Kookmin University, the Republic of Korea
Received: 23 January 2024; Accepted: 15 May 2024; Published: 6 July 2024
Abstract
Automated Driving Systems (ADS) are aimed to improve traffic efficiency and safety, however these systems are not yet capable of handling all driving tasks in all types of road conditions. The role of a human driver remains crucial in taking over control, if an ADS fails or reaches its operational limits. Takeover performance of human drivers in authority transitions is typically assessed by means of the takeover time (TOT) taken within an available time budget (TB). This approach assumes a uniform perception and reaction time of human drivers in ADS disengagements, and does not include the time needed to execute the actual driving maneuver required to ensure safety. This paper aims to develop and test a set of new indicators to reflect takeover performance and its safety attributes, namely the ‘time to control’ (TC) and the ‘safe time budget’ (STB), in which the actual task execution (i.e. braking) time is taken into account, in addition to the perception and reaction time. It also proposes new thresholds for identifying critical conflicts in takeover situations and assessing the safety of authority transitions. A traffic simulation experimental setup is used with mixed traffic of conventional vehicles and ACC/CACC platoons in order to test these indicators and thresholds. The results suggest that the time difference between TC and STB is a more sensitive and potentially more realistic safety indicator, as it may capture the variability of driver behavior in takeovers and identify critical conflicts, as well as virtual crashes, that would not have been identified by the previously used indicators (TOT and TB). Takeover performance worsens when the speed difference of the vehicles involved is higher, and the initial speed of the rear vehicle is higher. These findings can be useful towards a more dynamic design of takeover request strategies.
Keywords
authority transitions, Cooperative Adaptive Cruise Control, driver behavior, safety, simulation
Background and objectives
An important challenge for researchers and professionals related to automated vehicles is to ensure that the operators of these vehicles are capable of perceiving not only the capabilities, but also the limitations of the automated systems (Flemisch et al., 2017).Until Automated Driving Systems (ADS) become capable of performing all types of driving tasks in all types of road conditions, human drivers will be responsible for taking control when the system fails or reaches its operational limits (Varotto et al., 2015). Several studies underline that, as the level of automation increases, the role of the driver remains crucial, and traffic safety is increasingly dependable on the combination of the performance of the human driver and the automation (Merat et al., 2012; Petermann-Stock et al., 2013).
In order to be able to evaluate the safety of new vehicle systems for automated driving, traffic simulations can be used, since most of these systems are not yet widely implemented in real traffic and accidents don’t occur often in practice. Also, when an accident has happened, often the exact cause is unknown. Traffic simulation can address this gap, however it requires realistic modelling of both the human driver, the automated vehicle systems, as well as reliable safety indicators. For safety assessment, the moment when the driver needs to take over control from the automated system is crucial. In order to assess how (un)safe such a takeover is, an indicator is needed that reflects the (un)safety of that specific situation.
Existing research has proposed taxonomies for such transitions of control, depending on who initiates the transition and who is in control after the transition. There are four types of transition (Klunder et al., 2009; Lu & Winter, 2015; Lu et al., 2016):
-
Driver-Initiated Driver Control (DIDC) which occurs when the driver voluntarily selects to deactivate the automated system and resume back control, e.g. for overtaking;
-
Driver-Initiated Automation Control (DIAC) in which the driver activates the system, e.g. when entering a highway;
-
Automation-Initiated Driver Control (AIDC), where the automated system initiates the transition, because it reaches its limitations; and
-
Automation-Initiated Automation Control (AIAC), where the automated system initiates the transition, e.g. because it is detected that the driver is impaired or unable to handle the situation downstream.
This research focuses on the third type of transition, which is considered to be the most complex and safety critical one, as it involves mechanisms of human adaptation in emergency scenarios under limited time. The most common situations for an AIDC takeover are when there is a sensor failure, when the system reaches its boundaries (in terms of speed, acceleration/deceleration), e.g. to avoid a stopped vehicle, when the vehicle exits its operational design domain (ODD), e.g. approaches an off-ramp, or when the system deliberately initiates a takeover in order to increase the alertness of the driver.
By that time, the system sends a warning (takeover stimulus) to the human driver, who has to take over within a certain time to ensure safe operations. Such a time sequence has been described by Zhang et al. (2019): the time from the moment of the warning, until the moment of driver’s first intervention, is called Take Over Time (TOT). The last moment at which the driver can take action is called ‘system limit’. The time between a warning and the system limit is called Time Budget (TB).
Typically, when the Take Over Time is smaller than the Time Budget, the situation is considered to be safe. However, comparing the TOT with the TB is not always a reliable safety metric, as both metrics are dependent on the driver’s perception and reaction times. These times are usually taken as mean values, not accounting for the variability in human information processing. Moreover, in certain conditions, it may be the case that after the driver took over, the deceleration force applied, or the maneuver performed, were not sufficient to avoid a collision. While in traffic simulation models this type of ‘poor’ driver performance is seldom considered (Calvert & Arem, 2020; Lint & Calvert, 2018), in reality drivers may not perform in an optimal way due to e.g. misconception of the situation, wrong cognitive processing of the available information, or simply poor task execution (Kyriakidis et al., 2017). Both TOT and TB metrics are not designed for capturing that ‘poor’ and potentially unsafe task performance. Therefore, a simulation experiment in which TOT and TB satisfy the aforementioned condition (TOT < TB), may not necessarily ensure that critical situations will be evaded in practice.
This research aims to develop and test a set of new Key Performance Indicators (KPIs), in order to estimate driver performance and its safety consequences more accurately. More specifically, we propose two new metrics for takeover performance; in these metrics, in addition to the perception and reaction time, the actual task execution time is taken into account. To test these metrics, we use a traffic simulation experimental setup with mixed traffic of conventional vehicles and Cooperative Adaptive Cruise Control (CACC) platoons. The simulation output is used to calculate the share of critical conflicts and virtual ‘crashes’ on the basis of the new proposed metrics. The results are analysed with respect to automated vehicles’ (AV) penetration rate, and vehicle class.
The remainder of this paper is structured as follows: section 2 presents a literature review of simulation studies on mixed traffic, as well as a review of takeover performance in automated driving, its determinants and its safety implications. Section 3 presents the methodology of this research, including the development of the new metrics. Section 4 includes the experimental setup of the simulation. Section 5 presents the results of the analysis. Finally, section 6 includes a discussion on the results and limitations of the study; conclusions are drawn in section 7.
Literature review
For many AV applications, the safety impacts in mixed traffic (conventional and automated vehicles in different penetration rates) are assessed by means of traffic simulation, e.g. Arvin et al. (2020); Dahl et al. (2018); Liu et al. (2018); Cacciabue and Carsten (2010). A number of Surrogate Measures of Safety (SMoS) (often also referred to as SSM—surrogate safety measures) are typically used to assess the criticality of virtual conflicts observed in the simulated network. These include Time-to-Collision (TTC), Post Encroachment time (PET), Deceleration Rate (DR), maximum speed, speed differentials or variations of the above (Gettman & Head, 2003).
Table 1 summarizes a number of recent simulation studies on the safety of CACC in mixed traffic. The selection criteria for the summarized studies were studies of the last five years published in a scientific Journal, with a clear safety focus. A detailed review of these studies is beyond the scope of this paper, for this the reader is referred to Papadimitriou et al. (2022). It is observed that the majority of studies, by using different SMoS and thresholds, report significant safety benefits from the increase in AV penetration rates in the simulated networks, including highways and junctions, e.g. Papadoulis et al. (2019); Virdi et al. (2019); Rahman and Abdel-Aty (2018); Ye and Yamamoto (2019). One study (Sinha et al., 2020) found little or no safety benefits for conventional vehicles from the increased AV penetration rate, and argued that AV ‘behaviour’ thresholds derived from conventional, human naturalistic driving should be revisited.
Indeed, the safety thresholds used in these simulation studies, e.g. for deceleration, TTC or PET, vary among studies are not standardized in general. It is noted that none of these studies examine specifically the impact of authority transitions on the network safety. Whilst SMoS are available (and still developing) for regular driving, their counterparts for control transitions are still in early stages of development.
There are several design factors and human factors that are involved in a safe authority transition. These have been extensively reviewed in recent review studies and meta-analyses (Winter et al., 2014; Zhang et al., 2019) and only a summary of main findings is presented in this paper (see Table 2).
Many studies have shown that in low level automation, where drivers are still expected to stay engaged in the driving task, reduced cognitive awareness is still observed. The required shift in attention is demanding by itself, and prone to errors and delays, especially if a secondary task is involved (Borojeni et al., 2016; Calvert et al., 2020; Merat et al., 2012).
Several studies have examined the impact of the modality of a takeover request (TOR) on takeover performance, e.g. ‘why messages’ (describing reasons) and ‘how messages’ (describing action) in Koo et al. (2015), visual, auditory or tactile warnings in Naujoks et al. (2021); Politis et al. (2018); Baldwin and Lewis (2014), peripheral light displays in Borojeni et al. (2016), comparison of the modalities of the driving task and the non-driving task in distracted driving in (Petermeijer et al., 2016). In the meta-analysis ofZhang et al. (2019) it was found that when auditory or tactile takeover request was used, the difference in TOT was on average -1.41 s.
In the meta-analysis of Zhang et al. (2019), TOT varied from 0.69 s to 19.79 s. The mean TOT was 2.72 s with a standard variation of 1.45 s. The results greatly vary depending on several drivers and other factors, such as prior experience and time budget magnitude. Time Budget in particular was found to strongly affect TOT, resulting in a difference of +1.35 s. Prior experience also influenced TOT (drivers showed on average -1.00 s TOT when they were taking over for a second time). On the other hand, using a handheld device or being involved in a visual non-driving task increased TOT by +1.33 s and +0.29 s respectively. High traffic density had a marginally significant effect of +0.49 s on TOT.
|
Source |
Method |
Surrogate measures of safety (SMoS) |
Results |
|||||||
|---|---|---|---|---|---|---|---|---|---|---|
|
Simulation |
Meta-analysis |
TCC |
Time gap |
PET |
Acc/dec rate |
Speed variability |
Conflicts |
Other |
||
|
+ |
+ |
+ |
AV, either as managed-lane platoons, or all-lanes AV, significantly improved the longitudinal safety in a simulated expressway |
|||||||
|
+ |
+ |
+ |
+ |
Safety is generally improved with the increase in the AV penetration rate, provided that car-following rules of AVs are more conservative (i.e. larger gaps) |
||||||
|
+ |
+ |
|
+ |
+ |
Large safety improvements in terms of conflicts reduction for increased penetration rate |
|||||
|
+ |
+ |
+ |
+ |
+ |
Significant reductions in conflicts as the AV penetration rate increases in different types of junctions |
|||||
|
+ |
|
+ |
|
+ |
+ |
+ |
|
|
Little or no safety benefit for conventional vehicles in all AV penetration rates, compared to the 0% AV penetration rate. A benefit on crash rate can be achieved only for the 100% AV penetration rate. |
|
|
+ |
|
|
|
|
|
|
+ |
+ |
Safety benefits of ACC once penetration rate reaches 40%. Higher improvement with CACC. |
|
|
|
+ |
|
|
|
|
|
|
+ |
Lack of common safety metrics and threshods among studies. |
|
|
Source |
Method |
Surrogate Measure of Safety (SMoS) |
Results |
||
|---|---|---|---|---|---|
|
Simulation |
Meta-analysis |
Reaction/takeover time |
Other |
||
|
|
+ |
+ |
+ |
Reaction time to critical events increases with secondary tasks and higher levels of automation. |
|
|
+ |
+ |
+ |
|
Takeover time ranges from 0.7 to 20 s, with mean 2.72 s. In general, longer time budget results in longer TOT. |
|
|
Mac Donald et al. (2019) |
+ |
+ |
+ |
|
Takeover time increases per 0.27 s for each 1 s of extra time budget available. |
|
|
+ |
|
+ |
In addition to TOT, takeover quality is an ‘umbrella’ term for many logitudinal/lateral control or driver behaviour indicators affecting the safety of takeovers. |
|
The above literature review indicates that the heterogeneity in human perception and reaction time in different situations may result in large variability in TOT. A large share of this distribution is far beyond the desired time gaps that an advanced CACC system can achieve (i.e. 0.6 to 0.9 s). This means that, for instance, in a hypothetical immediate full stop of the front vehicle, a collision would be inevitable, as the available time for a driver to react is not sufficient.
As also noted by Zeeb et al. (2016), TOT may not be the most important element when assessing the performance of an authority transition, because some studies have shown that shorter TOT may come with lower quality. The general term ‘takeover quality’ (TQ) includes different longitudinal and lateral control indicators, but also driver factors such as hazard perception and situational awareness. As described in the review of Papadimitriou et al. (2020), TQ has been found to be a better safety indicator in terms of lateral control, number of steering corrections, and in non-emergency transitions, whereas other indicators (e.g. TOT) could not capture the differences between emergency and non-emergency situations. Ruscio et al. (2015) underline that a driver’s perceiving and cognitive awareness affects his ability to mentally process a takeover request, and thus the takeover performance too; therefore, the standard approach that uses reaction times (TOT < TB) seems to be inefficient to ensure the safety of a transition, despite the fact that it is, in general, a good estimate regarding the criticality of incidents.
Overall, existing studies do not adequately link TOT with the actual safety consequences; for instance, it is not known how TOT correlates with the SMoS that can be empirically observed through traffic simulation. On the other hand, the existing simulations of CACC and mixed traffic use several common SMoS with different thresholds among studies, but do not test the conditions of authority transition. Hence the reported safety benefits do not cover this safety-critical case. In this paper, we argue that, by taking into account the braking time of the driver, it is possible to link takeover performance with critical conflicts or crashes.
Traffic simulation models do not allow virtual ‘crashes’ to occur by design; their input parameters and model specifications ensure safe interactions, as in most cases the modelling purpose is that of traffic efficiency. The safety impacts of traffic scenarios in general, and takeover scenarios in particular, are based on an assessment of the criticality of certain conflicts by means of SMoS. In this research, we assume that, by incorporating more elements of human driver behaviour in simulation, and allowing for virtual crashes to be observed by post-processing the outputs, it is possible to assess the safety implications of authority transitions in a more realistic way.
Methodology
Takeover sequence
In this paper, we consider ACC and CACC systems, which are typically considered Level 1 or 2 automation (SAE, 2018); however, the car-following performance that can be achieved is representative of the performance that might be expected at higher levels of automation (e.g. automated platooning) (Shladover et al., 2015).
Take Over Time (TOT) brings together the times resulting from a sequence of information-processing stages (Gold & Bengler, 2021; Gold et al., 2013; Petermeijer et al., 2016):
-
perception of visual, auditory, and/or vibrotactile stimuli;
-
cognitive processing of the information;
-
response selection (decision-making);
-
resuming motor readiness (hands and feet on steering wheel and pedals); and
-
initial action (e.g. first steering and braking input to the vehicle).
Various studies state ‘baseline’ reaction times of approximately 0.7 to 1 s for the first road fixation and 1.2 to 1.8 s for the first contact with the steering wheel (in SAE level 3) (Gold et al., 2013; Zeeb et al., 2016).
Actual task execution times (e.g. steering, braking times) are important factors to consider, because the longer it takes the driver to build cognitive awareness, the shorter the remaining execution time will be, within a given time budget (Zhang et al., 2019). By adding braking time to the perception / reaction times when planning or programming the automated system, the safety consequences of takeover operations can be assessed more accurately.
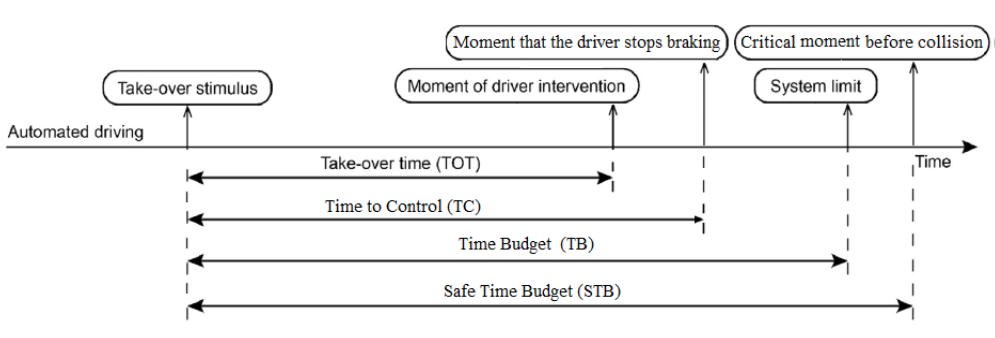
In Figure 1 an alternative approach to the takeover sequence originally presented byZhang et al. (2019) is presented. In particular, two additional times are added in the time sequence, reflecting the additional time that is required for a driver to perform the required action for collision avoidance. These two metrics are: the Time to Control (TC), and the Safe Time Budget (STB).
Compared to the TOT, which only captures the first moment of action (braking/steering) and thus cannot guarantee collision avoidance, the Time to Control (TC) indicates the moment at which no more deceleration force is required to avoid a potential collision with the leading vehicle. In accordance with that, another measure is also necessary, in order to capture the last ‘safe’ moment right before a collision. Compared to the Time Budget (TB), which shows the last moment that the system is able to handle the task, the Safe Time Budget (STB) defines the moment just before the collision—under the given driving dynamics—in which the collision is evaded, and includes the time—after the system limit—for the needed action to be taken by the driver for collision avoidance. A well-designed ADS should ensure that the TB (system limit) should precede the STB (last chance before collision) by at least the braking time required by the following vehicle. If the system limit is close to the STB, the braking distance available might not be sufficient for the driver to implement the necessary task. Consequently, with the combination of the Time to Control and the Safe Time Budget, it can be safer to assume that, once the ratio of these two metrics is smaller or equal to 1, a collision-free situation is ensured.
Moreover, the combination of these two metrics may be preferable in order to conclude not only on the probability of critical conflict, but also on the severity of the incident as well. While their ratio might have the same value for quite different circumstances (e.g. a Time to Control of 2 s with a Safe Time Budget of 4 s has the same ratio with a Time to Control of 5 s and a Safe Time Budget of 10 s), their actual absolute difference (e.g. 2 s vs. 5 s) provides additional insights into the severity of the conflict. The respective difference of the previously used metrics (i.e. TB-TOT) does not have a similar intuitive meaning in terms of collision avoidance, as it merely reflects the speed of building cognitive and motor readiness, without taking into account the actual execution time within the time-to-collision available.
Safety metrics estimation and thresholds
As shown in Figure 1, the TC is defined as the time from the warning stimulus until the moment that the driver stopped decelerating at a certain rate. After this point a driver can either maintain a constant speed, accelerate, or shift control back to the system again. Only when these actions are fully performed can it be assumed that the authority transition took place in a safe way. In a simulation model, for a given scenario, the elapsed time from the moment of the warning until the moment that the driver has stopped applying a deceleration force greater than -2 m/s2 can be measured. The specific threshold is the value at which the ADS can be reactivated after an authority transition (Xiao et al., 2018). Hence, TC represents the time that the driver needs in order to perceive the warning stimulus, build cognitive awareness of the situation, assume motor readiness and perform the needed action. TC is calculated as the sum of the TOT and the action execution time and can be directly derived from the simulation algorithm.
Accordingly, STB is the total available time for the driver to actually take control of the vehicle. This is the time from the moment of a warning, until the last moment before a potential collision, and can be estimated as follows:
At any moment of a car following situation, before the potential collision, the following kinematic equation is valid:
: Position of following vehicle (front edge) (m)
: Position of lead vehicle (front edge) (m)
: vehicle length (m).
The STB is the result of equation 1, divided by the speed difference of the two vehicles. It can be understood as the safe Time to Collision’ (sTTC), which captures the last safe moment right before a collision. This time is the summation of the TB and the action time. Its calculation derives directly from the simulation algorithm.
: Position of following vehicle (front edge) (m)
: Position of lead vehicle (front edge) (m)
: vehicle length (m)
: speed of following vehicle (m/s)
: speed of lead vehicle (m/s).
The indicator proposed for safety assessment purposes in this research is the time difference between available and achieved time for vehicle control ΔΤC, i.e. the difference between STB and TC:
Obviously, the closer the indicator value is to zero, the more likely it is that an actual crash will occur, while the higher the value is, the safer the authority transition can be considered. According to (Eriksson & Stanton, 2017), the required space gap between vehicles both in terms of safety and comfort, is approximately 1 car length for every 16 km/h (4.44 m/s) of speed of the following vehicle. By dividing the average vehicle length (4 m) with the 4.44 m/s speed, it can be derived that 0.9 s are required for a vehicle to cover a one-vehicle length. A ΔΤC value of 0.9 is taken as the threshold at which a crash is avoided, and values lower than 0.9 are used to define ‘critical conflicts’.
In order to demonstrate the added value of the proposed metrics and safety indicator, a similar safety indicator is proposed on the basis of the conventionally used indicators of takeover performance, i.e. TOT and TB, which reflects the time difference ΔΤTOT between available and achieved time for driver intervention (not including vehicle control):
A respective threshold for determining the conflict criticality on the basis of the TOT approach can be set as follows: we start by adopting a Time To Collision value that would be considered acceptably safe by the majority of drivers; for that purpose, we adopt the value of 2.6 s from (Hogema & Janssen, 1996). In that earlier study, 2.6 s was found to be the maximum TTC exhibited by 85% (85th percentile) of drivers in a simulator driving with ACC engagement. This time can be considered as critical in terms of the remaining available time for a driver to handle a situation, including the total time of perception, reaction and action. In order to determine a critical threshold for ΔΤTOT (which by definition only includes perception and reaction time), we will subtract the mean value of the braking times—calculated on the basis of the empirical data—from the boundary of 2.6 s.
Experimental setup
The present study is based on the data generated by the CACC simulation model created by Xiao et al. (2018). This model highlighted the influence of system deactivations in CACC mode on traffic flow on bottlenecks. This resulted in a dataset, which includes different types of authority transitions. Also, the CACC model manages to capture driver-system interactions in a realistic way on the basis of data. More specifically, the longitudinal response of the CACC model is an empirical model that is derived from vehicle data measured from a field test consisting of four CACC vehicles on public roads. The experimental scenario is intentionally kept simple to avoid ‘noise’ and allow the emphasis of this research to be placed on the already complex translation of traffic flow impacts to safety impacts.
Car following model
As elaborated in Xiao et al. (2017), the applied car following model is based on two parallel control loops. Three stages, namely, perception, decision-making, and actuation, govern the human driver as well as the (C)ACC control loop (Xiao et al., 2018). These three stages are a representation of the sequential process for the physics of vehicle behavior in discrete time steps (Milanes & Shladover, 2014). The vehicles have three possibilities in terms of operation system: a) manual driving, b) ACC operation and c) CACC operation. The automated operations (ACC and CACC) integrate controllers for 3 control purposes (Shladover et al., 2015):
-
Cruising controller (desired speed maintenance if there is no preceding vehicle)
-
Gap regulating controller (desired time gap maintenance when there is a preceding vehicle)
-
Gap closing controller (transition from cruising controller to gap regulating controller when a preceding vehicle is identified).
Regarding manual driving, the car following model is based on a modification of the IDM (intelligent driver model) (Schakel et al., 2012; Treiber et al., 2000), the IDM+. With the implementation of the IDM+ instead of the IDM, more logical values in terms of traffic capacity can be achieved.
Lane changing model
The LMRS (lane change model with relaxation and synchronization) bySchakel et al. (2012) is the basis for the lane change model designed by Xiao et al. (2018). In this model, a decision model is used for the prediction of the lane changing behavior based on the concept of lane change and gap relaxation The decision model calculates the lane change desire first, and determines whether a lane change is needed and which type of lane change should be executed. In order to obtain the lane change desire, a weighted summation of multiple-lane change motivations, gaining speeds and traffic rules (keep right instructions) is required. With respect to the interaction amongst lateral and longitudinal behavior of the vehicle, the acceleration is modeled as a function of the desired lane change and the desired gap. The human driver behaviour model was calibrated on the basis of loop detector data of SR99 corridor in California (car-following and lane change behaviour in both free flow and congested flow) (Xiao et al., 2017).
CACC deactivation model
A main assumption regarding the use of ADS is that drivers are assumed to drive with an active system (ACC/CACC) as much as possible. In addition, during active system operation, there were three states under which the deactivation process could take place: safety-related (collision warning—critical approaching), lane change related (synchronization for a lane change), or route related (exits, merging scenarios, lane drop).
Another assumption made is that the ADS cannot be reactivated when the deceleration rate exceed the margin of (-)2 m/s2 or during a lane change (Xiao et al., 2018). The TC is therefore measured from the moment of the warning till the moment that the driver decelerates with a rate higher than the above-mentioned threshold. Additionally, drivers’ attention is considered to be continuous during the activation-deactivation of the system as they are assumed constantly in the control loop (SAE Standard J3016).
Next, in the main reference study (Xiao et al., 2018), the reaction of the driver is considered to be equal to zero (0) seconds. In reality, even if the driver is continuously alert, a reaction time of at least one (1) second applies. For that reason, and for the calculation of the TC, four different TOTs have been used based on the research performed by Eriksson and Stanton (2017): 1.14 s, 2.05 s, 2.69 s, and 3.04 s, with corresponding TBs of 3 s, 4 s, 6 s and 7 s. The TB times were selected based on the STB ranges calculated from the simulation model, and the TOTs were selected based on the TBs. This means that, if a Safe Time Budget is calculated to be approximately 5 s, the corresponding Time Budget is 4 s, and thus the TOT is 2.05 s.
A collision warning is based on the inverse time to collision (iTTC). The other reasons for system deactivation are related to the drivers' desire to adjust vehicle dynamics (driver initiated) and are therefore not considered in this study. For the system deactivation, both ACC and CACC systems can be deactivated, with the system reverting to manual driving (SAE level 1&2). The model used by Xiao et al. (2018), assumes that vehicle dynamics are highly associated with acceleration capabilities, driving comfort and safety, therefore a gradual transition from an active system to manual driving is necessary. One important alteration in CACC behavior concerns the reduced time gaps; when there is an authority transition, there is a need to adapt from one desired time gap to another. CACC time gaps range from 0.6 s to 1.1 s (CACC and ACC) and the corresponding time gap for manual driving is 1.4 s (Xiao et al., 2017).
Finally, regarding the deceleration forces that apply in this study, at the time the driver takes over control of the vehicle, the deceleration force is considered to start at -6 m/s2. Depending on the time gap with the front vehicle, the deceleration force is gradually reduced in a smooth way so that the desired time gap of manual driving is reached (Xiao et al., 2018).
Experimental design
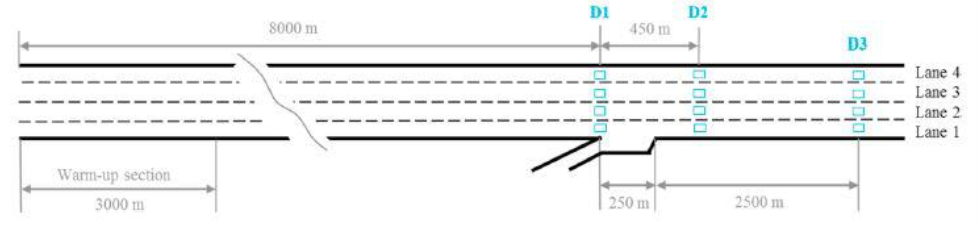
The simulated network is a four-lane highway section with an on-ramp (length 250 m) where congestion occurs including a resulting capacity drop. The entire network is 11 kilometers long. The first 3 kilometers are used as a warm-up distance in order to allow CACC platoons to form naturally (see Figure 2).
Five different penetration rates for CACC operations are tested, starting from 20% to 100% with a 20% increments. The on-ramp demand was set to 400 vehicles per hour. Each of these 5 penetration rate scenarios runs with 5 different random seeds (assigning the vehicle class i.e. ACC/CACC, the desired speed, and the arriving interval between two vehicles at the generator). The simulated duration is one hour (0.1 s time step) with the first 10 minutes used as a warm-up period. The mainline demand was set to 80% of the capacity of the corresponding CACC market penetration rates in a pipeline section.
Table 3 Lists the parameters of the car following model as well as the simulation settings (Shladover et al., 2015).
|
Parameters |
Value |
Units |
|---|---|---|
|
|
|
|
|
Max acceleration (conventional vehicles) |
1.25 |
m/s2 |
|
Max deceleration (conventional vehicles) |
2.09 |
m/s2 |
|
Stopping distance |
3 |
m |
|
Desired time gap (manual driving) |
1.4 |
s |
|
Vehicle length |
4 |
m |
|
Free flow speeds |
N (125, 8.75) |
km/h |
|
V2V communication range |
300 |
m |
|
Sensor range |
120 |
m |
|
Desired time gap (ACC) |
1.1 |
s |
|
Desired time gap (CACC) |
[0.6–1.1] |
s |
|
ACC-CACC lower acceleration limit |
-4 |
m/s2 |
|
ACC-CACC upper acceleration limit |
2 |
m/s2 |
The output metrics that are calculated per vehicle were:
-
Time step (0.1 s)
-
Location (m)
-
Speed (m/s)
-
Acceleration (m/s2)
-
Lane (current lane)
-
Class ID (= 1 then normal vehicle, 7–10 then CACC)
-
Mode (Cruising / gap regulating / gap closing)
-
Operation system (manual = 0 / ACC = 1 / CACC = 2)
-
Distance headway (m)
-
Deactivation type (0 means no deactivation, 1 means collision warning).
In addition, an algorithm was designed in order to identify authority transitions, flag the trajectories of these vehicles and calculate the Time to Control (TC), derived from the difference of the time step where the deceleration force became smaller (absolute value) than the threshold, minus the time step where the warning appeared, plus the driver reaction time. This also allows actual braking time of each vehicle to be calculated.
In order to calculate the STB, pairs of vehicles in car-following situations were identified and matched based on their location (including lane). Once the pairs of vehicles were identified, the STB was calculated for each deactivation. Finally, for each conflict the differences ΔΤC and ΔΤTOT were calculated. The mean actual braking time in this network was found to be 1.02 s, so the critical threshold for ΔΤTOT is calculated as 1.58 s (see section 3.2).
Results
Simulation results
Table 3 shows the output of the simulation of each of the 5 seeded repetitions of each scenario. It is observed that the total throughput rises with increasing the AV penetration rate. In the same way, the number of conflicts (system deactivations) as well as the number of critical conflicts also increase.
More specifically, in the 20% penetration rate, only a small number of conflicts appears, with none of them revealing significant criticality (in terms of ΔΤC threshold). The percentage of conflicts out of the total number of AV in the network is insignificant (less than 0.5%). In the scenario of 40% penetration rate (Table 4), the total throughput increases by approximately 6%. The number of conflicts increases respectively, however still no critical conflicts occurred (percentage of conflicts in the network hardly reaches 1%.)
The 60% penetration rate scenario reveals the first critical conflicts. A few actual crashes (identified as conflicts in which the value of ΔΤC was negative, indicating that the TC exceeded the STB available) also appear in this case probably due to the increase in the traffic throughput in combination with the smaller headways operated in the network. The throughput increased by a factor of 1.1 and the incidents by a factor of 5. The percentage of conflicts out of the total AV in the network reached 3%.
Similarly, the 80% penetration rate scenario revealed an increase of the incidents proportional to the increase in throughput. The conflict percentage ranges between 4 to 5% and the number of crashes also slightly increased compared to 60% penetration rate. In the final scenario (100% penetration rate), all the examined parameters increased sharply. The total traffic throughput increased by around 2000 vehicles per repetition. The number of conflicts raised by approximately 1000 (system deactivations). The number of critical conflicts as well as crashes increased significantly compared to the previous scenarios.
Among the critical conflicts identified in all scenarios, 97% of them occurred when the disengagement happened while in CACC operation. This is due to the fact that the desired gap under CACC operation mode is smaller than under ACC operation mode, leaving less time available to the drivers to react during an authority transition. Among the CACC-related critical conflicts, 66% were for desired gaps of 0.6s, and another 27% concerned desired gaps of 07s.
The results indicate that driving with smaller headways can result in more hazardous situations when a deactivation of the automated system occurs. This can lead to near misses or even crashes when combined with large speed differences between the vehicles involved in the conflict, especially when the initial speed of the rear vehicle is higher.
It can be also noted that the increase of critical conflicts and crashes is not proportional to the increase of the total throughput resulting from the higher penetration rate. An approximate ‘risk rate’ for this network can be calculated by dividing the average number of conflicts or crashes, divided per the average number of vehicles in the network. The calculated risk of critical conflicts rises from 0.27 conflicts per thousand vehicles at the 60% penetration rate, to 0.52 at the 80% penetration rate and to 2.81 at the 100% penetration rate. Respectively, the risk of crashes rises from 0.136 crashes per thousand vehicles at the 60% penetration rate, to 0.23 at the 80% penetration rate and to 1.44 at the 100% penetration rate.
|
Scenario |
Seed |
||||
|---|---|---|---|---|---|
|
1 |
2 |
3 |
4 |
5 |
|
|
Penetration rate 20% |
|||||
|
Total vehicles |
7 479 |
7 596 |
7 539 |
7 769 |
7 558 |
|
Manual |
5 983 |
6 077 |
6 031 |
6 215 |
6 046 |
|
AV |
1 496 |
1 519 |
1 508 |
1 554 |
1 512 |
|
Conflicts |
5 |
3 |
6 |
5 |
9 |
|
Critical conflicts |
0 |
0 |
0 |
0 |
0 |
|
Crashes |
0 |
0 |
0 |
0 |
0 |
|
Penetration rate 40% |
|||||
|
Total vehicles |
7 914 |
7 954 |
8 021 |
8 092 |
7 975 |
|
Manual |
4 748 |
4 772 |
4 813 |
4 855 |
4 785 |
|
AV |
3 166 |
3 182 |
3 208 |
3 237 |
3 190 |
|
Conflicts |
25 |
21 |
27 |
29 |
20 |
|
Critical conflicts |
0 |
0 |
0 |
0 |
0 |
|
Crashes |
0 |
0 |
0 |
0 |
0 |
|
Penetration rate 60% |
|||||
|
Total vehicles |
8811 |
8717 |
8825 |
8805 |
8794 |
|
Manual |
3524 |
3487 |
3530 |
3522 |
3518 |
|
AV |
5287 |
5230 |
5295 |
5283 |
5276 |
|
Conflicts |
145 |
91 |
108 |
103 |
84 |
|
Critical conflicts |
8 |
0 |
0 |
2 |
2 |
|
Crashes |
3 |
0 |
0 |
1 |
2 |
|
Penetration rate 80% |
|||||
|
Total vehicles |
10 306 |
10 294 |
10 325 |
10 359 |
10 416 |
|
Manual |
2 061 |
2 059 |
2 065 |
2 072 |
2 083 |
|
AV |
8 245 |
8 235 |
8 260 |
8 287 |
8 333 |
|
Conflicts |
313 |
361 |
338 |
294 |
374 |
|
Critical conflicts |
3 |
1 |
9 |
6 |
8 |
|
Crashes |
1 |
1 |
4 |
3 |
3 |
|
Penetration rate 100% |
|||||
|
Total vehicles |
12 672 |
12 468 |
12 808 |
12 617 |
12743 |
|
Manual |
0 |
0 |
0 |
0 |
0 |
|
AV |
12 672 |
12 468 |
12 808 |
12 617 |
12 743 |
|
Conflicts |
1 203 |
1 021 |
1 142 |
1 149 |
1 182 |
|
Critical conflicts |
21 |
16 |
43 |
75 |
23 |
|
Crashes |
12 |
4 |
29 |
36 |
10 |
Safety evaluation of conflicts
Figures 3a & b compare the detection of critical conflicts and crashes by means of the new proposed metrics, compared to the previously used ones, for the scenario of penetration rate 80% (repetition 1). More specifically, Figure 3 shows the time differences (ΔΤC and ΔΤTOT ) of the rear vehicle for each one of the car following situations identified after the post-processing of the trajectory data generated by the simulation model; all these car following situations correspond to conflicts identified through a collision warning. In Figure 3b (lower panel) the values of ΔΤTOT (Time Budget minus Takeover Time) per vehicle are plotted in descending order, while the horizontal line indicates the threshold value for critical conflicts, as calculated from the empirical data (1.58 s)—see section 3.2. In Figure 3a (toppanel), the values of ΔΤC (Safe Time Budget minus Time to Control) per vehicle are plotted for the same order of vehicles, while the horizontal line indicates the respective threshold value for critical conflicts (0.9 s).
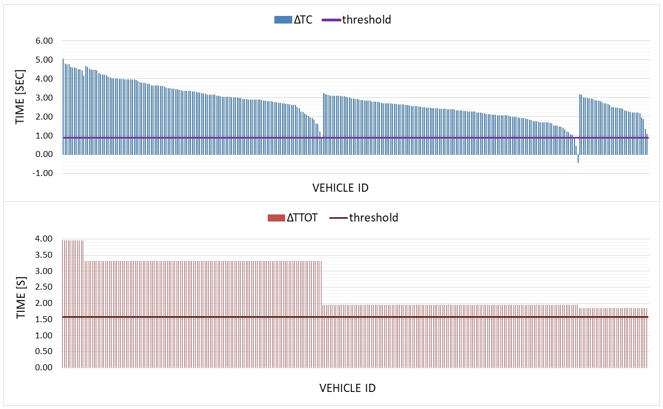
Both methods were able to identify conflicts, but only the new method (Figure 3a) was able to identify the critical ones in terms of takeover performance. This is in line with the fact that the TOT-based method is based only on the perception / reaction times of the drivers and assumes an optimal driver behavior (braking task execution) at all times. The 3 critical conflicts are visible in the top panel of the graph as those bars whose height is lower than the horizontal line (at the right part of the graph), and the 1 actual crash is visible as the single negative value appearing at the same place.
With respect to sensitivity, in Figure 3b the vast majority of vehicles exhibit a uniform behavior, because the input parameters are based on a small number of reference values. While Take Over Times (TOT) only take a few specific values for all drivers/vehicles, the Times to Control (TC) exhibits larger variation by different drivers, because braking responses are allowed to vary; this affects both the TC and the STB. Therefore, for each ΔΤTOT value (i.e. each uniform part of Figure 3b), there is a corresponding non-uniform distribution of ΔTC in Figure 3a. At the ‘tail’ of minimum values of each one of these distributions, a small number of critical conflicts or crashes are captured.
Therefore, the proposed new methodology of evaluating critical conflicts on the basis of perception, reaction and execution times is more sensitive and estimates more accurately the actual remaining time available for drivers to respond to a system deactivation. It is in fact a more conservative approach, but also a more safety-relevant one, as it yields a number of critical conflicts that is closer to real world conditions.
Time to Control analysis
The time-to-control (TC) was found to be positively correlated with the initial speed of the rear vehicle participating in the conflict—which is intuitive. In all penetration rates, CACC vehicles had higher frequency of conflict, due to their smaller gaps compared to ACC vehicles. Moreover, in the scenario of 80% penetration rate of higher, ACC vehicles had statistically significant higher TC compared to CACC, suggesting that vehicles that achieve smaller gaps are also more efficient in terms of TC in this scenario. However, TC differences were not significant in the 60% and 100% penetration rate scenarios.
Further analysis showed that ΔΤC is negatively correlated with the speed difference of the two vehicles participating in the conflict. The linear slope of speed difference against ΔΤC was -0.537 for 60% penetration rate, -0.321 for 80% penetration rate and -0.147 for 100%; all slopes were statistically significant at 95% confidence level. This suggests that a higher speed difference results in more critical conflicts (smaller difference between time-to-control and safe time budget), but the correlation decreases as the penetration rate of AVs increases.
Discussion
Many studies regarding authority transitions in automated driving have been performed in the past with little to no focus on the identification of optimal transition times with respect to concrete safety outcomes. The main contribution of this research, compared to previous studies performed in this field, is the introduction of a new method for identification and assessment of conflicts’ criticality in authority transitions. To the best of the authors’ knowledge, it is the first time that actual (and variable) maneuver execution times are considered for the evaluation of critical incidents.
A main finding of our study is that by increasing the penetration rates, safety due to authority transitions’ implications is compromised. Other studies performed so far claim that safety is increased by the deployment of AV in general (Papadoulis et al., 2019)—but none of these studies has tested in their simulation the impact of authority transitions in particular. Moreover, although several studies have reviewed the factors affecting takeover performance (Papadimitriou et al., 2020), and found several traffic and environmental determinants (e.g. higher traffic density, higher level of automation and adverse weather increase TOT), no study has associated takeover performance with penetration rate of AVs. Our study suggests a deterioration of safety metrics during authority transitions in higher penetration rates. The prevalence of this type of accident mechanism may have been underestimated in the past.
A main reason for this deterioration is that the desired time gaps under which active automation systems operate is significantly lower than those that human drivers are comfortable to drive in. This difference in the time gaps seems to be critical when it comes to this type of safety maneuver, since the available time for the driver to react and perform an avoidance action is limited. The expansion of time gaps to higher values, which are more in line with the capacities of human drivers in case of deactivation, should be considered especially when the ODD of the corresponding vehicle has also a finite capacity. For example, an automated vehicle that is equipped with a CACC system capable of achieving times gaps of 0.6 s, operating under SAE level 2 (limited ODD), could be programmed in such a way that its minimum value is not used, and the time gaps allowed are closer to those of human drivers are comfortable driving with (although this would have a negative effect on throughput). Overall, the results—although exploratory—imply the significance of a harmonized AV system ensuring smooth transitions, and the importance for adequate time for drivers to react.
Another interesting finding is the strong relation of the TC with the initial speed of the vehicle. This seems reasonable because the higher the velocity of a car is, the more time is required to decelerate to a point that a collision is avoided. However, this time is also dependent on the behavior of the leading vehicle. If in a traffic scenario the leading vehicle starts accelerating again before coming to a full stop, there will be no reason for further deceleration of the following vehicle, therefore avoiding a potential collision in less time. This is the case when shockwave traffic jams appear and disappear. A way to deal with this problem is the use of a dynamic design of takeover requests’ strategies with respect to warning times, where the stimulus may be triggered depending on the vehicle’s speed.
In addition, a rather unexpected finding was the fact that different desired time gaps did not seem to significantly differentiate from each other in terms of the safety implications of the transition. It was assumed that vehicles capable of achieving smaller time gaps would result in higher numbers of critical incidents. A possible explanation is that the algorithm used in this study was designed in a way that vehicles drive with an active CACC mode under desired time gap of 0.6s as much as possible. Thus, no random distribution between different classes and operation modes existed, making the sample for the rest of the classes insignificant.
The developed model in this study has some limitations. Firstly, the data that were used as input for this study were derived from a simulation study that was initially designed to assess traffic efficiency and not traffic safety. This means that several KPIs had to be either calculated outside of the model or based on similar studies. More specifically, the reaction times which were extracted from the previous simulation model were equal to zero. This means that by the time a collision warning was triggered, the driver was assumed to immediately start braking at the same time step. This is not realistic, as the total time that the driver kept braking until the -2 m/s2 threshold was not the actual braking time but the entire Time to Control (TC). An adjustment had to be made based on the TOT derived from (Shladover et al., 2015). The same applies to the Time Budget metrics. These limitations led to different assumptions for the calculation of various metrics, which need further exploration and validation in future research.
Another potential limitation comes from the assumption that automation would automatically reactivate again after the -2 m/s2 threshold. It might be the case that the braking action performed till that threshold would not be sufficient to avoid a collision, and the automation takes over control of the vehicle before the completion of the safety maneuver. This means that if this setting for reactivation is not implemented, the actual number of critical incidents and crashes might have been significantly higher.
In addition, for the calculation of the two thresholds for the corresponding two ΔΤ values (STB-TB and TB-TOT), but also for the TOT and TB themselves, the mean values of relevant metrics where used. In reality, collision risk is not determined by such mean values, but rather by the outliers of their distributions instead, as these extreme values better represent poor driving behavior.
In order to demonstrate our proposed methodology, we had to adopt or adjust threshold values from the literature, because standard values do not exist for TOT—and no threshold values exist for our new proposed KPIs. It is thereby acknowledged that the proposed values may be improved in further research. Moreover, a sensitivity analysis with respect to the parameters of the simulation would provide additional insights, however unfortunately the authors do not have access to the dataset for further analysis at this stage. Such sensitivity analysis of safety outcomes to simulation parameters should be prioritized in future research.
Conclusions
The objective of this research was to provide insights into the safety implications of authority transitions in AV operations, by taking into consideration the available time between a collision warning and the potential collision. Two new safety indicators, namely Time to Control (TC) and Safe Time Budget (STB) are introduced, based on the fundamental safety indicator of Time to Collision; these new indicators combine the perception/reaction times and the actual braking times, allowing for a more accurate safety evaluation.
From a methodological perspective, the proposed indicators would be useful not only for safety evaluations in microsimulation studies, but also for safety evaluations of real-world pilots, small scale driving tests or driving simulator studies with new vehicle systems involving authority transitions.
From a modelling perspective, by incorporating the actual braking times, more emphasis is put on human behaviour, which can be the critical determinant between a safe vs. an unsafe outcome in authority transitions. Our study reveals the added value and the potential of post-processing of existing simulation datasets for safety purposes, as safety is seldom the primary goal of a simulation model. In this sense, our proposed method and indicators could be applied to other AAC/CACC simulation outputs, by researchers that wish to test a more realistic assessment of the safety impacts of automation disengagements in their network. Further research should be conducted to explore the potential of this method in other contexts or scenarios.
Moreover, our results highlights the known limitations of simulation models and the challenges to realistically represent human behavior and its safety implications. Previous studies on AV safety did not take into account authority transitions in their simulations. Therefore, while the safety benefits shown in their results may be valid for regular AV driving, the negative safety impacts of authority transitions are not taken into account.
From an engineering and policy perspective, the current and future findings in this field show directions for improvement for vehicle manufacturers to redesign automated driving systems in a way that will improve overall safety, not only under normal conditions, but also under emergency situations, e.g. extending the ODD of automated systems, so that they are capable of addressing more traffic conditions (safety-critical situations, low-speed operations), making them more resilient to disturbances, and limiting the amount of system deactivations and thus preventing safety problems. Transport planners and road operators should be aware of the human limitations in takeover tasks, and be able to account for these variations in their simulation models to ensure safety in mixed traffic.
Declaration of competing interests
The authors declare no competing interests.
Funding
No dedicated funding was received for this project.
CRediT contribution statement
Eleonora Papadimitriou: Conceptualization, Investigation, Methodology, Writing—original draft.
Omiros Athanasiadis: Data curation, Formal analysis, Methodology, Writing—original draft.
Gerdien Klunder: Conceptualization, Methodology, Supervision, Writing—review & editing.
Simeon Calvert: Conceptualization, Methodology, Supervision, Writing—review & editing.
Lin Xiao: Methodology, Software, Writing—review & editing.
Bart van Arem: Conceptualization, Methodology, Supervision, Writing—review & editing.