Exploring the relationship between traffic resilience and driver behaviors through traffic climate
Handling editor: Mette Møller, Technical University of Denmark, Denmark
Reviewers: George Yannis, National Technical University of Athens, Greece
Wouter Van den Berghe, Tilkon Research & Consulting, Belgium
Received: 5 November 2023; Accepted: 12 December 2023; Published: 13 January 2024
Abstract
Traffic safety culture and climate have emerged as an integral part of road safety policy and practice in recent decades, resulting in an emphasis on a holistic approach to road safety through systems thinking. The aim of this study was to investigate the relationship between drivers' perceptions of traffic resilience and traffic climate and their impact on driver behaviors. A total of 216 drivers aged between 19 and 32 years completed an online questionnaire consisting of the Traffic Resilience Scale (TRS), the Traffic Climate Scale (TCS), the Driver Behavior Questionnaire (DBQ), and the Positive Driver Behaviors Scale (PDBS). Serial mediation analyses were conducted to examine the objectives of the study. The results showed that drivers who perceived the traffic system as more resilient tended to perceive the traffic system as more functional and less externally demanding. The drivers' perceptions of traffic resilience were found to be directly related to the traffic climate and indirectly related to the driver behaviors through external affective demands and internal requirements. Increased traffic resilience was associated with increased aberrant behaviors and decreased positive behaviors through reduced external affective demands and internal requirements. These findings can be considered to make a unique contribution to the literature in understanding the motivations behind aberrant behaviors of drivers and highlight the need for road safety policies to take into account road users' perceptions of traffic resilience and traffic climate in order to better understand, predict, and modify road user behaviors for a safer traffic system.
Keywords
driver behaviors, traffic climate, traffic resilience
Introduction
Traffic safety culture has garnered significant interest in decades, as it allows for a better understanding of the various components of the traffic system and can help reduce adverse outcomes while increasing overall traffic safety by modifying the behavior of road users (Edwards et al., 2014; Nakamura & Morimoto, 2022). In addition to concerns surrounding human factors and road traffic crashes, recent developments in vehicle technology and transport systems, such as Mobility as a Service, have highlighted the significance of traffic safety culture (Morimoto et al., 2022).
Although there is no universal conceptualization of traffic safety culture and its components (Edwards et al., 2014), some theoretical and conceptual definitions have been proposed. For example,Edwards et al. (2014) defined traffic safety culture as ‘the assembly of underlying assumptions, beliefs, values and attitudes shared by members of a community, which interact with the community's structures and systems to influence road safety-related behaviours’, considering similarities and differences with organizational safety culture. Nævestad et al. (2019) defined road safety culture (RSC) as ‘shared patterns of behaviour, shared norms prescribing certain road safety behaviours and thus shared expectations regarding the behaviours of others’. In general, traffic safety culture is considered an abstract term (Benzaman et al., 2022), and factors such as physical and social environment (Benzaman et al., 2022), attitudes, norms, beliefs, and behaviors (Dhibi et al., 2022; Nævestad et al., 2019) have been used to conceptualize the construct.
(Edwards et al., 2014) noted that traffic safety culture could be examined at different levels. For example, Nævestad et al. (2020); Nævestad et al. (2022) highlighted regional differences in traffic safety culture. Similarly,Özkan and Lajunen (2015) proposed a conceptual model of traffic safety culture that includes different levels. According to this model, several factors from magna, macro, meso, and micro levels can be associated with traffic safety culture and later related to various driving outcomes. Thus, at the macro level, traffic regulations and political climate have been identified as distal factors related to attitudes towards the traffic system of a country, which is later related to the level of enforcement and crash and fatality rates.
Despite differences in definitions, there is evidence in the literature of the positive impact of traffic safety culture on road safety. For example, Benzaman et al. (2022) concluded that a positive traffic safety culture could be associated with a decreased fatality rate. Similarly,Stringer (2018) observed a decrease in the nationwide number of crashes due to alcohol use when improvements were made in the anti-alcohol traffic safety culture components (i.e. norms, attitudes, beliefs, and values). Traffic safety culture has been linked to various safety outcomes for different road users and their interactions with each other within the complex traffic system with various modes of road users, such as motorcyclists (Chou et al., 2022), cyclists (Nævestad et al., 2020), and drivers (Benzaman et al., 2022). For example, Ward et al. (2020) reported a positive association between traffic safety culture and prosocial behavior during interactions with cyclists.
Within this multidimensional and multi-layered system, the traffic climate can be observed as a reflection of the road users' attitudes and perceptions of the traffic in a traffic system at a specific time. In other words, the traffic (safety) climate acts as an attitude (Gehlert et al., 2014). Road users' perception of the traffic system at the macro level can be measured with the Traffic Climate Scale [Özkan & Lajunen, unpublished]. According to the TCS, traffic climate consists of three aspects: external affective demands, functionality, and internal requirements. The dimension of external affective demands focuses on emotional involvement in traffic and is related to the behavior of others. Functionality is concerned with the requirements of a functional traffic system. Internal requirements aspect is related to the skills and abilities required for successful engagement in the traffic system (Gehlert et al., 2014). The measurement can be used to measure road users' perceptions of traffic climate at the country level (referred to as the macro level) and to interpret differences between road users within countries or between countries (Gehlert et al., 2014; Özkan & Lajunen, 2015; Öztürk et al., 2023; Üzümcüoğlu et al., 2020).
Several self-report studies have investigated the relationship between traffic climate dimensions and driver behaviors and crash involvement (Atombo & Wu, 2022; Chu et al., 2019). External affective demands have been found to be positively associated with aberrant driver behaviors such as errors and violations (Atombo & Wu, 2022; Chu et al., 2019) and negatively related to positive behaviors (Atombo & Wu, 2022; Chu et al., 2019). Functionality was negatively related to violations and lapses (Chu et al., 2019) and positively related to positive behaviors (Chu et al., 2019). In contrast, the opposite relationship has been determined for internal requirements, in which the dimension was positively related to positive behaviors and negatively related to errors and violations (Atombo & Wu, 2022; Chu et al., 2019; Üzümcüoğlu et al., 2020).
The impact of traffic climate on crash involvement is largely driven by driver behaviors. For example, elevated functionality has been linked to reduced crash involvement as a result of increased positive behavior and decreased aberrant behavior (Chu et al., 2019). Nevertheless, direct links between traffic climate and crash involvement are often weaker and mostly insignificant (Atombo & Wu, 2022). In a study by Chu et al. (2019), only internal requirements exhibited a positive association with crash involvement. In a separate study of taxi drivers, functionality was negatively associated with accident involvement (Omidi et al., 2022).
Consistent with the positive impact of traffic safety culture on road safety (Nævestad & Milch, 2023),Gehlert et al. (2014) concluded that traffic (safety) climate is a crucial element in enhancing road safety. The literature has also provided evidence to support the importance of traffic climate for road safety (Feng et al., 2021; Gehlert et al., 2014) withFeng et al. (2021) reporting a negative correlation between external affective demands and road safety awareness.
In respect of the traffic system, the performance of the system may have a crucial role in traffic safety culture. The performance of a traffic system can be evaluated with different indicators such as reliability, vulnerability, robustness, and resilience (Calvert & Snelder, 2018). In the transportation context,Calvert and Snelder (2018) defined resilience as ‘the ability of a road section to resist and to recover from disturbances in traffic flow’ [p. 130]. By evaluating the resilience of the traffic system, traffic characteristics and the needs of the traffic flow can be determined and used to improve the traffic system (Afrin & Yodo, 2020; Nogal & Honfi, 2019).
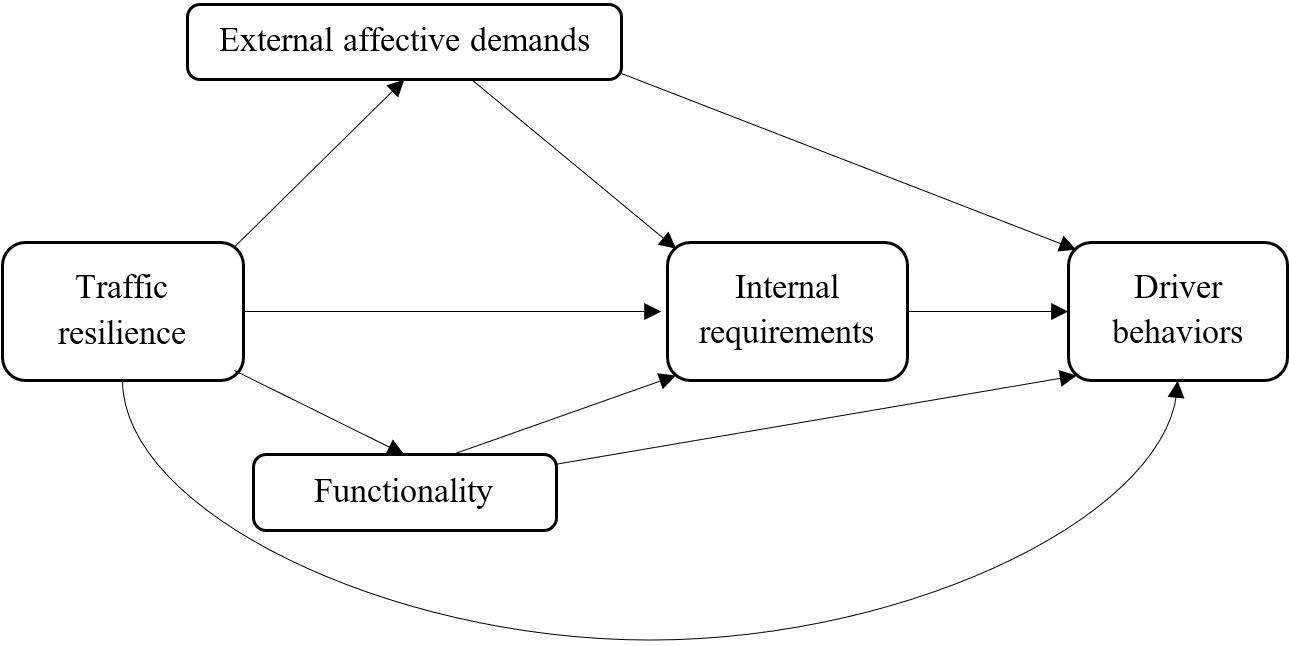
The aim of this study was to examine the relationship between traffic resilience, traffic climate, and driver behaviors in the light of current literature. Specifically, we tested the effects of traffic resilience on driver behaviors through external affective demands and functionality by internal requirements Figure 1. As shown in Figure 1, we investigated a number of direct and indirect effects. This study is the first to have explored drivers' perceptions of traffic resilience in relation to driver behaviors and traffic climate. Compared to previous studies that have focused on traffic resilience and the evaluation of the road network (Afrin & Yodo, 2020; Nogal & Honfi, 2019), the present study can be considered to contribute to the literature by adopting a human factor perspective and measuring drivers' perception of the traffic system's resilience.
In addition to introducing the concept of traffic resilience perception to traffic psychology and road safety studies and measuring the concept through the perception of users, this study makes a theoretical contribution by examining the relationship between external affective demands, functionality, and internal requirements.Gehlert et al. (2014) previously indicated that external affective demands were related to the behaviors of others, while internal requirements concerned the driver's own driving style. While the direct paths from the dimensions of the traffic climate scale to driver behaviors have been previously tested (Atombo & Wu, 2022; Chu et al., 2019; Omidi et al., 2022), the current study model, as depicted in Figure 1, allows us to examine the effects of external traffic climate factors (i.e. external affective demands and functionality) on individual traffic climate factors (i.e. internal requirements).
Method
Participants
The study was conducted in Türkiye with a cohort of 216 drivers aged between 19 and 32 (M = 22.91, SD = 2.34). Of the participants, 84 were female, and 132 were male. On average, participants had covered a distance of 7001.86 kilometers (SD = 8126.31) over the last year.
Measurements
Traffic Resilience Scale
To evaluate traffic resilience, the participants rated the traffic system of the country (Türkiye) according to seven specific criteria, which had been adapted to a traffic context by Güner et al. (2019) from the 100 Resilient Cities guidelines (Rockefeller Foundation, 2023) guidelines. The seven criteria are: reflectiveness, resourcefulness, robustness, redundancy, flexibility, inclusiveness, and integration. During the adaptation process, definitions of the mentioned seven criteria were made for traffic-related context, and relevant examples were determined (see Appendix A). Participants were asked to rate the current traffic system according to these criteria using a 5-point Likert scale ranging from 1 (does not reflect it at all) to 5 (reflects it completely). The Cronbach's alpha reliability was .82.
Traffic Climate Scale
This study measured drivers' perception of the traffic climate of a country using the Traffic Climate Scale (TCS) developed by Özkan and Lajunen [unpublished]. For this purpose, the researchers used the 16-item short version of the TCS (Üzümcüoğlu et al., 2020) to evaluate three aspects of traffic climate: external affective demands (e.g. annoying), internal requirements (e.g. demands alertness), and functionality (e.g. planned). The respondents rated the items on a 6-point Likert scale ranging from 1 (does not describe it at all) to 6 (describes it fully). The Cronbach's alpha reliabilities were determined to be .86 for external affective demands (EAD), .81 for functionality (FUN), and .80 for internal requirements (INT), with eight, five, and three items, respectively.
Driver Behavior Questionnaire and Positive Driver Behaviors Scale
Aberrant driver behaviors were assessed using the Driver Behavior Questionnaire (Reason et al., 1990), which consists of 28 items classified into four factors of aggressive violations (e.g. become angered by another driver and give chase with the intention of giving him/her a piece of your mind), ordinary violations (e.g. disregard the speed limit on a motorway), errors (e.g. attempt to overtake someone that you had not noticed to be signaling a left turn), and lapses (e.g. attempt to drive away from the traffic lights in third gear).Özkan and Lajunen (2005) added a Positive Driver Behavior Scale with 14 items to measure positive driver behaviors (e.g. try to use your high beams less frequently so you do not disturb the oncoming drivers). The overall scale comprised 42 items, and responses were given on a 6-point Likert scale ranging from 0 (never) to 5 (always) to indicate drivers' past behavior. The Cronbach's alpha reliabilities were .72 for lapses with eight items, .71 for errors with eight items, .66 for aggressive violations with three items, .81 for ordinary violations with eight items, and .73 for positive behaviors with 14 items.
Demographic information form
A separate form was provided to gather data on participant demographic data, such as age, gender, and driving experience.
Procedure
The study received ethical approval from the Applied Ethics Research Center of Middle East Technical University (2018-SOS-108). Snowball and convenience sampling methods were employed to recruit participants through social media channels and the department's survey platform using Qualtrics, an online survey platform. The participants who completed the study through the department's system were awarded bonus points for their registered courses via their unique identity numbers. Prior to starting the study, all participants were provided with an informed consent form and participated voluntarily. Anonymity and confidentiality were guaranteed to all participants. The questionnaire took approximately 20 minutes to complete.
Data and analyses
The data were analyzed using SPSS v.26 software. In the first stage of the analysis, invalid responses, partial responses, and outlier scores (z-scores of 3.5) with regard to lifetime kilometers and age were removed from the data and not included in the subsequent analyses.Özkan and Lajunen (2011) stated that exposure to the traffic environment is an important factor in shaping the traffic climate perception of road users, so participants whose annual kilometers were below 500 kilometers were excluded from the study because they may not have had enough exposure to the traffic environment to evaluate traffic climate and traffic system resilience as a driver. The cut-off value was kept at a minimum level to capture a diverse range of young drivers, including those who may have recently obtained their license or who may have relatively low mileage due to specific circumstances. Thus, we aimed to explore a range of perspectives on the perception of traffic system and driver behaviors, considering both novice and more experienced young drivers. The final dataset included 216 participants. Descriptive statistics, correlation coefficients, and moderated mediation analysis results are presented in the Results section. For the moderated mediation analyses, the PROCESS macro, model 80 via 5000 bootstrapping methods (Hayes, 2022), was applied for five different driver behaviors. In each analysis, age, sex, and annual kilometers were entered as control variables.
Results
Descriptive statistics and correlations
Table 1 shows the descriptive statistics and correlations of the study variables. Several significant associations were observed, indicating significant relationships among the variables. In particular, some general patterns of relationships were identified. The traffic resilience index showed positive correlations with functionality, errors, and ordinary violations and negative correlations with external affective demands and internal requirements. While external affective demands and internal requirements displayed positive correlations, functionality exhibited a negative correlation with the other two aspects of traffic climate. Lastly, aberrant driver behaviors demonstrated positive correlations with each other but negative correlations with positive driver behaviors and functionality.
Moderated mediation analysis
Using PROCESS Model 80 (Hayes, 2022), we investigated whether traffic resilience is associated with external affective demands and functionality, which subsequently predict internal requirements and, ultimately, driver behaviors (lapses, errors, aggressive violations, ordinary violations, and positive behaviors, respectively). Given the significant correlations of demographic variables with the other study variables, age, sex, and annual kilometers were entered as control variables. The first part of Table 2 illustrates that traffic resilience predicts internal requirements through external affective demands and functionality, with traffic resilience being positively linked to functionality and negatively associated with external affective demands. Moreover, external affective demands were positively associated with internal requirements.
In terms of driver behaviors, the findings indicated a significant indirect effect of external affective demands on errors and aggressive violations. Increased traffic resilience was associated with decreased external affective demands, which subsequently led to an increase in errors and aggressive violations.
The outcomes also demonstrated a significant indirect effect of external affective demands on all five types of driver behavior through internal requirements. Drivers who perceived the traffic system to be more resilient were more likely to exhibit aberrant behaviors and less likely to engage in positive behaviors as a result of reduced external affective demands and internal requirements.
|
Variables |
1. |
2. |
3. |
4. |
5. |
6. |
7. |
8. |
9. |
10. |
11. |
12. |
13. |
|
|---|---|---|---|---|---|---|---|---|---|---|---|---|---|---|
|
1. |
Age |
1 |
|
|
|
|
|
|
|
|
|
|
|
|
|
2. |
Sex |
.16* |
1 |
|
|
|
|
|
|
|
|
|
|
|
|
3. |
Annual km |
.14* |
.08 |
1 |
|
|
|
|
|
|
|
|
|
|
|
4. |
Total km |
.41*** |
.10 |
.72*** |
1 |
|
|
|
|
|
|
|
|
|
|
5. |
ITR |
-.18** |
.24*** |
-.09 |
-.15* |
1 |
|
|
|
|
|
|
|
|
|
6. |
EAD |
.08 |
-.12 |
.05 |
.09 |
-.43*** |
1 |
|
|
|
|
|
|
|
|
7. |
FUN |
-.18** |
-.03 |
-.19** |
-.22** |
.61*** |
-.44*** |
1 |
|
|
|
|
|
|
|
8. |
IR |
-.00 |
-.20** |
.06 |
.09 |
-.24*** |
.56*** |
-.27*** |
1 |
|
|
|
|
|
|
9. |
Lapses |
-.09 |
-.09 |
.06 |
-.01 |
.12 |
-.03 |
.11 |
-.16* |
1 |
|
|
|
|
|
10. |
Errors |
-.11 |
.11 |
.05 |
-.01 |
.22** |
-.05 |
.14* |
-.22** |
.64*** |
1 |
|
|
|
|
11. |
AV |
.03 |
-.00 |
.24*** |
.26*** |
-.01 |
.11 |
-.11 |
-.06 |
.24*** |
.34*** |
1 |
|
|
|
12. |
OV |
-.04 |
.16* |
.07 |
.15* |
.20** |
-.13 |
.09 |
-.21** |
.42*** |
.57*** |
.46*** |
1 |
|
|
13. |
PB |
.07 |
-.03 |
-.02 |
-.01 |
-.10 |
.21** |
-.04 |
.33*** |
-.23** |
-.29*** |
-.22** |
-.22** |
1 |
|
M |
22.91 |
1.61 |
7001.86 |
26913.95 |
1.98 |
4.94 |
2.80 |
5.51 |
1.87 |
1.75 |
2.36 |
2.18 |
4.47 |
|
|
SD |
2.34 |
.49 |
8126.31 |
41013.50 |
.62 |
.74 |
.89 |
.60 |
.59 |
.62 |
1.00 |
.73 |
60 |
|
|
Minimum |
19.00 |
1.00 |
500.00 |
500.00 |
1.00 |
2.25 |
1.00 |
1.67 |
1.00 |
1.00 |
1.00 |
1.00 |
2.00 |
|
|
Maximum |
32.00 |
2.00 |
50000.00 |
300000.00 |
4.00 |
6.00 |
5.40 |
6.00 |
4.75 |
4.88 |
5.33 |
5.75 |
5.93 |
|
Sex: 0 = Female, 1 = Male; ITR: Index of traffic resilience, EAD: External affective demands; FUN: Functionality; IR: Internal requirements; AV: Aggressive violations; OV: Ordinary violations; PB: Positive behaviors
* p < 0.05; ** p < 0.01; *** p <0.001
|
M1: External affective demands |
M2: Functionality |
M3: Internal requirements |
Y: Lapses |
|||||||||||||
|---|---|---|---|---|---|---|---|---|---|---|---|---|---|---|---|---|
|
β |
SE |
p |
95% CI |
β |
SE |
p |
95% CI |
β |
SE |
p |
95% CI |
β |
SE |
p |
95% CI |
|
|
X: Traffic resilience |
-.51 |
.08 |
<.001 |
-.66, -.35 |
.92 |
.08 |
< .001 |
.76, 1.08 |
.08 |
.08 |
.324 |
-.07, .22 |
.14 |
.09 |
.123 |
-.04, .31 |
|
M1 |
|
|
|
|
|
|
|
|
.44 |
.05 |
< .001 |
.33, .54 |
.13 |
.07 |
.073 |
-.01, .27 |
|
M2 |
|
|
|
|
|
|
|
|
-.06 |
.05 |
.268 |
-.16, .05 |
.02 |
.06 |
.743 |
-.10, .14 |
|
M3 |
|
|
|
|
|
|
|
|
|
|
|
|
-.24 |
.08 |
.003 |
-.40, -.08 |
|
Age |
.00 |
.02 |
.885 |
-.04, .04 |
-.01 |
.02 |
.626 |
-.05, .03 |
-.01 |
.02 |
.689 |
-.04, .02 |
-.01 |
.02 |
.445 |
-.05, .02 |
|
Annual kilometers |
.00 |
.00 |
.792 |
.00, .00 |
.00 |
.00 |
.034 |
.00, .00 |
.00 |
.00 |
.458 |
.00, .00 |
.00 |
.00 |
.122 |
.00, .00 |
|
Sex |
-.04 |
.10 |
.715 |
-.23, .16 |
-.32 |
.10 |
.002 |
-.52, -.12 |
-.19 |
.08 |
.012 |
-.34, -.04 |
-.19 |
.09 |
.034 |
-.37, -.02 |
|
Indirect effects |
|
|
|
|
|
|
|
|
|
|
|
|
|
|
|
|
|
X → M1 → Y |
|
|
|
|
|
|
|
|
|
|
|
|
-.06 |
.05 |
|
-.15, .02 |
|
X → M2 → Y |
|
|
|
|
|
|
|
|
|
|
|
|
.02 |
.05 |
|
-.09, .13 |
|
X → M3 → Y |
|
|
|
|
|
|
|
|
|
|
|
|
-.02 |
.03 |
|
-.08, .02 |
|
X → M1 → M3 → Y |
|
|
|
|
|
|
|
|
|
|
|
|
.05 |
.03 |
|
.00, .11 |
|
X → M2 → M3 → Y |
|
|
|
|
|
|
|
|
|
|
|
|
.01 |
.02 |
|
-.01, .11 |
|
Total effect |
|
|
|
|
|
|
|
|
|
|
|
|
.14 |
.07 |
.046 |
.00, .27 |
|
Direct effect |
|
|
|
|
|
|
|
|
|
|
|
|
.14 |
.09 |
.123 |
-.04, .31 |
|
|
R2 = .19, F(4, 209) = 12.29, p < .001 |
R2 = .43, F(4, 209) = 38.59, p < .001 |
R2 = .34, F(6, 207) = 17.48, p < .001 |
R2 = .08, F(7, 206) = 2.55, p = .015 |
||||||||||||
Continued on next page
|
Y: Errors |
Y: Aggressive Violations |
Y: Ordinary violations |
Y: Positive behaviors |
|||||||||||||
|---|---|---|---|---|---|---|---|---|---|---|---|---|---|---|---|---|
|
β |
SE |
p |
95% CI |
β |
SE |
p |
95% CI |
β |
SE |
p |
95% CI |
β |
SE |
p |
95% CI |
|
|
X: Traffic resilience |
.20 |
.09 |
.024 |
.03, .38 |
.23 |
.15 |
.116 |
-.06, .52 |
.21 |
.11 |
.055 |
-.01, .42 |
-.09 |
.09 |
.299 |
-.26, .08 |
|
M1 |
.19 |
.07 |
.011 |
.04, .33 |
.29 |
.12 |
.014 |
.06, .53 |
.05 |
.09 |
.585 |
-.12, .22 |
.04 |
.07 |
.621 |
-.10, .17 |
|
M2 |
.02 |
.06 |
.729 |
-.10, .14 |
-.14 |
.10 |
.167 |
-.34, .06 |
-.04 |
.07 |
.632 |
-.18, .11 |
.09 |
.06 |
.125 |
-.03, .21 |
|
M3 |
-.30 |
.08 |
.000 |
-.46, -.13 |
-.37 |
.13 |
.006 |
-.64, -.11 |
-.25 |
.10 |
.011 |
-.45, -.06 |
.33 |
.08 |
<.001 |
.17, .49 |
|
Age |
-.03 |
.02 |
.106 |
-.07, .01 |
.00 |
.03 |
.963 |
-.06, .06 |
-.01 |
.02 |
.600 |
-.05, .03 |
.02 |
.02 |
.308 |
-.02, .05 |
|
Annual kilometers |
.00 |
.00 |
.181 |
.00, .00 |
.00 |
.00 |
<.001 |
.00, .00 |
.00 |
.00 |
.215 |
.00, .00 |
.00 |
.00 |
.499 |
.00, .00 |
|
Sex |
.06 |
.06 |
.550 |
-.13, .24 |
-.19 |
.15 |
.203 |
-.48, .10 |
.10 |
.11 |
.348 |
-.11, .32 |
.07 |
.09 |
.403 |
-.10, .25 |
|
Indirect effects |
|
|
|
|
|
|
|
|
|
|
|
|
|
|
|
|
|
X → M1 → Y |
-.09 |
.04 |
|
-.18, -.01 |
-.15 |
.06 |
|
-.28, -.03 |
-.02 |
.06 |
|
-.14, .09 |
-.02 |
.04 |
|
-.09, .06 |
|
X → M2 → Y |
.02 |
.06 |
|
-.10, .14 |
-.13 |
.10 |
|
-.32, .06 |
-.03 |
.08 |
|
-.18, .12 |
.09 |
.06 |
|
-.03, .20 |
|
X → M3 → Y |
-.02 |
.03 |
|
-.10, .02 |
-.03 |
.04 |
|
-.12, .03 |
-.02 |
.03 |
|
-.09, .02 |
.03 |
.03 |
|
-.04, .08 |
|
X → M1 → M3 → Y |
.07 |
.03 |
|
.01, .14 |
.08 |
.04 |
|
.02, .16 |
.06 |
.03 |
|
.00, .12 |
-.07 |
.03 |
|
-.13, -.03 |
|
X → M2 → M3 → Y |
.02 |
.02 |
|
-.01, .06 |
.02 |
.02 |
|
-.02, .08 |
.01 |
.02 |
|
-.01, .05 |
-.02 |
.02 |
|
-.05, .02 |
|
Total effect |
.19 |
.07 |
.008 |
.05, .33 |
.03 |
.11 |
.806 |
-.20, .25 |
.20 |
.08 |
.017 |
.04, .36 |
-.09 |
.07 |
.207 |
-.23, .05 |
|
Direct effect |
.20 |
.09 |
.024 |
.03, .38 |
.23 |
.15 |
.116 |
-.06, .52 |
.21 |
.11 |
.055 |
-.01, .42 |
-.09 |
.09 |
.299 |
-.26, .08 |
|
|
R2 = .07, F(7, 206) = 4.18, p < .001 |
R2 = .11, F(7, 206) = 3.70, p = .001 |
R2 = .09, F(7, 206) = 2.87, p = .007 |
R2 = .13, F(7, 206) = 4.22, p < .001 |
||||||||||||
Table 2 continued
Discussion
The aim of the current study was to explore, for the first time in the literature, how the relationship between drivers' perceptions of traffic resilience and their self-reported driver behaviors was mediated by their perceptions of traffic climate. To achieve this, a series of serial mediation analyses were conducted to examine the role of traffic climate in the relationship between traffic resilience and driver behaviors.
In terms of the analysis focusing on the interaction between traffic resilience and aspects of traffic climate, drivers who perceived the traffic system in Türkiye to be more resilient tended to rate the system as more functional and less externally demanding. In other words, drivers who perceive the traffic system as more resourceful, robust, redundant, and able to withstand adverse events tend to perceive the system as more functional and less emotionally demanding. It is noteworthy that the model with traffic resilience accounted for the largest proportion of the explained variance in the functionality dimension of traffic climate. This is not surprising as the functionality dimensions are related to the safety and mobility aspects of the traffic system (Özkan & Lajunen, 2015). Given the characteristics of traffic resilience and the definitions of functionality, the observed positive relationship between the two can be interpreted as evidence of the validity of the concept of traffic resilience in the context of drivers' perception of traffic climate.
As stated by Gehlert et al. (2014), external affective demands pertain to the behaviors of other road users, whereas internal requirements refer to the skills and competencies that the traffic system expects from the driver/road user. Therefore, it is understandable that drivers who perceived the traffic system as more demanding also perceived that the traffic system requires greater skills and aptitude to navigate. It could be argued that the behaviors of others in the traffic system resulted in increased external affective demands on drivers, which were also reflected in increased internal requirements. However, when traffic resilience was included in the equation, external affective demands were reduced. Given the relationship between traffic resilience and traffic climate, increased resilience may increase the perceived safety of road users as it is associated with increased functionality and decreased external affective demands (Gehlert et al., 2014). Supporting the previous studies (Atombo & Wu, 2022; Chu et al., 2019; Üzümcüoğlu et al., 2020), the results of this study showed that external affective demands were positively related to errors and aggressive violations, and internal requirements were positively related to positive behaviors and negatively related to aberrant driver behaviors.
Apart from the direct associations between traffic climate dimensions and driver behaviors as demonstrated in previous studies, one of the main contributions of this study was to investigate the role of internal requirements in the mediation role between the external affective demands/functionality and driver behaviors relationship. Our results partially supported this model; it was found that the relationship between traffic resilience and driver behaviors was found to be mediated by external affective demands and internal requirements. That is, traffic resilience has an effect on external affective demands and internal requirements, and the latter variables cause drivers to behave in certain ways. As noted earlier, a resilient traffic system is expected to be one that is safer for all road users because the system is functional and less demanding. However, it was interesting that the results of the overall model showed that drivers who perceived the traffic system to be more resilient reported more aberrant behaviors and fewer positive behaviors, which were mediated by reduced external affective demands and internal requirements. As discussed earlier, the perception of a resilient traffic system may provide a sense of safety and confidence that the system can withstand a certain level of disruption. From this perspective, the belief that the transport system can cope with a certain level of disruption may explain some of the motivation to engage in more aberrant behaviors.
Various safety indicators (Türkiye İstatistik Kurumu, 2019; WHO, 2018) show that the traffic system in Türkiye is relatively dangerous and needs further improvement. From this perspective, it is possible to argue that to achieve resilience goals, drivers who perceive the system as more resilient might reflect an optimism bias (DeJoy, 1989; White et al., 2011) toward the traffic system. As a result of this belief, drivers may believe that their actions will not result in negative consequences because the transportation system is capable of absorbing them. In other words, drivers may justify their noncompliant behavior by suggesting that the traffic system can overlook it. For this group of drivers, certain intervention programs, such as accountability manipulations (White et al., 2011) may decrease the degree of optimism bias. For example, in a study with e-bikers, Wang et al. (2018) found that riders with higher safety responsibility exhibited fewer aberrant behaviors.
Similarly,Özkan and Lajunen (2005) defined positive behaviors as behaviors that ‘take care of the traffic environment or other road users, to help and to be polite with or without safety concerns’ [p. 357]. For drivers who perceive the traffic system as more resilient, these behaviors may be perceived as unnecessary, as they believe the traffic system does not require additional attention from the road users themselves to improve the overall safety of the traffic system.
A number of critical remarks concerning the present study should be considered when interpreting the results. First and foremost, given the sample size and age distribution of the study, the use of a non-representative sample poses a potential challenge to the generalizability of our findings beyond the population studied. In addition, although anonymity and confidentiality of responses were ensured, we recognize the inherent risk of socially desirable responses within our study methodology (Yılmaz et al., 2022). The cross-sectional design and self-report methodology used in this study make it difficult to establish causal relationships. Other methods, such as expert evaluation, machine learning, and more qualitative methods, can be used to draw stronger conclusions. Therefore, we recommend that road users' perceptions of traffic safety and traffic climate be considered in the development and implementation of road safety policies to examine changes in behaviors and attitudes over time.
The results of the current study showed that while road users perceive the traffic system as resilient, it can also serve as a potential justification for the increases in the frequency of aberrant behaviors of road users. Therefore, although a potential positive traffic safety culture and climate is a desirable thing for road safety, planners and policymakers should also consider the fact that the roots (i.e. resilience perception in the present study) of perceiving traffic climate in a certain way might result in differences in the outcome. More research is needed on cultural aspects that could be related to the relationships evidenced in the present study. Only then will it be possible to understand why people displayed riskier behaviors on the roads when they perceived that the system was resilient. Expanding the age group or examining the relationships and variables identified with different road user groups may lead to more generalizable findings and provide detailed information about the traffic system and the perspective of road users within that system. In addition, focusing on the traffic system of a more limited area (e.g. region or county) may provide insight into the priority needs of that area for improving road safety.
In conclusion, the present study investigated the relationships between traffic resilience, traffic climate, and driver behaviors. The results showed that drivers' perception of traffic resilience was directly related to their perceptions of traffic climate and indirectly related to the driver behaviors through external affective demands and internal requirements. Increased traffic resilience was associated with increased aberrant behaviors and decreased positive behaviors through decreased external affective demands and internal requirements. The serial mediation model tested in this study provided new insight into the relationship between traffic climate factors by representing the interaction between external affective demands and internal requirements in explaining driver behaviors. It could be suggested that enforcement, campaigns, and training programs should be part of the road safety policy to provide road users with the right understanding and messages, together with the right planning agenda for them. However, this study showed that in order to do this in the correct and most beneficial way, it is critical to understand how perceptions of resilience and climate in traffic settings are related to each other, which then result inending up with driver behaviors on the roads.
Availability of data
Data will be available upon request.
Funding
The project did not receive any financial support.
Declaration of competing interests
The authors have no conflict of interests to declare.
CRediT contribution statement
İbrahim Öztürk: Conceptualization, Formal analysis, Investigation, Methodology, Project administration, Writing—original draft, Writing—review & editing.
Ece Tümer: Conceptualization, Methodology, Writing—review & editing.
Bahar Öz: Conceptualization, Methodology, Supervision, Writing—review & editing.