Isaksson Hellman & Lindman | Traffic Safety Research vol. 4 (2023) 000036
Estimating the crash reducing effect of Advanced Driver Assistance Systems (ADAS) for vulnerable road users
Handling editor: Carmelo D'Agostino, Lund University, Sweden
Reviewers: Giulio Bianchi Piccinini, Aalborg University, Denmark
Aliaksei Laureshyn, Lund University, Sweden
Received: 16 May 2023; Accepted: 16 October 2023; Published: 7 November 2023
Abstract
Vulnerable road users (VRUs) are frequently involved in road traffic crashes worldwide, and the most serious consequences often occur in collisions with motor vehicles. Countermeasures such as Advanced Driver Assistance Systems (ADAS) for VRUs have been developed and implemented in vehicles to reduce these crashes. Estimations of the effectiveness of these systems are so far dominated by prospective studies; only a few analyze real-world crash data. The objective of this study was to estimate the crash-reducing effects of the VRU ADAS systems in car-to-pedestrian and car-to-bicycle crashes involving Volvo cars in Sweden using real-world crash data. Car-to-pedestrian and car-to-bicycle collisions across Sweden from 2015–2020 (in which the car was moving forward) were identified using insurance claims at If P&C insurance. Volvo car models with ADAS VRU and comparable Volvo models without the system were selected. Poisson regression was used to estimate the effect of the VRU ADAS on the crash rate, calculated per insured vehicle-years. For the second generation of VRU ADAS, the straight crossing path (SCP) and parallel (Longitudinal) crash rate was found to be 12% less in car-to-pedestrian/bicycle crashes—23% less in car-to-pedestrian crashes and 6% less in car-to-bicycle crashes. However, no results were statistically significant. There was no difference in crash rates when evaluating all crash situations where the car was moving forward. The limitation of this study is the low number of crashes. Reducing crashes and injuries in vehicle-to-VRU conflicts is of utmost importance for fulfilling the aims highlighted in Agenda 2030. Improving ADAS to better avoid collisions with pedestrians and cyclists has the potential to greatly improve traffic safety; future generations of the system are expected to increase VRU safety benefits. Measuring ADAS effects in real-world traffic and interpreting and relating the results are essential to ensure that future systems improve VRU safety.
Keywords
Advanced Driver Assistance Systems (ADAS), real-world evaluation, vulnerable road users
Introduction
The outcome for a vulnerable road user (VRU) in a crash with a vehicle is largely dependent on the vehicles' front design and its crash avoiding technologies. Advanced driver-assistance systems (ADASs) are designed to avoid, or at least mitigate, crashes by alerting the driver in critical situations—and if necessary, performing countermeasures such as automatically braking or steering the vehicle. Evaluations based on data from real-world traffic are needed to improve the effectiveness of these countermeasures in vehicle-to-VRU crashes.
Previous research from 2010–2023 employed various methods and tools, based on different data sources, to estimate the crash- and/or injury-reducing effect of various VRU ADAS in real-world traffic (see Appendix A and Appendix B). For example, results have been presented for straight crossing path (SCP) situations where a VRU crossed the road in front of the car, which was going straight; and for situations where the VRU and car was moving in the same or opposite parallel direction (Longitudinal). In general, effectiveness estimations compare the crash rate for cars without and with ADAS (baseline and treatment, respectively).
Both prospective and retrospective studies use real-world crash data as input, and both seek to provide an estimate of the ADAS' effectiveness in terms of crash-related parameters in real-world traffic. The representativity and level of detail in the data collected from VRU crashes affect the estimated effect of the VRU ADAS. Further, the data selected (such as all vehicle-to-VRU crashes or a specific conflict situation) also determine the outcome. Thus, results must be interpreted in the context of the specific situations included. The main difference between them is that in prospective studies, the treatment condition must be virtually simulated, while in retrospective studies historical real-world crash data are used for both baseline and treatment.
Review of retrospective studies
To date, most retrospective studies (see Appendix A) focused on car-to-pedestrian crashes (Cicchino, 2022; Isaksson-Hellman & Lindman, 2019; Kullgren et al., 2023; Leslie et al., 2021; Leslie et al., 2022; Spicer et al., 2021; Wakeman et al., 2019) when evaluating the effectiveness of VRU ADAS, while a few evaluations targeted car-to-bicycle crashes (Cicchino, 2023; Isaksson-Hellman & Lindman, 2019; Kullgren et al., 2023). The studies were mainly based on data from police-reported crashes and/or data collected by insurance companies. The effect estimations in the reviewed literature were obtained either by regression analysis on crashes per insured vehicle-years (Cicchino, 2022; Cicchino, 2023; Isaksson-Hellman & Lindman, 2019; Wakeman et al., 2019), survival analysis (Spicer et al., 2021), or quasi-induced exposure methods (Cicchino, 2022; Cicchino, 2023; Kullgren et al., 2023; Leslie et al., 2021; Leslie et al., 2022; PARTS, 2022).
Retrospective studies examining car-to-VRU crashes reported a wide range of results. The results of studies based on police-reported crashes are converging, suggesting that VRU ADAS reduces pedestrian crashes by 13%–27% (Cicchino, 2022; Kullgren et al., 2023; Leslie et al., 2021; Leslie et al., 2022; Spicer et al., 2021), although most of these studies were limited by the large variety of vehicle makes and models represented. In contrast, studies based on insurance claims reported a wider range of crash avoidance results for pedestrian collisions: 18%–57%, depending on the car model (Isaksson-Hellman & Lindman, 2019; Wakeman et al., 2019). Longitudinal car-to-bicycle crash rates were reduced by almost one third in a US study of a specific car make (Cicchino, 2023). One study reported that vehicle-to-non- motorist police-reported crashes were reduced by about 4%, not significant (PARTS, 2022).
Review of prospective studies
Prospective studies have been completed for cyclists, pedestrians, and powered two-wheeler (PTW) ADAS (see Appendix B). The studies used different simulation methods and tools, baseline approaches, and input data.
Methods and tools for simulation
All studies used some type of virtual simulation, sometimes accompanied by test-track testing. The virtual simulation setup itself can influence the evaluation of the effect (Wimmer et al., 2019), and should therefore be considered when reviewing and interpreting the results. Some studies used simulation tools that were open source or available commercially (Abdel-Aty et al., 2022; Klug et al., 2018; Paéz et al., 2015; Schachner et al., 2020; Siebke et al., 2023; Zhao et al., 2019) and details are suggested to be found in referenced documents.
However, in-house tools were more often used, and the setup and validation procedures were described in the works themselves with different levels of detail.
Baseline approach
In a prospective evaluation, the baseline describes the reference traffic situations to be analyzed by virtual simulations. The traffic situation model is created using input parameters from real-world data, such as traffic elements (vehicles and VRUs), surroundings (road dimensions and objects) and environmental conditions (weather and light). According to the classification in (Wimmer et al., 2023), baselines are created using one of three main approaches:
-
Approach A. Reconstructed real-world situations (crashes or near-crashes).
-
Approach B. Reconstructed real-world situations together with variations (synthetic cases created in order to provide a more robust baseline).
-
Approach C. Synthetic cases based on traffic-situation parameter distributions from crash and traffic data.
Synthetic cases are created using sampling techniques or by applying driver modeling in both Approaches B and C.
In the reviewed studies, Approach A baselines were the most common (Chajmowicz et al., 2019; Char et al., 2020; Gruber et al., 2019; Hamdane et al., 2015; Haus et al., 2019; Jeppsson et al., 2018; Kovaceva et al., 2019; Lindman et al., 2010; Paéz et al., 2015; Rosén, 2013; Volvo, 2016; Yanagisawa et al., 2019; Zhao et al., 2019), followed by Approach C (Abdel-Aty et al., 2022; Denk et al., 2022; Edwards et al., 2014; Helmer, 2014; Schachner et al., 2020; Siebke et al., 2023; Sui et al., 2021); one study used Approach B (Sui et al., 2021), see column ‘Baseline approach and input data’ in Appendix B.
Baseline input data
The method used to collect baseline data will affect the results, as these data are used to model the crash situations used for virtual simulations. The details in the crash situation description are therefore more important than they are in retrospective studies, since detailed pre-crash trajectories (for example) are mandatory to estimate ADAS effectiveness.
Clearly, objectively measured data from pre-crash and crash situations provide the best input, since subjective recorded data (such as witness statements and expert judgments) always come with some degree of bias resulting from decisions made during the collection procedure. Today, most crash databases with a large number of crashes rely to a great extent on subjective data. Some smaller data sets, such as the one described by (Zhao et al., 2019), provide more objective, detailed input for the baseline.
Estimated benefit from ADAS
In contrast to retrospective evaluations of VRU ADAS, only two out of 21 prospective studies refer to ADAS technologies that are available in vehicles in real-world traffic (Lindman et al., 2010; Yanagisawa et al., 2019). Instead, most of the prospective studies apply a VRU ADAS described as a ‘conceptual’, ‘general’ or ‘status quo’ type of VRU ADAS. These studies typically aim to demonstrate the benefit assessment method, but they may also evaluate parameter effects (activation time, field of view, and brake level, for example) in different ADAS settings. Examples of results are presented in Appendix B, while more results are available in the reports.
Some studies include consideration of elements as market penetration, user acceptance levels and weighting to national vehicle populations, making them more comparable to retrospective studies (Edwards et al., 2014; Klug et al., 2018; Kovaceva et al., 2019).
The variety of baseline approaches, input data, and simulation tools does not allow for direct comparison between methods. Altogether, prospective study results for VRU ADAS estimate a wide variety of benefits, as can be seen in Appendix B, and clear trends were hard to identify in the presented findings.
Study aim
Given the great variety in assessments of VRU ADAS effectiveness, further work is needed to establish useful estimates. The aim of this study was to use real-world crash data to estimate the crash-reducing effects of car-to-pedestrian and car-to-bicycle crashes for the VRU ADAS systems in Volvo cars in Sweden, expanding on a previous study (Isaksson-Hellman & Lindman, 2019), by including car models with the second-generation VRU ADAS and using more data.
Data and method
Insurance claims data collected by If P&C insurance company 1 in Sweden were used to evaluate VRU ADAS by comparing crash rates. VRU ADAS with pedestrian and cyclist detection are part of the crash avoidance system platform in Volvo car models included in this study. The effects of VRU ADAS on cyclist and pedestrian crashes were estimated, both together and separately. The analyses were performed using crash data for the years 2015–2020.
System description
The VRU ADAS with pedestrian detection was available in the optional crash avoidance system as a feature in the Volvo S/V60 models from 2010, model year (MY) 2011; in the V/XC70, XC60 and S80 models from MY 2012; and in the V40 from MY 2013. Starting in 2012 (MY 2013), VRU ADAS with cyclist detection was added to the optional crash avoidance system in the same Volvo models. Models introduced from 2015 on, starting with the new XC90, are equipped with VRU ADAS (both pedestrian and cyclist detection) as standard.
The system uses a long-range radar and a forward-sensing wide-angle camera that continuously monitors the area in front of the vehicle. For optimal pedestrian detection, the system needs a clear view of the person’s head, arms, shoulders, legs, and the upper and lower parts of the body—and the person should be moving normally (Figure 1a). If large parts of the pedestrian’s body are not visible, the system cannot detect it. In the first generation of VRU ADAS, its capacity for detection in darkness was limited. The second generation, introduced in 2015, represents a great improvement; however, some contrast between the VRU’s silhouette and the background is still needed for detection.
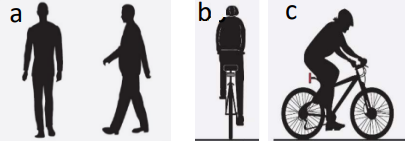
The first generation of the system was only able to detect cyclists traveling in the same direction from behind (Figure 1b). In the second generation of the system, introduced in 2015, cyclists can also be recognized from a side view (Figure 1c). In all cases, the system must be able to detect, distinct body and bicycle outlines.
Data collection
Insurance data
Crash and exposure data from cars with third-party liability insurance at If P&C insurance were used for the analysis. Both low-severity crashes and severe crashes are included in the data. All car-to-bicycle and car-to-pedestrian collision information is continuously coded and stored in two crash databases, If_VRUC and If_VRUP (Isaksson-Hellman, 2012). Crash situations are coded, classified, and used for specific conflict situation analysis. Exposure data are available from insurance files. Information about the selected car models (make, model, model year, and optional car features such as ADAS), was used to calculate the exposure in insured vehicle years (IVY) 2 .
Insurance data vs police-reported data
Police-reported crashes form the basis of the official statistics in Sweden and reflect the situation of traffic accidents on a national level. The STRADA (Swedish Traffic Accident Data Acquisition) database includes all police-reported crashes with personal injuries.
However, the proportion of crashes actually reported to the police may differ by road user group, which can misrepresent the true picture of accident outcomes (Forsman & Eriksson, 2023). It is a well-known fact that car-to-VRU crashes, especially car-to-bicycle crashes, are often under-reported in official statistics in many countries (Amoros et al., 2006; Aultman-Hall & Kaltenecker, 1999; Elvik & Mysen, 1999).
Due to their different methods and inclusion criteria, different databases can never be directly compared. However, different sources of information can add valuable knowledge, so they should be considered together—and interpreted appropriately. Table 1 shows the total number of police-reported car-to-bicycle/pedestrian crashes, as well as the number of police- reported Volvo cars (no specific model) in car-to-bicycle/pedestrian crashes in STRADA. Unlike crashes in STRADA, those in If_VRUP and If_VRUC are based on insurance claims data, representing the number of crashes for cars with third-party liability at If P&C insurance which have been reported by the policy holder or the VRU. These numbers are also presented in Table 1. Table 1 also shows the number of expected cases in the If P&C insurance claims sample, given the share of third-party liability policies on the Swedish market, for comparison with the actual number of cases. The data were collected from 2015–2020 from cars of MY ≥ 2015. A study by Forsman and Eriksson (2023) determined that a larger proportion of pedestrian crashes is reported to the police than that of cyclist crashes. The risk of fatal or severe injury is higher for a pedestrian than a cyclist, but crashes with cyclists are more frequent (Eriksson et al., 2022). In If_VRUP, the number of pedestrian crashes is approximately as expected (in relation to the share of insured vehicles), while If_VRUC have proportionally more cyclist crashes than expected.
|
STRADA |
If_VRUP/C |
If_VRUP/C* |
||
|---|---|---|---|---|
|
All makes and models, MY ≥ 2015 |
All Volvo Car models, MY ≥ 2015 |
Selected Volvo Car models, MY ≥ 2015 |
Selected Volvo Car models, MY ≥ 2015 |
|
|
Car-to-pedestrian crashes, 2015–2020 |
860 |
141 |
79 |
84.6 |
|
Car-to-bicycle crashes, 2015–2020 |
1 420 |
202 |
160 |
121.2 |
*Expected cases—the number of crashes from If P&C insurance claims, given the share of third-party liability policies on the Swedish market and the number of crashes in STRADA
There is no readily available conflict situation classification in nationally representative crash databases, but a few studies have estimated the probabilities for specific car-to-VRU conflict situations by nation in Europe (Fredriksson et al., 2014; Klug et al., 2018; Van_Der_Zweep et al., 2014). The results converge towards a share of 60% for SCP and 10% for Longitudinal situations in car-to-bicycle crashes, and 75% and 10% (respectively) in car-to-pedestrian crashes. In the insurance data used in this study, the shares were 62% for SCP and 11% for Longitudinal situations for cyclists and 65% for SCP and 14% for Longitudinal situations for pedestrians. Applying these percentages to the data in Table 1 we get an indication that, on average, approximately 250 SCP (0.75 * (860 / 6) + 0.6 * (1420 / 6)) and 40 Longitudinal (0.1 * (860 / 6) + 0.1 * (1420 / 6)) car-to-VRU crashes with makes and models MY ≥ 2015 occur per year in Sweden.
Data selection
VRU crashes with the following Volvo car models: S/V/XC60, V/XC70, and S80 (model year 2011 and onwards); V40 (model years 2013–2019 with and without optional mounted VRU ADAS); and the later Volvo car models (introduced 2015 and onwards) S/V/XC90, S/V/XC60, and XC40 (with the system as standard) were selected. The crashes occurred in the years 2015–2020, representing both the first and second generations of the VRU ADAS. This data set of combined crashes is hereafter referred to as ‘1st and 2nd Gen’.
To explore the second-generation VRU ADAS introduced in 2015, a subset of the crash data was studied for crash years 2018–2020 and cars of model year ≥ 2015 (hereafter referred to as ‘2nd Gen’). System improvements included better pedestrian recognition in darkness, and recognition of cyclists in SCP situations, see Figure 1c (Volvo, 2016).
Exposure data
Exposure data were calculated for all selected Volvo Car models with third-party liability insurance. The exposure for cars with and without VRU ADAS for 1st and 2nd Gen, and 2nd Gen only, are presented in Table 2.
|
Pedestrian |
Cyclist |
|||
|---|---|---|---|---|
|
VRU ADAS |
No VRU ADAS |
VRU ADAS |
No VRU ADAS |
|
|
Exposure (IVY, Insured Vehicle Years) |
||||
|
1st and 2nd Gen |
567 006 |
681 112 |
552 188 |
581 560 |
|
2nd Gen |
402 770 |
190 178 |
402 770 |
190 178 |
|
Number of crashes |
||||
|
1st and 2nd Gen |
43 (54) |
49 (61) |
96 (102) |
89 (107) |
|
2nd Gen |
28 |
11 |
66 |
27 |
Crash data
The number of car-to-VRU crashes with and without VRU ADAS in which the car was moving forward which were selected for this study can be seen in Table 2. Crashes in which the vehicle reversed or stood still (e.g. the cyclist hit the open car door) from the original data (numbers in parentheses inTable 2) were not considered. Some other crashes were not included, such as those where skidding or other loss of control preceded the crash. While these crashes should be assessed at some point, they are beyond the scope of this evaluation of the current VRU ADAS.
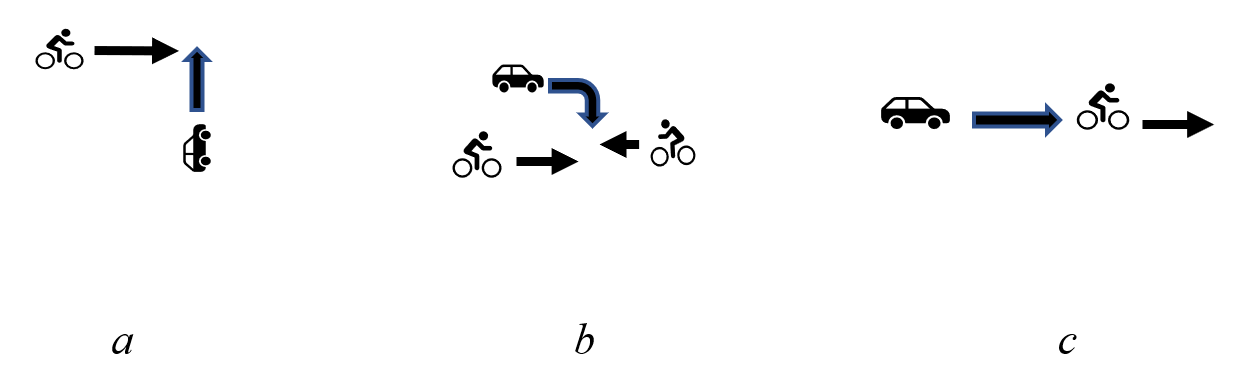
The selected car-to-pedestrian/bicycle collisions were categorized into four types of conflict situation groups (see Table 3 and Figure 2, also Figure 3).
|
Conflict situation group |
Description |
Example |
|---|---|---|
|
SCP (Straight Crossing Path) |
all situations where pedestrian/bicycle crosses the path of a car moving straight |
Figure 2 a |
|
Car turning |
pedestrian/bicycle is crosses the path of a turning car |
Figure 2 b |
|
Longitudinal |
pedestrian/cyclist and car moves in parallel pedestrian/bicycle moving in the same or opposite direction |
Figure 2 c |
|
Other |
collisions in parking lots, etc. |
— |
Car-to-bicycle collisions are somewhat different than car-to-pedestrian collisions: for example, cyclists reach higher speeds than pedestrians, with implications for various types of crashes. Sometimes the cyclist hit the car and sometimes the car hit the cyclist. In both situations, it has been suggested that the VRU ADAS system can mitigate the crash severity. The number of car-to-bicycle collisions are approximately twice as many as car-to-pedestrian collisions, two per 100 000 vehicle years and one per 100 000 vehicle years, respectively.
Also, the injury severity according to the Abbreviated Injury Scale, AIS (AAAM, 2005), differs in general between car-to-pedestrian and car-to-bicycle crashes, the pedestrian is often hit directly by the car which is not always the case for the cyclist. Maximum AIS (MAIS) in the selected data were for the pedestrians: no or minor injuries (MAIS 0–1) 57.6%; moderate injuries (MAIS 2) 27.2%; severe to fatal injuries (MAIS 3–6) 15.2%; and for cyclists: no or minor 77%; moderate 23%. In this specific dataset no severe to fatal injury was found for the cyclists but in the total cyclist database If_VRUC approximately 5% were MAIS 3–6 injuries (Isaksson-Hellman, 2012).
Car-to-pedestrian crash data
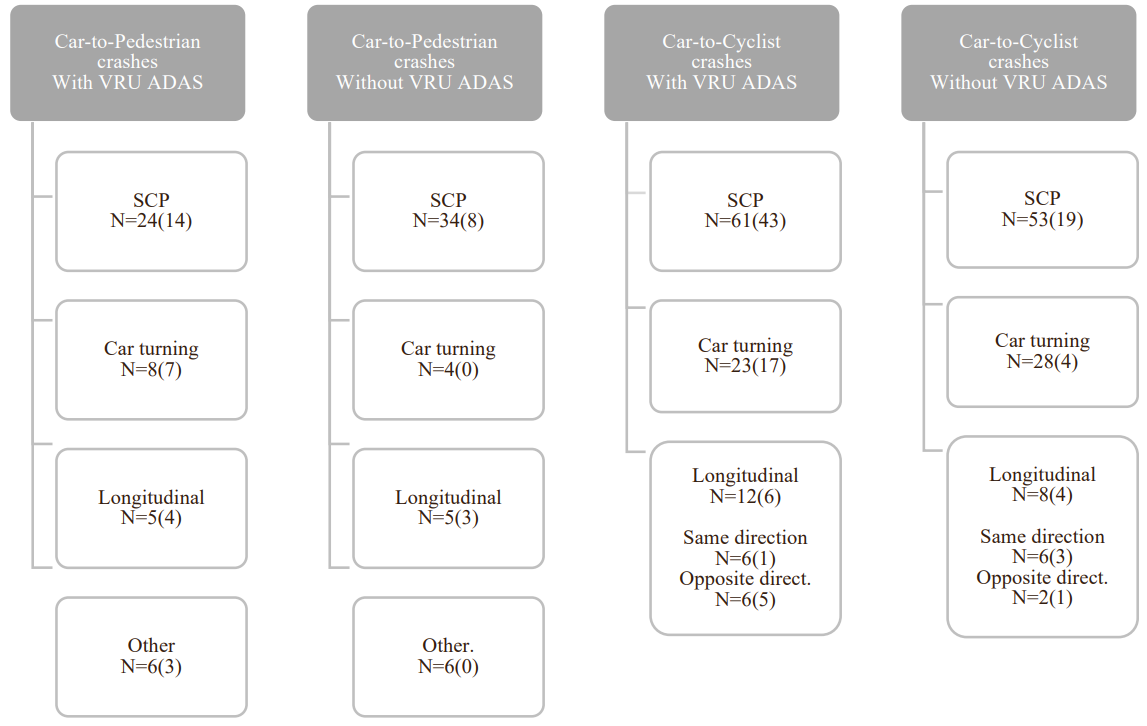
1st and 2nd Gen car-to-pedestrian collisions selected for the analysis comprised 43 cases with VRU ADAS and 49 cases without, between 2015 and 2020. Of the 43 collisions involving cars with the system, 24 were SCP situations, 8 were Car turning, 5 were Longitudinal, and 6 were Other. Of the 49 collisions involving cars not equipped with the ADAS system, 34 were SCP, 4 were Car turning, 5 were Longitudinal, and 6 were Other. For the subset 2nd Gen, collected between 2018 and 2020 the numbers in each category are given in parentheses in Figure 3.
Car-to-cyclist crash data
For car-to-bicycle collisions 1st and 2nd Gen that occurred between 2015 and 2020, 96 cases with and 89 cases without VRU ADAS were selected for analysis. Of the 96 collisions involving cars with VRU ADAS, 61 were SCP situations (in 51 cases the car hit the bicycle and in 10 cases the bicycle hit the car), 23 were Car turning and 12 collisions were Longitudinal (in 6 they were traveling in the same direction and in 6 in the opposite direction).
For the subset 2nd Gen the corresponding numbers can be seen in Figure 3 in parentheses. The number of car-to-bicycle collisions in each category for cars without the system was as follows: 53 SCP (in 39 cases the car hit the bicycle and in 14 cases the bicycle hit the car), 28 Car turning, 8 Longitudinal (6 travelling in the same direction and 2 in opposite direction).
Car-to-VRU crash data
The same ADAS system is responsible for the avoidance of crashes with both cyclists and pedestrians. A summary of pedestrian and bicycle crashes and an analysis of the second generation of the VRU ADAS were performed by merging crash data from the above pedestrian and cyclist crashes (2nd Gen).
Statistical methods
The rate of car-to-VRU collisions per 10 000 IVYs was compared for cars with and without the VRU ADAS system.
The rate for VRU ADAS cars was defined as:
where N is the number of car-to-VRU collisions (based on the number of claims). The rate was considered using a Poisson distribution. Exact 95% Poisson confidence limits for the estimated rate were calculated as:
The rate and confidence interval for non-VRU ADAS cars were defined comparably.
Poisson regression was used for the calculations, performed with PROC GENMOD (SAS, n.d.), using a model with a logarithmic link function. Regression models were constructed for the total number of car-to-VRU collisions. Rate ratios (RRs) together with 95% confidence limits were obtained from the output. The system's effectiveness (the reduction in crashes as a percentage) was calculated as (1 − RR) ∗ 100.
Data did not allow for control of confounders but were stratified in various subsets for separate analysis. Car-to-pedestrian and car-to-bicycle collisions were analyzed both as one group and separately, for 1st nd 2nd Gen of ADAS, as well as for the 2nd Gen.
Also, the data were stratified in three groups of situations for separate analyses:
(a) all situations with the car moving forward
(b) SCP from (a)
(c) SCP + Longitudinal from (a).
Since SCP has been a EuroNCAP test-scenario from the start of AEB testing (EuroNCAP, 2015), and Longitudinal was added to the protocols quite soon after (EuroNCAP, 2017), it was considered feasible to perform separate analyses for these two categories of crashes.
Results
There were 92 car-to-pedestrian and 185 car-to-bicycle crashes occurring from 2015–2020 involving the selected vehicles, with and without VRU ADAS. There were 39 car-to-pedestrian and 93 car-to-bicycle crashes from 2018–2020 with cars of model years ≥ 2015. The results show either no effect or higher crash rates for VRU ADAS when all crashes are evaluated, while in SCP and SCP + Longitudinal situations a reduction of 11–23% was found for car-to-pedestrian crashes. For the second generation of VRU ADAS, a reduction of 6% in SCP + Longitudinal situations was estimated for car-to-bicycle crashes and 12% for car-to-pedestrians/bicycles, although no results were significant.
Car-to-VRU collisions
When car-to-pedestrian and car-to-bicycle collisions were merged together, there were 94 cars involving cars with VRU ADAS and 38 involving cars without included in 2nd Gen. The numbers of insured vehicle years for cars with VRU ADAS and without were 402 770 and 190 178 respectively (see Table 2).
|
Sample of crashes |
Rate VRU ADAS / |
Rate w/o VRU ADAS / |
Rate ratio (95% CI) |
|---|---|---|---|
|
Pedestrian and bicycle collisions, 2nd Gen |
|||
|
All situations in which the car moves forward |
2.33 (1.89, 2.86) |
2.00 (1.41, 2.74) |
1.16 (0.80, 1.70) |
|
SCP |
1.42 (1.07, 1.83) |
1.42 (0.94, 2.07) |
1.00 (0.63, 1.576) |
|
SCP + Longitudinal |
1.54 (1.18, 1.97) |
1.74 (1.19, 2.44) |
0.88 (0.58, 1.35) |
The car-to-pedestrians/bicycles crash rate for all collisions where the car was moving forward increased by about 16% (non-significant) for cars with the system (RR = 1.16, 95% CI: 0.80–1.70), see Table 4. For SCP situations, the crash rates for cars with and without the system were quite similar (RR = 1.00, 95% CI: 0.63–1.58). Finally, SCP + Longitudinal situations show a (non-significant) decrease of 12% (RR = 0.88, 95% CI: 0.58–1.35) for cars with the system.
Car-to-pedestrian collisions
In the 1st and 2nd Gen of car-to-pedestrian collisions, there were 43 cars with VRU ADAS and 49 cars without, collected during the accident years 2015–2020. These cases included car models for which pedestrian detection was available for VRU ADAS. The exposures with VRU ADAS and without were 567 006 and 681 112 IVYs respectively (see Table 2).
The car-to-pedestrian crash rate was slightly (non-significantly) higher for cars with the system (RR = 1.05, 95% CI: 0.70–1.59), see Table 5. Regarding the subset with SCP situations, a crash reduction (non-significant) of 16% was estimated (RR = 0.84, 95% CI: 0.50–1.43) for cars with the VRU ADAS. The subset with SCP + Longitudinal situations showed an 11% (non-significant) lower crash rate (RR=0.89, 95% CI: 0.55–1.44) for cars with the system.
|
Sample of crashes |
Rate VRU ADAS / |
Rate w/o VRU ADAS / |
Rate ratio (95% CI) |
|---|---|---|---|
|
Pedestrian collisions, 1st and 2nd Gen |
|||
|
All situations in which the car moves forward |
0.76 (0.55, 1.02) |
0.72 (0.53, 0.95) |
1,05 (0.70, 1.59) |
|
SCP |
0.42 (0.27, 0.63) |
0.5 (0.35, 0.70) |
0.84 (0.50, 1.43) |
|
SCP + Longitudinal |
0.51 (0.34, 0.73) |
0.57 (0.41, 0.78) |
0.89 (0.55, 1.44) |
|
Pedestrian collisions, 2nd Gen |
|||
|
All situations in which the car moves forward |
0.695 (0.46, 1.00) |
0.58 (0.29, 1.03) |
1.20 (0.60, 2.41) |
|
SCP |
0.347 (0.19, 0.58) |
0.42 (0.18, 0.83) |
0.83 (0.35, 1.97) |
|
SCP + Longitudinal |
0.45 (0.26, 0.71) |
0.58 (0.29, 1.03) |
0.77 (0.36, 1.64) |
Crash data for 2nd Gen were investigated to evaluate the latest version of the VRU ADAS. In this data set there were 28 cars with the system with pedestrian detection and 11 cars without, Figure 3. The numbers of IVYs for cars with the system and without were 402 770 and 190 178, respectively (see Table 2).
The car-to-pedestrian crash rate for all collisions in which the car was moving forward showed an increase of 20% (non-significant) for cars with the system (RR = 1.20, 95% CI: 0.60–2.41). SCP crash situations considered alone were reduced (non-significantly) by 17% (RR = 0.83, 95% CI: 0.35–1.97) for cars with the VRU ADAS. Finally, when SCP + Longitudinal situations were bundled, the results showed a (non-significant) decrease of 23% (RR = 0.77, 95% CI: 0.36–1.64) for cars with the system.
Car-to-cyclist collisions
In the 1st and 2nd Gen of car-to-bicycle collisions, there were 96 cars with VRU ADAS and 89 cars without, collected during the accident years 2015–2020 (after the introduction of cyclist detection in the VRU ADAS). The exposures with VRU ADAS and without were 552 188 and 581 560 IVYs respectively (see Table 2).
The car-to-bicycle crash rate was higher, but not significantly, for cars with the system (RR = 1.14, 95% CI: 0.85–1.52), see Table 6. A higher (non-significant) rate was also found for SCP situations (RR = 1.21, 95% CI: 0.84–1.75) and combined SCP + Longitudinal situations (RR = 1.196, 95% CI: 0.84–1.70) for cars with the VRU ADAS system.
|
Sample of crashes |
Rate VRU ADAS / |
Rate w/o VRU ADAS / |
Rate ratio (95% CI) |
|---|---|---|---|
|
Bicycle collisions, 1st and 2nd Gen |
|||
|
All situations in which the car moves forward |
1.74 (1.41, 2.12) |
1.53 (1.23, 1.88) |
1.136 (0.85, 1.52) |
|
SCP |
1.1 (0.84, 1.42) |
0.91 (0.68, 1.19) |
1.21 (0.84, 1.75) |
|
SCP + Longitudinal |
1.52 (1.21, 1.88) |
1.39 (1.11, 1.73) |
1.196 (0.84, 1.70) |
|
Bicycle collisions, 2nd Gen |
|||
|
All situations in which the car moves forward |
1.64 (1.27, 2.08) |
1.42 (0.94, 2.07) |
1.15 (0.74, 1.81) |
|
SCP |
1.07 (0.77, 1.44) |
1.00 (0.60, 1.56) |
1.07 (0.62, 1.83 |
|
SCP + Longitudinal |
1.09 (0.79, 1.47) |
1.16 (0.72, 1.75) |
0.94 (0.57, 1.58) |
In the crash data including 2nd Gen there were 66 cars with VRU ADAS with bicycle detection and 27 cars without (see Figure 3). The numbers of IVYs for cars with and without VRU ADAS were 402 770 and 190 178 respectively (see Table 2).
The car-to-cyclist crash rate for all collisions with the car moving forward shows a rate about 15% higher (non-significant) for cars with the system (RR = 1.15, 95% CI: 0.74–1.81), see Table 6. For SCP situations the crash rate was quite similar for cars with and without the system (RR = 1.07, 95% CI: 0.62–1.83). Finally, SCP + Longitudinal situations bundled together show a (non-significant) 6% lower rate (RR = 0.94, 95% CI: 0.57–1.58) for cars with the system.
Discussion
The burden of killed and injured vulnerable road users is a significant problem worldwide, and effective measures need to be promoted. This study estimates a non-significant trend of 12% fewer car-to-pedestrian/cyclist crashes in SCP + Longitudinal situations for cars equipped with the second generation VRU ADAS compared to cars without the system. If the estimates were applied to the projected number of approximately 290 SCP + Longitudinal situations per year in officially reported car-to-VRU crashes with recent car models in Sweden, roughly 35 of these crashes could have been prevented each year.
In a previous retrospective study of the first generation of VRU ADAS in Volvo cars in Sweden (Isaksson-Hellman & Lindman, 2019), a clear trend, though not significant, of a decreasing crash rate was found for car-to-pedestrian crashes. In the present study, more data were collected and car models with the second generation of VRU ADAS, which includes updated cyclist detection, were included in the evaluation.
Nevertheless, no significant results were found. Car-to-pedestrian and car-to-bicycle crashes are relatively rare; the crash rates are approximately one per 100 000 vehicle years and two per 100 000 vehicle years, respectively. In Sweden, the vehicle population is small and traffic safety standards high. As a result, collecting crash data for statistical conclusions about crash reduction for specific traffic situations takes time. However, insurance data is an important complement to the official data. It should be emphasized that even if insurance data covers both minor and severe to fatal crashes, the major part are minor, and the effectiveness of the system is considered based on that.
Indications about these systems' performance, as presented in this report, are highly important for the continuous improvement of traffic safety. Further examination of the effect of the system revealed differences in its performance for car-to-pedestrian and car-to-bicycle crashes in different system generations as discussed below.
Car-to-pedestrian
A clear trend of fewer car-to-pedestrian crashes was found when the system was evaluated based on data including SCP + Longitudinal situations. The crash-reducing effect for pedestrians was more pronounced for the second generation of VRU ADAS, which was suggested to be better at, for example, detecting pedestrians in darkness. Both SCP + Longitudinal situations were represented in the EuroNCAP AEB VRU test protocols (EuroNCAP, 2015; EuroNCAP, 2017), suggesting that they represent a significant majority of car-to-VRU crashes and should therefore be prioritized for ADAS system development efforts. The positive trend in effectiveness found in the present study was expected for these situations and represents an important, albeit initial, step, in improving VRU ADAS.
Crash situations in the baseline data from insurance claims, which include all car-to- pedestrian crashes in which the car was moving forward, might include other situations unlike the SCP and Longitudinal situations. The lack of effect in our results may be due to the great variety in pedestrian and vehicle speeds and movement patterns. For example, according to insurance data, almost 20% of all car-to-pedestrian crashes in Sweden occur in a parking lot (Isaksson-Hellman, 2011). The lack of effect may be due to that in these situations, a great variety of pedestrian and vehicle speeds and movement patterns are present that challenge the VRU ADAS with odd situations. Also, the surroundings with dense environment and parked cars in a few of the crashes that were analyzed could influence the performance. This example reflects some of the complexity in real-world driving that VRU ADAS must address.
Car-to-bicycle
Car-to-bicycle VRU ADAS was introduced in Volvo car models in 2013 (Volvo, 2013) , with the original intention of avoiding longitudinal same-direction car-to-bicycle crashes. The operational scope of the second generation of VRU ADAS also covers SCP situations—a great improvement, since crossing situations are the most common car-to- bicycle crashes (Fredriksson et al., 2014; Isaksson-Hellman, 2012; Klug et al., 2018; Van_Der_Zweep et al., 2014). When evaluating the system in car-to-bicycle SCP + Longitudinal situations, a trend of slightly lower crash rates was found for cars with VRU ADAS, but the trend was not as pronounced as in car-to-pedestrian crashes. This small difference may be due to the nature of car-to-bicycle crashes: cyclists have a larger variety of speed and movement profiles. Typical consequences of these speed variations are, first, that the cyclist may hit the car in crossing situations, rather than always the other way around (Isaksson-Hellman & Werneke, 2017; Lindman et al., 2015) and second, there is less time for ADAS to detect the cyclist in critical situations, especially when the view is obstructed (by shrubbery or signage, for example).
Second generation VRU ADAS
A limitation of this study, especially when selecting data for the analysis of the second-generation system, is the low number of crashes. No results were significant, and only indications of the system’s benefits were found. Just a few more cases in the samples of cars with or without ADAS could alter the results, demonstrating the low statistical power of so few crashes. The exposure data metric used for the present study may also be improved in the future, and results might change using a more appropriate measurement of exposure, as for example vehicle kilometers driven.
Another limitation which might mitigate the effects of the new ADAS is the change in driver population over time, when ADAS is no longer an optional feature that must be selected by the driver when buying the car. When ADAS is a standard feature, even drivers who are not particularly concerned about safety (who would not have opted for the system) have the ADAS VRU. While it is necessary to wait for significant results, a comparison of standard and optionally mounted ADAS should be considered for future effectiveness estimations.
The ADAS system cannot address all crash situations—but are drivers (and VRUs) aware of this? In a study examining how to secure drivers' supervisory engagement and conflict intervention performance while they are using automated vehicles, neither reminders about system limitations nor instructions prevented drivers from crashing even when they had their eyes on the conflict object (Victor et al., 2018). Critically, VRU ADAS is a support system only; drivers are always required to be in control of the driving situation. High expectations about the system may continue to have negative repercussions.
Comparison to previous research
The overall result from the present study shows reasonably similar outcomes as previous results on crash avoidance effectiveness for cars with VRU ADAS. The single study including vehicle-to-non-motorist police-reported crashes in the US found a non-significant reduction in crashes of 4% (PARTS, 2022) for a pedestrian ADAS. That result is in line with the results in the present study. Apart from differences in data collection procedures, the US study targeted various kinds of unprotected crash opponents (93% involved a pedestrian), while the present study only covers pedestrians and cyclists. Future studies of VRU ADAS effectiveness would ideally include the growing variety of VRU types, e.g. e-scooters.
Most retrospective studies based on US police-reported data which assess system effectiveness for car-to-pedestrian crashes report significant reductions of 14%–27% (Cicchino, 2022; Leslie et al., 2021; Leslie et al., 2022; PARTS, 2022; Spicer et al., 2021). No such results were found in the Swedish sample analyzed in the present study, perhaps because police-reported data cover different sampling criteria, such as crashes that occur on a trafficway (NHTSA, 2022) rather than the criteria used for this study. The different criteria could affect the crash rate for the situations (SCP + Longitudinal) for which VRU ADAS systems have been optimized.
Other reasons for the different results could be that some conditions (like driving culture, road, and/or lighting) that affected the VRU ADAS performance are different in the US and Sweden. Further research is needed to establish effectiveness results that are generalizable to different cultures and geographical areas.
A retrospective analysis of different generations of ADAS from one specific car maker based on US insurance claims found reductions of 34% for the first generation compared to 41% for the second generation for car-to-pedestrian crashes (Wakeman et al., 2019). These findings demonstrate an improvement in performance when the technology evolves, which is consistent with the findings of enhanced effectiveness in the second generation in the present study. Also, results on different models within the same car brand, and the results indicate that specific car models may be important to consider in future analyses.
No other retrospective study presented results for specific car-to-pedestrian situations, but some of the prospective studies did quantify the effectiveness for SCP, often reporting more than a 50% crash reduction for cars with VRU ADAS. The opportunity that virtual simulations offer, when it comes to analyzing specific situations (such as SCP) is an advantage over retrospective studies, which need lots of time to collect detailed information from enough crashes in specific situations. On the other hand, all assumptions in prospective studies introduce uncertainties which need to be validated by retrospective estimates. The present study estimates SCP car-to-pedestrian crash reduction to be a nonsignificant 16–17%, far from the optimistic numbers found in the prospective studies.
Most of the reviewed effectiveness estimations for VRU ADAS are prospective studies. For timely, situation-specific performance evaluations, the combination of real-world traffic data and virtual simulations seems promising. Making prospective estimates trustworthy involves ensuring that they are transparent and comparable to other effectiveness estimations.
Unfortunately, virtual simulation setup and validity and baseline approaches are seldom described clearly. Input data and their generalizability to larger populations are not always described in a way that makes it possible to interpret the results in a real-world traffic context. The fact that most of the prospective analyses evaluate fictive VRU ADAS, without reference to production systems that can be assessed in real-world traffic, also contributes to some confusion about result generalizability. When prospective methods have been validated and show results comparable to retrospective methods, they will be a most useful tool for authorities, insurance companies, and car manufacturers for promoting effective VRU crash intervention strategies.
For both retrospective and prospective evaluations, a common challenge is the dearth of precise crash data with details on traffic situations, and crash data sets that are representative of specific vehicle models in various geographical locations.
The results in this study do not promise VRU ADAS will prevent car-to-pedestrian/bicycle crashes entirely within the next few years. Solving the problem of car-to-VRU crashes might require other strategies, such as separating vehicles and VRUs, making VRUs easier to detect, and reducing speeds in places with frequent vehicle and VRU interactions. Although positive effectiveness trends for SCP and Longitudinal situations were found, vehicle systems will need to address all kinds of other crash-critical situations that arise in real-world traffic (such as cars turning and reversing). New and improved sensing technology that has been presented for future vehicles (Volvo, 2022) promises to further reduce car-to-VRU crashes.
Conclusion
Insurance claims data from Sweden reveal that cars with the second generation of VRU ADAS have 12% (non-significant) fewer car-to-pedestrian/cyclist crashes in SCP + Longitudinal situations than cars without the system. For car-to-pedestrian crashes, the crash rate was estimated to be reduced by 23%, while car-to-bicycle crashes were reduced by 6% for the second generation of VRU ADAS in SCP + Longitudinal situations. To mitigate the car-to-VRU crash problem in the near future (before effective ADAS and safe vehicle automation are in place), other efforts are needed as a complement.
Previous research has employed various methods and tools to estimate the crash- and/or injury-reducing effect of various VRU ADAS in real-world traffic. However, few results have been presented from studies that control for factors that may affect the results, e.g. makes and models, geographical areas and cultures, conflict situations that the systems were designed for, VRU types and driver styles.
Funding
This research is a natural part of the ongoing work at If P&C Insurance and it was supported by the internal funds of the company.
Declaration of competing interests
The authors report no competing interests.
CRediT contribution statement
Irene Isaksson Hellman: Conceptualization, Data curation, Formal analysis, Validation, Writing—original draft, Writing—review & editing.
Magdalena Lindman: Conceptualization, Investigation, Validation, Writing—original draft, Writing—review & editing.