Innovation and long-term planning in public policy: the case of national road safety plans in Norway
Handling editor: Stijn Daniels, Transport & Mobility Leuven, Belgium, KU Leuven, Belgium
Reviewers: Shalom Hakkert, Technion, Israel
Apostolos Ziakopoulos, National Technical University of Athens, Greece
Rob Methorst, Ministry of Infrastructure & Water Management, Rijkswaterstaat (retired), Netherlands
Received: 12 March 2023; Accepted: 29 May 2023; Published: 16 June 2023
Abstract
Vision Zero was adopted as the long-term ideal for transport safety in Norway in 2001. Starting in 2002, national road safety action plans covering a period of four years have been developed. This paper identifies innovative elements in these plans and explores the statistical relationship between innovation and the number of killed or seriously injured road users over time. A statistical relationship is found, but it is noisy and cannot be interpreted as a causal relationship. We show how road safety policy has become upgraded and more systematic over time, and that these developments co-exist with a gradual reduction in number of severe injuries and deaths. Important innovative elements are related to the process of policy development, which now ensures a much broader mobilisation, consensus and commitment to improving road safety than before the action plans were introduced (i.e. before 2002).
Keywords
commitment, innovation, road safety policy, stakeholder involvement, Vision Zero
Introduction
Background
Vision Zero was officially adopted as the long-term objective for transport safety in Norway in 2001. Vision Zero states that the ideal for transport safety is that nobody is killed or permanently injured as a result of a transport accident. In Norway, Vision Zero applies to all modes of transport. It has the support of all political parties and has been the basis of transport safety policy since its adoption.
The key document of national transport policy in Norway is the National Transport Plan (NTP), which is presented as a White Paper (report to the Storting) every fourth year. The NTP originally covered a period of 10 years, but in the two most recent plans, the period has been extended to 12 years. The plan is rather detailed for the first half of the period, less so for the second half. The National Transport Plan is primarily an investment plan for transport infrastructure. It does, however, discuss the use of other policy instruments than infrastructure investments. For road safety, a supplementary plan is developed and presented one year after the National Transport Plan. The road safety plan is referred to as the Action Plan for road safety. It includes road safety only and does not cover other modes of transport. The plan contains specific goals for reducing the number of fatalities and serious injuries related to road traffic for each period, and details specific traffic safety measures within defined focus areas that represent salient challenges (e.g. speed, vulnerable road users, traffic safety for children).
The first National Transport Plan was presented in 2000 and covered the period 2002–2011. The first Action Plan for road safety was presented in 2002 and covered the same period as the NTP. It included a detailed list of road safety measures to be implemented during the first four years of the period (2002–2005). New Action Plans for road safety have been developed every four years. The most recent plan, which is the sixth Action Plan for road safety, was published in 2022.
What kind of innovations have been introduced in the successive road safety Action Plans? Are recent plans more comprehensive and innovative than the first plans? These are two of the questions this paper will discuss. The focus is on the key elements in the successive Action Plans for road safety. The Action Plans are viewed as safety management systems aiming to produce continuous improvement, in line with the Plan-Do-Check-Adjust (PDCA) cycle, see Figure 1 (ISO, 2018).
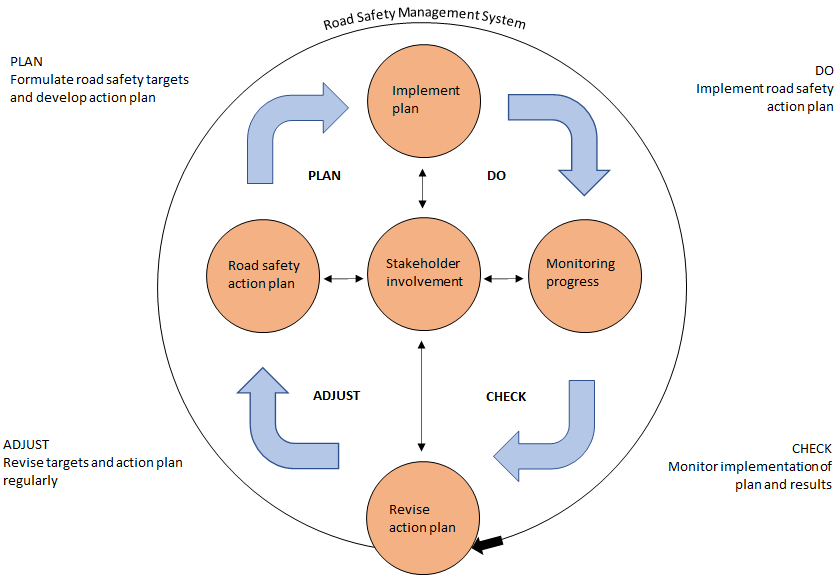
This means that we focus on the particular elements in the plans: Plan (e.g. road safety goals, analysis of problems), Do (e.g. road safety measures), Check (e.g. performance indicators) and Adjust (e.g. adaptation, regular revision of targets and action plan). We also focus on stakeholder involvement in the plans and the division of responsibilities for implementation of measures among the stakeholders. Anchored in previous research on the PDCA approach (Nævestad et al., 2020) and the impacts from Vision Zero (Elvik, 2022), we have identified six key aspects for analysis: targets, problem analysis, performance indicators, road safety measures, stakeholder involvement and definition of responsibilities.
A key focus in the paper is how the quality of the plans has developed over time with respect to these elements, and whether innovative elements have been included in the plans over time. Fagerberg & Mowery (2006) refer to innovation as an idea for a new product or a process that has been implemented in a particular context. An indication of the effectiveness of the plans is found if there is a relationship between the introduction of innovative elements in the plans and improvements in road safety.
Aims
The main aims of this paper are:
-
To identify innovative elements in the successive Action Plans for road safety and examine whether these elements have changed over time related to the six key aspects of the plans.
-
To develop a checklist to rate elements in the road safety plans, focusing on the six key aspects, and to compare the level of quality and innovation in the plans over time.
-
To examine whether it is possible to establish a statistical relationship between the elements of the Action Plans for road safety and changes in the number of killed or seriously injured road users.
-
To examine how these policy developments can be conceptualised in terms of innovation.
Theoretical framework
Previous studies of road safety policy innovations
During the past 25–30 years, a number of countries have adopted new approaches to road safety that can reasonably be viewed as road safety policy innovations. The Netherlands introduced Sustainable Safety as the basis for road safety policy in 1998. Weijermars & Schagen (2009) identified factors contributing to reducing fatalities in the Netherlands from 1998 to 2007. They concluded that infrastructure improvements made an important contribution. No attempt was made to determine whether the annual rate of decline in the number of traffic fatalities was larger after the adoption of Sustainable Safety than before.
Belin (2022) describes the introduction of Vision Zero in Sweden and the development of road safety after its introduction. In an earlier paper, Belin et al. (2012) argued that Vision Zero was a radical road safety policy innovation. No quantitative analysis is reported, but the political discussion surrounding Vision Zero is described. It is shown that Vision Zero ultimately became firmly established as the foundation for road safety policy in Sweden, surviving changes in government and other events that might have been used as an excuse for abandoning it. Following a period of about 10 years, Vision Zero led to changes in speed limits in Sweden (Vadeby & Forsman, 2018) and an extensive use of speed cameras (Belin & Vadeby, 2022).
Safety management system and continuous improvement
We define organisational safety management as the combination of informal and formal organisational measures to achieve safety in organisations. We refer to the formal organisational measures as safety management system, and the informal as safety culture (Antonsen, 2009; Haukelid, 2008).
The formal aspects of organisational safety management, safety structure, are generally referred to as ‘safety management system (SMS)’. SMS is defined in a number of different ways in the research literature. SMS often consists of formal routines and measures that enable the organisation to work systematically with safety through continuous improvement, which involves mapping and analysis of risks and measures designed to reduce risks. The principles in SMS are often in line with a continuous improvement approach and process. In English, this is often referred to as ‘Plan, Do, Check, Adjust’. The four elements of the continuous improvement process are:
-
Plan. Define policy, including objectives, action plan, required resources, and indicators of implementation and effects.
-
Do. Implement the plan to achieve policy objectives.
-
Check. Review indicators of implementation and effects.
-
Adjust. Adjust measures if necessary, to achieve the objectives. Regularly revise action plans.
This process means that the organisation analyses the problems the plan is intended to solve, develops relevant measures, develops indicators, sets a target for improving these, establishes a plan for how it is to be done, monitors the key figures to examine effects and corrects the measures if necessary, to achieve the targets.
Other key elements in SMS and PDCA process of continuous improvement are related to the role descriptions of involved stakeholders and their responsibilities (Thomas, 2012). There should ideally speaking be clear definitions of the roles and responsibilities of the parties involved in the PDCA process (Prashar, 2017).
Policy, innovation and continuous improvement
Over the last few decades, innovation in the public sector has gained increasing interest (Bloch & Bugge, 2013; Windrum, 2008). Public sector innovation can take many forms, and may include activities related to, e.g. policy making, administration, public service, production, public procurement, and regulations (regulatory simplification) (Grünfeld et al., 2016). Based on an adaptation of the definition of innovation in the private sector, Bloch (2011) defines public sector innovation as:
‘...implementation of significant changes in the way the organization works, or in the products/services it delivers, and includes both completely new or significantly changed services/goods, work processes, organizational methods and the way the organization communicates with its users. The innovation must be new to the organisation but may have been developed by others’.
Traditionally, the role of public policy in relation to innovation has been to facilitate innovation (Fagerberg, 2017). Typical examples include public policies that incentivise firms to invest in research and development, or policies that facilitate collaboration and learning (Chaminade & Esquist, 2010). An example related to road safety is the creation of the European New Car Assessment Programme (Euro NCAP). Publication of how cars score in this programme has stimulated technological innovation among car manufacturers. However, there is increasing recognition that public policies can represent innovation by themselves. Public policies can be understood as actions by a government or the state (Hill & Varone, 2021) and typically include rules, laws, instruments and regulations, but also goals and strategies. Policy innovation, then, may refer to changes in, for example, policy instruments or changes in the way policy is created (Windrum, 2008).
A distinction can be made between incremental and radical innovations. Whereas radical innovation represents something entirely new, incremental innovation represents smaller changes to or adaptations of existing technologies or processes without changing their core characteristics (Smith, 2009). If we translate this to policy innovation, incremental policy innovation would, for instance, be to alter existing policies and instruments, without adding or removing key components of such policies. Even though radical innovation may receive the more attention, incremental innovation is by far the more common form of innovation. Most improvements, whether it is in technology or in other domains, thus originate from incremental innovation (Hanson, 2013).
Elements in road safety plans
In the present study, we focus on six key elements when analysing road safety plans. The identification of these elements is based on previous research focusing on the PDCA approach to continuous improvement (Nævestad et al., 2020), and previous research on possible impacts of Vision Zero on road safety policy in Norway (Elvik, 2022):
-
Setting targets. Establishing policy objectives is crucial for the PDCA process of continuous improvement (Prashar, 2017). Quantified targets for reducing the number of killed or injured road users have been found to improve road safety performance (Allsop et al., 2011; Elvik, 1993; Elvik, 2001). Ambitious targets, i.e. targets aiming for a large annual percentage reduction of the number of killed or injured road users, are more effective than less ambitious targets. A long-term target is more likely to be successful than a short-term target (Sze et al., 2014).
-
Problem analysis is an important part of the ‘plan’ aspect of the PDCA process (Prashar, 2017). The analysis of road safety problems should be linked to plans for implementing road safety measures that may reduce the problems. The analysis of road safety problems is innovative if it is responsive to the dynamic character of such problems. This implies that: (a) The set of problems analysed changes as problems become smaller or larger, (b) The analysis of each problem becomes more detailed, (c) A connection is made between problems and proposed road safety measures, and (d) Improvements are sought in the data serving as the basis for analysing problems. Innovations related to the analysis of road safety problems may relate to all these points.
-
Road safety measures relate to the ‘Do’ aspect in the PDCA cycle. The use of road safety measures is effective if the use of measures known to be effective is increased and/or the use of measures not known to be effective is reduced and if the effects of new measures are evaluated. The use of road safety measures should be evidence-based. This includes extending and updating the evidence base by conducting evaluation studies. An evidence-based road safety plan should ideally include only measures for which there is evidence that they improve road safety.
-
Safety performance indicators relate to the ‘Check’ aspect in the PDCA cycle. Indicators are crucial for the PDCS process of continuous improvement, to check the overall progress towards the target, whether measures have the intended effects, or should be modified (Prashar, 2017). Safety performance indicators are important, as changes in them may give early indications of changes in the number of killed or injured road users. Safety performance indicators measure changes in risk factors that are causally related to the number of accidents or injured road users. For each performance indicator, a target for its improvement over time should be set.
-
Stakeholder involvement. There are many road safety measures. No single public or private organisation is in charge of all of them. The power to implement road safety measures is divided between the private and public sector and between different levels and sectors of government. A stakeholder can be defined as any actor, private or public, who has the possibility of influencing road safety by implementing one or more road safety measures. A successful road safety plan requires co-ordination between all stakeholders (Elvik, 1979). The involvement of stakeholders is effective if it is extended to include more stakeholders and the measures proposed by the stakeholders are included among those that are followed up formally (Kimiagari et al., 2013).
-
Responsibilities. The responsibility of each stakeholder must be clearly defined. However, a formal responsibility may be ineffective unless commitment to it is ensured. There are two ways of making a commitment to a responsibility. The first is to make it as concrete as possible. As an example, the formulation ‘the police will do enforcement’ does not commit the police to very much. On the other hand, a target of, for example, checking 2 million drivers is a specific commitment. You can determine if it was done or not. The second way to make a commitment binding is to announce it publicly and thereby invest prestige in the failure to carry it out. Based on this, we may assume that the division of responsibilities is effective if no measure is proposed without assigning a responsible agent for implementing it, and if responsibilities are defined in a sufficiently binding way to be able to determine if they have been exercised or not (Elvebakk et al., 2016). Thus, divided responsibilities with unclear roles should be avoided.
Methods
Analysis of road safety plans
Qualitative and quantitative content analysis (Nowell et al., 2017) was used to analyse the road safety plans. The following six questions guided analyses of road safety plans:
-
Does the plan include a target, preferably quantified, for reducing the number of killed or injured road users?
-
Does the plan include a set of safety performance indicators measuring risk factors for accidents and intended as a basis for monitoring short-term progress towards fewer killed or seriously injured road users?
-
Does the plan include an analysis of road safety problems and changes over time in these problems?
-
Does the plan include a set of road safety measures designed to realise targets for the safety performance indicators and the number of killed or seriously injured road users?
-
Which stakeholders and how many stakeholders are involved and committed with the plan?
-
Does the plan include clearly assigned responsibility for implementing the road safety measures?
The contents of each plan were coded according to whether they include any of the six aspects. We compared the content in the plans related to each of the specific themes. We did this by systematically comparing the descriptions and words from each plan, focusing on the extent to which the descriptions related to each theme were different or similar. Additionally, the plans were slightly altered over time on each aspect, gradually increasing ambitions, stakeholders, etc. This required a focus on the unique character of each plan, related to sub-aspects of the six key aspects.
We have also conducted quantitative content analysis of the plans. Reviewing some of the aspects of the plans, we counted the factors involved. This applies e.g. to the number of stakeholders involved in the implementation of the plans and the number of road safety measures in the different plans. Additionally, we calculated the presence of divided responsibility in the plans. This was coded as a value between 0 and 1. In the 2002–2005 plan, for instance there was unique responsibility for 86 measures and divided responsibility for 9 (out of 95). This gives a score of 86 / 95 = 0.9.
Checklist to rate the quality of the road safety plans
To enable a systematic comparison of the Action plans, we made a checklist for the different elements in the plans. The checklist is based on previous research and the content analysis of plans. The checklist focuses on the six above mentioned aspects of road safety plans and includes sub-aspects that were identified in the qualitative analysis of the road safety plans.
|
Main aspect |
Sub-aspects |
|---|---|
|
Targets |
A quantified target is proposed (when none existed before). |
|
A quantified target is revised to become more ambitious. |
|
|
The time perspective of a quantified target is extended. |
|
|
The target is broken down into sub-targets. |
|
|
Safety performance indicators |
The indicators include what is known to be major risk factors. |
|
Quantified targets are set for performance. |
|
|
Quantified performance targets are revised based on performance, preferably to become more ambitious. |
|
|
The set of performance indicators is changed based on changes in importance or actual performance. |
|
|
Analysis of problems |
The set of problems analysed includes those that make the largest contribution to traffic injury. |
|
The analysis of problems becomes more detailed in successive plans. |
|
|
The road safety measures proposed are integrated with the problems that are analysed. |
|
|
Methods for improving the quality of data to support road safety analyses are proposed. |
|
|
Road safety measures |
New measures, not previously used, are introduced. |
|
The effects of new measures are evaluated. |
|
|
Only measures known to be effective or potentially effective are used. |
|
|
The use of ineffective measures is discontinued. |
|
|
Stakeholder involvement |
A broader range of stakeholders are involved in developing the plans. |
|
The commitment of all stakeholders to implementing the measures they are responsible for is strengthened. |
|
|
Division of responsibilities |
For each measure, an agent responsible for implementing has been assigned. |
|
There is a clear description of the actions that must be taken to fulfil responsibilities. |
|
|
Dividing responsibilities between several stakeholders is avoided. |
|
|
All stakeholders commit themselves publicly to implementing the measures they are in charge of. |
When using the checklist (see Table 1), items were coded 1 if present and 0 if absent. Some items were coded differently. Safety performance indicators are counted by main category. The checklist facilitates a consistent comparison of the road safety action plans in term of the same criteria and scoring system throughout the entire study period, and enables us to study qualitatively and quantitatively the relationship between the quality of the plans and the road safety level in Norway. The terms quality and innovation are used interchangeably in the paper.
Classification of road safety measures in the plans
The road safety measures in the action plans for road safety include several different types of road safety measures, for example, addressing risk factors related to drivers, vehicles, road and road environment, focusing on education, enforcement and engineering. To classify the measures with respect to effectiveness, we rely on the Handbook of Road Safety (Elvik et al., 2009). We have classified the road safety measures in the plans into the following groups with respect to their effectiveness:
-
Measures that, based on evaluation studies, are known to reduce the number of killed or seriously injured road users.
-
Measures that can reasonably be presumed to reduce the number of killed or seriously injured road users, based on general knowledge or the influence of the measures on risk factors for fatal or serious injury.
-
Measures whose effects on the number of killed or seriously injured road users are unknown.
-
Measures that, based on evaluation studies, are known not to reduce, or even increase, the number of killed or seriously injured road users.
These four groups are referred to as effective measures (group 1), potentially effective measures (group 2), unknown effectiveness (group 3) and adverse effects (group 4).
Results
Analysis of road safety plans
This section addresses the first aim of the study, which is to examine whether innovative elements have been included over time related to the six key aspects of the plans.
The plan for 2002–2005
The first Action plan for road safety covered the term 2002–2011, but the measures proposed were intended to be implemented during the first four years, 2002–2005.
The plan itself was an innovation. It was the first of its kind. However, it did not contain all the elements of the plan-do-check-act model shown in Figure 1. In particular, it did not include a quantified target for reducing the number of killed or seriously injured road users. At the time the Action plan was developed, there was no political support for a quantified target for reducing the number of killed or seriously injured road users in Norway. The plan therefore only stated that: ‘Vision Zero embodies an ambition to continuously and markedly reduce the number of killed or seriously injured road users.’
The plan contained a chapter devoted to the development of accidents over time and the current distribution of accidents between types of accident and groups of road users. However, this description was not integrated with the measures proposed in the plan. It was cast in general terms and not applied to identify targets for intervention by means of road safety measures.
A set of safety performance indicators was proposed. For each performance indicator, a target for 2011 was proposed. The indicators included: speed, impaired driving (i.e. influenced by alcohol or drugs), seat belts, bicycle helmets, pedestrian reflective devices, safety features of heavy goods vehicles, length of roads classified as hazardous, and reduction of the number of killed or seriously injured road users aged 17–25. It was stated that if all targets for the safety performance indicators were realized, the annual number of fatalities would be reduced by about 100 and the annual number of seriously injured road users reduced by about 300.
The most recently available four-year average for the number of fatalities at the time the plan was presented was 317.8 for the 1998–2001 period. The four-year average for 2008–2011 (2011 was the target year) was 210.8 fatalities, indicating that the estimated reduction had been realised.
Road safety measures to be implemented were briefly described in the plan. There were 95 measures in total. The Public Roads Administration was assigned responsibility for implementing 71 of the measures. The largest group of measures (38) was measures directed at road users. This group included, for example, driver training and information campaigns.
The plan was signed by the directors of the Norwegian Public Roads Administration, The Norwegian Road Safety Council and the Police Directorate. The level of innovative elements is rated in Table 2. The plan scored 19.9 point according to the scoring system developed.
|
Main element |
Innovative elements |
2002–05 |
2006–09 |
2010–13 |
2014–17 |
2018–21 |
|---|---|---|---|---|---|---|
|
Targets |
Quantitative |
0 |
0 |
1 |
1 |
1 |
|
Ambition increased |
0 |
0 |
0 |
1 |
1 |
|
|
Time horizon extended |
0 |
0 |
0 |
0 |
1 |
|
|
Sub-targets specified |
0 |
0 |
1 |
1 |
1 |
|
|
Safety performance indicators |
Major risk factors |
8 |
10 |
12 |
10 |
13 |
|
Quantified targets |
8 |
10 |
12 |
10 |
13 |
|
|
Ambition increased |
0 |
0 |
1 |
1 |
1 |
|
|
Set modified |
0 |
1 |
1 |
0 |
1 |
|
|
Analysis of problems |
Set modified |
0 |
0 |
0 |
0 |
1 |
|
Greater detail |
0 |
0 |
0 |
0 |
1 |
|
|
Connection to measures |
0 |
0 |
0 |
0 |
1 |
|
|
Data improvement |
0 |
0 |
0 |
0 |
1 |
|
|
Road safety measures |
New introduced |
0 |
1 |
1 |
1 |
1 |
|
Effects evaluated |
0 |
0 |
0 |
0 |
0 |
|
|
Use of effective |
1 |
0 |
0 |
1 |
0 |
|
|
Nonuse of ineffective |
0 |
0 |
0 |
0 |
0 |
|
|
Stakeholder involvement |
Broader |
0 |
2 |
3 |
4 |
4 |
|
Commitment |
0 |
0 |
0 |
0 |
1 |
|
|
Division of responsibilities |
Agent assigned |
1 |
1 |
1 |
1 |
1 |
|
Clear definition |
1 |
0 |
0 |
0 |
0 |
|
|
Divided avoided |
0.9 |
0.7 |
0.9 |
0.9 |
1 |
|
|
Public commitment |
0 |
0 |
0 |
0 |
1 |
|
|
TOTAL |
All items added |
19.9 |
25.7 |
33.9 |
31.9 |
45.0 |
The plan for 2006–2009
The plan for the 2006–2009 term was quite similar to the first Action plan. The main differences were that more safety performance indicators were included (up from 8 to 10) and that far more road safety measures were listed. On the other hand, no estimate of the effects of these measures was included, unlike the first plan. A quantified target for reducing the number of killed or serious injured road users was still not included. There was one more signatory of the plan compared to the first plan. The new signatory was the Directorate of Public Health. The plan was thus innovative by including an additional stakeholder. On the other hand, divided or mixed responsibility for implementing road safety measures applied to 66 of 239 measures, lowering the score for avoiding divided responsibility from 0.9 to 0.7. The overall score for quality increased from 19.9 to 25.7, mainly because two new safety performance indicators were added (see Table 2).
The plan for 2010–2013
The Action plan for the 2010–2013 term was the first to include a quantified target for reducing the number of killed or seriously injured road users. From a baseline number of 1150 killed or seriously injured road users in 2010, the target was to reduce this to 950 by 2014 and 775 by 2020. The annual targeted percentage reduction during 2010–2014 was 4.6%. The annual targeted percentage reduction during 2014–2020 was 3.7%. For the whole period, the annual targeted percentage reduction was 3.9%. Targets for reducing the number of killed or seriously injured young and old drivers were also set.
The number of safety performance indicators with quantified targets was increased from 10 to 12. The targets set for performance also became more ambitious. However, the analysis of road safety problems remained general and was not integrated with the proposed road safety measures. Some new road safety measures were proposed and an evaluation of the effects of section control was announced.
The number of signatories of the plan increased from four to five. The new signatory was the Directorate of Education. Divided responsibilities for the implementation of road safety measures was reduced from 28% to 13% of the measures, increasing the score for divided responsibilities from 0.7 to 0.9. The overall score for the first three action plans shows that they improved in quality, going from a score of 19.9 to 25.7 to 33.9 (see Table 2).
The plan for 2014–2017
The Action plan for the 2014–2017 term contained a revised quantified target for reducing the number of killed or seriously injured road users. From a baseline number of killed or seriously injured road users of 840, a target was set for 2020 of 600 killed or seriously injured road users. A target for 2024 of 500 killed or seriously injured road users was set. These targets were more ambitious than those set in the 2010–2013 plan. For the first six years (2014–2020), the targeted annual reduction of the number of killed or seriously injured road users was 5.5%. For the last four years (2020–2024), the targeted annual reduction was 4.4%. For the whole period of ten years (2014–2024), the targeted annual reduction of the number of killed or seriously injured road users was 5.0%.
The number of safety performance indicators with quantified targets was reduced from 12 to 10. However, for the indicators that were kept, most of the targets became more ambitious. The analysis of road safety problems remained general and was not integrated with the road safety measures proposed. However, unlike the 2010–2013 plan, it contained an estimate of the expected effects of road safety measures.
The number of stakeholders signing the plan increased from five to six. The new signatory was the Association of Municipalities, an organisation representing local governments in Norway. The total score for quality decreased slightly from 33.9 to 31.9 (see Table 2).
The plan for 2018–2021
The Action plan for road safety for the 2018–2021 term contained a revised target for reducing the number of killed or seriously injured road users. The time horizon was extended from 10 years to 12 years. From a baseline of 840 killed or seriously injured road users, an interim target of 500 was set for 2024. This corresponds to an annual percentage reduction of the number of killed or seriously injured road users of 5%. For 2030, a target of 350 killed or seriously injured road users was set. This corresponds to annual decline of 5.8% during the 2024–2030 period. For the whole period, 2018–2030, the targeted annual reduction of the number of killed or seriously injured road users was 5.3%. Sub-targets for each county were set.
The number of safety performance indicators with quantified targets increased to 13. For some of the indicators, the targets were reformulated. In general, the targets became more ambitious.
A general description of road safety problems, including a comparison of Norway with other European countries, was kept in the form presented in previous action plans. In previous plans, the road safety measures were presented separately from the analysis of road safety problems, according to a traditional classification into road-related, vehicle-related and road-user related measures. In the plan for the 2018–2021 term, a list of 16 ‘problem areas’ was presented. The proposed road safety measures were tailor-made to each of these problem areas. In this sense, the analysis of road safety problems and the proposed road safety measures became more integrated than in the earlier plans. The proposed measures were, so to speak, justified by reference to the specific problems they were intended to reduce.
The number of stakeholders signing the plan remained unchanged at six. The signatories were the same as for the 2014–2017 plan. The share of road safety measures with divided responsibility for implementation was now only 4%, leading to a score of 1 for divided responsibilities. The total score for quality for the 2018–2021 Action plan was 45.0, the highest of the plans examined (see Table 2). The Action plan for 2022–2025 will not be examined in this paper, because it is too early to relate it to any road safety outcomes.
Is quality in road safety plans related to increased road safety?
This section addresses the third and fourth aims, which are to examine what happened to road safety policy in Norway after the adoption of Vision Zero, and how these policy developments can be understood as innovations. The statistical relationship between the quality scores assigned to the action plans and the development of road safety will be described.
Measuring road safety performance
An innovative road safety policy ensures, or at least is designed to ensure, continuous improvement in road safety. How can the continuity of progress be measured?
The first full year during which Vision Zero was the basis of road safety policy in Norway was 2002. This was also the first year of the first Action plan for road safety. Figure 2 shows the number of road accident fatalities in Norway from 2002 to 2021.
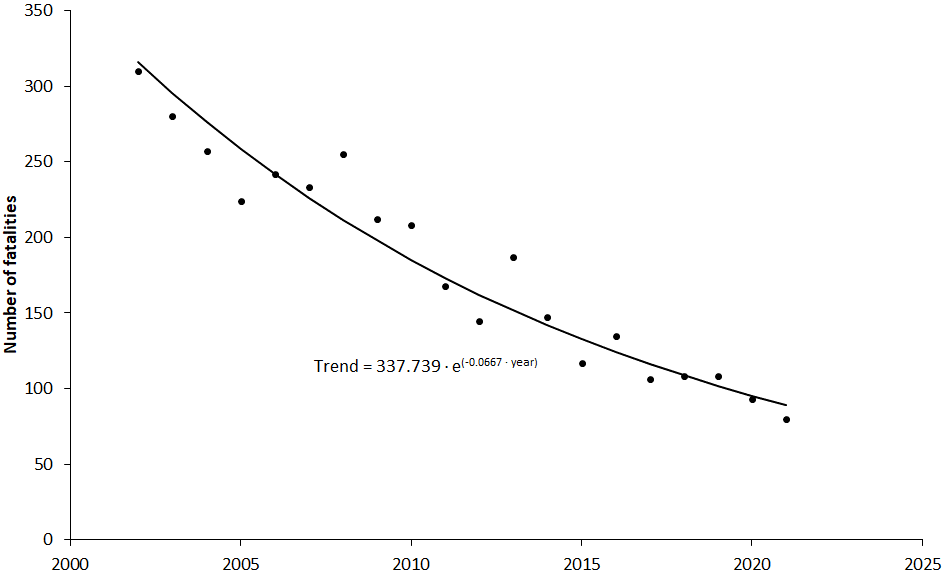
There is a clear long-term trend, with an average annual decline of about 6.7%. The changes from year to year are, however, irregular. There have been years when the number of fatalities increased. How can continuous reduction be defined in view of these irregularities?
Continuous decline will be defined in terms of a moving four-year average number of fatalities. The first four years are the last four-year period before Vision Zero was adopted, 1998–2001. Then, the moving average moves forward one year at a time: 1999–2002, 2000–2003, and so on. The last period is 2018–2021. Each period will be denoted by the middle year of the period. For the first period, that is the average of 1999 and 2000, which is denoted 1999.5. Figure 3 shows the moving four-year average number of fatalities from 1998 to 2021.
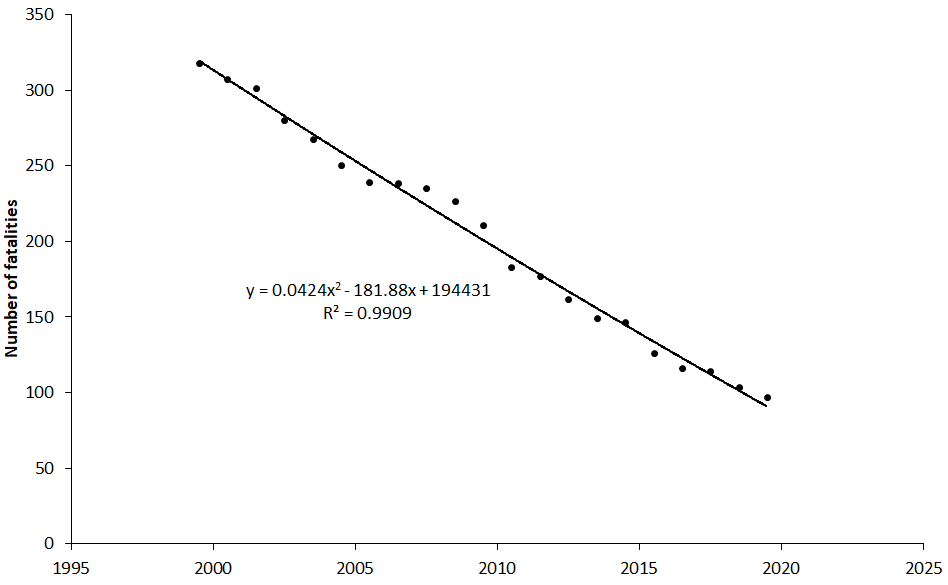
It is seen that there has been a continuous decline in the number of traffic fatalities in this period, although the rate of decline has varied. An objective of the analyses presented later in this paper is to study whether there is any relationship between the rate of decline and the quality of the Action plans for road safety. It may be noted that the number of fatalities in 2020 and 2021 was abnormally low, perhaps in part due to the Covid-19 pandemic.
Analysing the relationship between the quality of the plans and road safety
Is there any relationship between the quality of the action plans for road safety and changes in the number of killed or seriously injured road users? This section will explore this question. It is not possible to perform a rigorous study supporting causal inferences. All that can be done is to study whether there are any statistical associations between variables.
Figure 4 shows moving four-year averages for the number of killed or seriously injured road users, based on data for the years from 1994 to 2021. The first data point is based on the years 1994–1997 and is labelled 1995.5 in the figure. The last data point is based on the years 2018–2021.

Except for the early years of the period, there has been a continuous decline in the number of killed or seriously injured road users. The first four data points from the left refer to the years before the first full year (2002) when Vision Zero was effective in Norway. It is seen that there has been an unbroken decline since the adoption of Vision Zero.
As noted above, previous research has found that setting ambitious quantified road safety targets improves road safety performance. The first two action plans did not contain a quantified target for reducing the number of killed or seriously injured road users. The other plans have contained such targets. Figure 5 compares performance to targets for the years from 2002 to 2021.
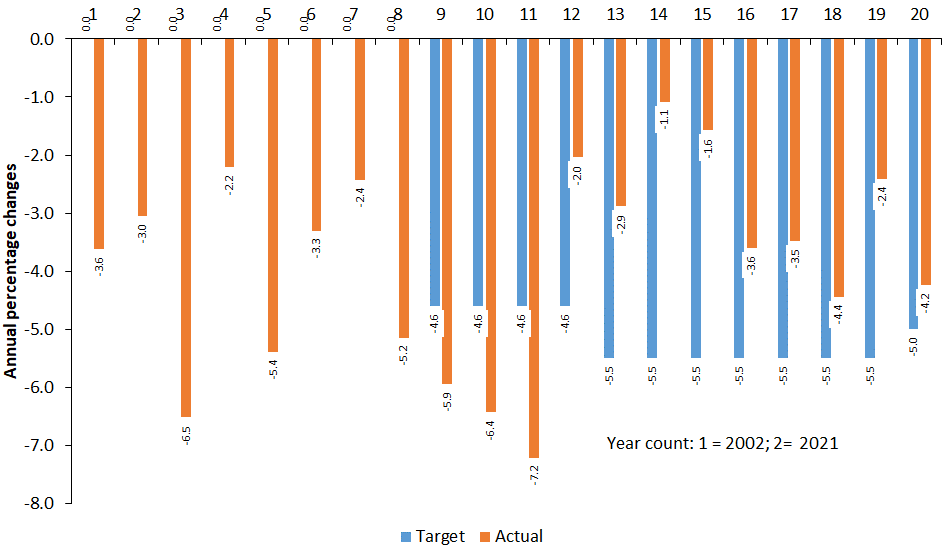
The targeted decline in the number of killed or seriously injured road users was set to 0.0 for the years before a quantified target was adopted. The blue columns show the targeted annual decline in the number of killed or seriously injured road users. These columns take on only three values: -4.6% for the 2010–2013 term (years numbered as 9–12 in Figure 5), the value of -5.5% for the 2014–2020 (years 13–19), and the value of -5.0% for the year 2021 (year 20). The orange columns show the actual decline in the number of killed or seriously injured road users, as averages based on rolling four-year periods. Thus, the rightmost number (-4.2%) is the average annual decline during 2018–2021.
It can be seen that it was only during the first three years after a quantified target became effective that the actual reduction of the number of killed or seriously injured road users exceeded the target. During all other years, the decline has been smaller than the targeted decline. There is a negative correlation between the targeted decline and the actual decline (Pearson’s r = -0.1212), suggesting that more ambitious targets are associated with weaker road safety performance.
A preliminary conclusion is that ambitious road safety targets may not be a sufficient condition for improving road safety. Is the degree to which the action plans increase in scope and quality associated with road safety performance? The quality score is admittedly arbitrary. Yet, it has been applied consistently to all road safety action plans and should therefore be comparable between plans. Figure 6 shows the relationship between road safety plan scope/quality score and mean annual percentage reduction of the number of killed or seriously injured road users.
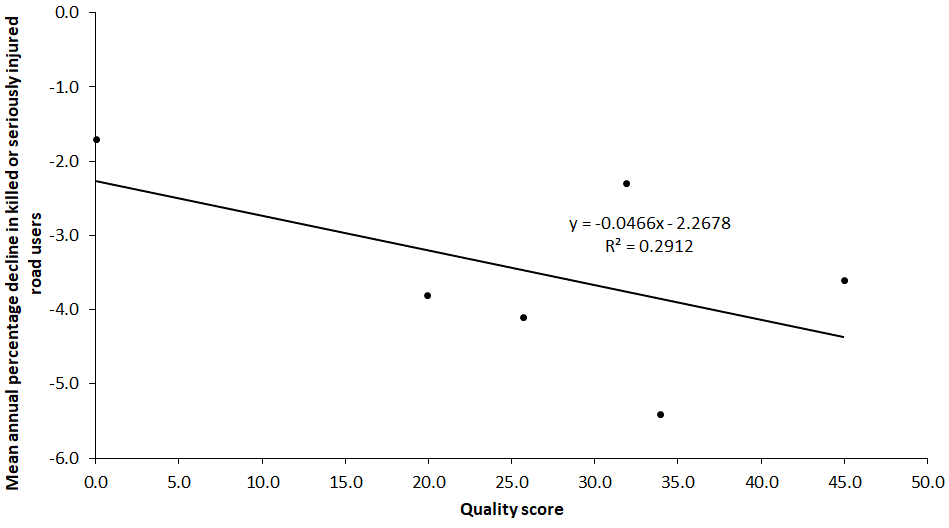
The data point to the left in Figure 6 shows the mean annual decline in the number of killed or seriously injured road users during 1998–2001 compared to 1994–1997, i.e. it shows the mean annual number of killed or seriously injured road users for 1998–2001 divided by the mean number for 1994–1997, and converted to a percentage decline. These periods were both before the adoption of Vision Zero and before the first action plan was presented.
The next data point refers to the first action plan. It scored 19.9 for quality and the decline in the mean annual number of killed or seriously injured road users from 1998–2001 to 2002–2005 was 3.8%, a clear improvement from the period before Vision Zero and action plans.
The successive action plans have scored from 25.7 to 45.0 for quality. There is a tendency, although noisy, for the plans with a higher quality score to be associated with a larger reduction of the number of killed or seriously injured road users than plans scoring lower for quality. A linear trend line has been fitted to the data points. A second-degree polynomial fitted better but was strongly influenced by the data point to the right, the action plan for 2018–2021, scoring 45 points for quality. The second-degree polynomial was rejected, because extrapolation of it would give the nonsensical result that a high-quality plan would be expected to increase the number of killed or seriously injured road users.
The contents of the road safety plans
This section addresses the fourth aim, which is to examine the effectiveness of the road safety measures in the action plans, to see whether the share of effective measures have increased over time.
A crucial question which has so far not been examined is whether the action plans for road safety contain measures that are known, or can reasonably be assumed, to reduce the number of killed or seriously injured road users. The innovative aspects of the plans are unlikely to be effective unless they include the most important innovation of all: an increasing use of effective road safety measures, in particular measures designed to realise the targets set for the safety performance indicators.
The number of measures specified in each Action plan varies from 95 to 239. The number of measures in each group (see section 3.3) is stated as a percentage of all measures specified in each plan. The distribution of measures by effectiveness is shown in Table 3.
|
Action plan |
Effective |
Potentially effective |
Unknown effectiveness |
Adverse effects |
|---|---|---|---|---|
|
2002–2005 |
14.7% |
5.3% |
77.9% |
2.1% |
|
2006–2009 |
9.2% |
7.1% |
83.7% |
0.0% |
|
2010–2013 |
11.2% |
6.6% |
82.2% |
0.0% |
|
2014–2017 |
3.3% |
9.0% |
87.7% |
0.0% |
|
2018–2021 |
5.1% |
7.4% |
87.5% |
0.0% |
The huge majority of measures listed in the Action plans has been coded as not having any known effects on road safety. Obviously, lack of knowledge does not necessarily mean lack of effect. Some of these measures could be effective but evaluating their effects would be difficult.
Discussion
Conceptualising the road safety plans as innovation
The first aim of the study was to identify the elements in the successive Action Plans for road safety, examining whether innovative elements have been included over time related to the six key aspects of the plans. The first action plan for road safety was in itself an innovation. It was the first of its kind. However, it did not contain all the elements of the plan-do-check-adjust model. Fagerberg & Mowery (2006) refer to innovation as an idea for a new product or a process that has been implemented in a particular context. In this study, we focus on new elements that have been implemented in five successive Actions plans for road safety. The innovative elements concerned different aspects of the PDCA process, e.g. related to the type of targets, type of indicators, types of stakeholder cooperation. Our study indicates that the quality and level of innovative elements in the road safety plans have increased over time.
The first safety plan included several new policy features that in sum represented a radical policy innovation in the area of traffic safety. After the first plan was introduced, the main changes over the subsequent 16 years were that three main parts of the safety plans were modified through incremental innovation. First, from the outset the safety plans introduced safety performance indicators and targets, with an initial 8 indicators in the first plan. Throughout the subsequent five plans, the number of indicators increased with every plan (except in 2014), rising to 13 indicators in the latest plan. The analysis of road safety problems also became more integrated with the proposed road safety measures. The current set of safety performance indicators is quite broad but not identical to the safety performance indicators used in the European Union. More specifically, Norway does not include helmet wearing for riders of powered two-wheelers or response time to emergency calls among the safety performance indicators. Use of hand-held mobile phones is monitored irregularly. The targets for the safety performance indicators also became more ambitious with every plan. This is a typical example of completely new policy introduced with the first plan, which was then adjusted and improved through incremental steps over the next 16 years.
Second, the analysis shows that the number of stakeholders that signed the safety plans also increased over time. New stakeholders were added with nearly every revised plan, resulting in as much as 6 signatory stakeholders included in the last two safety plans.
Third, a quantified goal for reducing the number of killed and seriously injured was only introduced in the third plan (2010–2013). We interpret this as a radical change to the safety plans. In the subsequent plans, this goal was kept and adjusted through incremental steps.
Several of the innovative elements in the road safety plans are related to Vision Zero, e.g. the establishment of a new collaborative forum for the development of traffic safety policy, development of quantified traffic safety targets and a system for target-based management using traffic safety indicators (Elvik, 2022). Additionally, road safety plans have also become increasingly important in an international context (Hughes et al., 2019; Wegman, 2017), and it is therefore important to learn from the key elements of the road safety plans in the world’s best performer on road safety.
The importance of Vision Zero as a contributor to road safety indicates the crucial importance of innovation in road safety policy (Belin et al., 2012; Elvik, 2022). In spite of this, there seems to be relatively few studies focusing on innovation in road safety policy. The few previous studies that explicitly focus on innovation in road safety analyse the implementation of Vision Zero in Sweden at the start of the 2000s (Belin et al., 2012; Craens et al., 2022). Our study is the first to probe the relationship between innovative elements of road safety plans and the decline in the number of killed or seriously injured road users.
Checklist for road safety innovation
The second aim of the study was to develop a checklist to identify innovative elements in the road safety plans, focusing on the six key aspects, and to compare the level of quality and innovation in the plans over time. Our study indicates that the presence of such elements increases for each plan (except for the 2014–2017 plan), and that the total score for quality for the 2018–2021 Action plan was 45.0, the highest of the plans examined.
It is challenging to define innovations in the plans. The introduction of action plans for road safety was an innovation in itself, and over time different new elements have been included in the plans. Several of these changes are incremental, denoting small gradual changes. Other changes are more substantial; adding a substantially new aspect. For the sake of simplicity, we rate the new elements as either 0 (absent) or 1 (present) in each plan, and the sum of the points add up to a scale measuring innovative elements in road safety plans. The elements can be defined as innovations when introduced for the first time, and no longer represent innovations later on, for example 10 years after their introduction. Nevertheless, we include ‘old innovations’ when calculating the innovation scores of the newer road safety plans to be able to compare the number of innovations in the plans over time. Moreover, it is in principle possible for an innovation introduced in plan #1 to be rescinded in plan #2.
The relationship between plan's quality and road safety
The third aim was to examine whether it is possible to establish a statistical relationship between the innovative elements of the Action Plans for road safety and changes in the number of killed or seriously injured road users. More specifically: have the most innovative plans been more successful in reducing the number of killed or seriously injured road users than the less innovative plans?
A statistical relationship was found between the score for innovation/quality and the percentage reduction of the number of killed or seriously injured road users, but a causal interpretation of this relationship is not justified.
The effectiveness of measures in the plans
The fourth aim was to examine the effectiveness of the road safety measures in the action plans, to see whether the share of effective measures has increased over time. Our analysis indicates that the share of effective measures has not increased over time in the road safety plans. This might indicate that the share of effective measures in the plans is not the main explanation behind the increased level of road safety that we have seen, but rather the increasing ambition and the increasing innovative elements in the road safety plans. However, it is important to remember that we look at the share of effective measures here, to be able to compare over time, and that the actual number of effective measures might have increased over time. Our study indicates that the quality of the authorities’ systematic approach is key to road safety improvement. The institutional framework for developing the action plans has become more formalised over time and this may have generated a deeper commitment to improving road safety in all stakeholders involved.
The importance of culture
While safety structure or SMS (Safety Management System; see section 2.2) is about what the organisation ‘says it will do’ (formal aspects of safety), as defined in policies, plans, etc., safety culture is about what the organisation actually does on a daily basis (informal aspects of safety). Safety culture is safety-relevant features of culture in organisations (Antonsen, 2009; Hale, 2000). We define it as shared and safety-relevant ways of thinking or acting which are (re)created through negotiations between people in social contexts (Nævestad, 2010). The main purpose of implementing formal SMS is generally to influence the informal practices, i.e. ‘how things are actually done’ (Nævestad et al., 2018). This reminds us that while studying road safety plans, it is important to note that the actual (informal) implementation of the plans may be different from the formal description in the plans. Thus, it is important to study how plans are implemented. Moreover, it is also interesting to study how and whether introduction of formal road safety plans influences informal road safety culture, e.g. whether the increasing ambitions of road safety plans in Norway, informed by Vision Zero has led to a more ambitions Vision Zero road safety culture.
Conclusions
The main conclusions from this study can be stated as follows: The road safety plans can be seen as an example of continuous innovation over time. The first plan was a radical (policy) innovation in itself, and the subsequent plans have been incremental improvements. The more recent and most comprehensive plans (i.e. including the highest number of innovative elements over time) are associated with larger percentage reductions in the number of killed or seriously injured road users than the earlier plans. However, the relationship is noisy, and no causal inferences can be made.
The road safety plans have listed from 95 to 239 road safety measures, but only a few of these are known to reduce the number of killed or seriously injured road users. This does not mean that the other measures are ineffective; simply that their effects are not known and difficult to assess. It would be wrong to conclude that the measures with unknown effects should not be included in the road safety plans. For some of these measures, one can think of causal chains generating effects that would ultimately reduce the number of killed or seriously injured road users. Other measures are intended to bring about closer co-operation between various stakeholders. This may promote road safety by committing all stakeholders to contribute to improving safety and ‘pulling in the same direction’, so to speak.
Declaration of competing interests
The authors declare that they have no known competing financial interests or personal relationships that could have appeared to influence the work reported in this paper.
CRediT contribution statement
Rune Elvik: Conceptualisation, Formal analysis, Methodology, Writing—original draft, Writing—review & editing.
Tor-Olav Nævestad: Conceptualisation, Funding acquisition, Investigation, Project administration, Supervision, Writing—original draft, Writing—review & editing.
Vibeke Milch: Conceptualisation, Writing—review & editing.
Markus Bugge: Conceptualisation, Investigation, Resources, Writing—original draft, Writing—review & editing.
Håkon Endresen Normann: Resources, Writing—original draft, Writing—review & editing.
Erland Skogli: Conceptualisation, Resources, Writing—review & editing.