Geospatial analysis of mortality risk from road traffic crashes in Federal Capital Territory, Nigeria
Handling editor: Haneen Farah, Delft University of Technology, the Netherlands
Reviewers: Chuanyun Fu, University of British Columbia, Canada
Dimitrios Nikolaou, National Technical University of Athens, Greece
Received: 22 February 2023; Accepted: 19 June 2023; Published: 30 June 2023
Abstract
The objective of the study was to present a novel analytical approach using Nigerian trauma registry data to determine risks and hotspots of road traffic crash-related mortality for patients treated at National Trauma Centre, Abuja. Patient characteristics were compared between those who died at the hospital (n = 118) and those who survived (n = 2018). Multiple logistic regression and cluster analyses were used to identify risks of mortality and hotspots of high mortality and injury rates. The patient’s status as pedestrian (p < .0001), and whether the crash occurred on an expressway or transition zone between expressways and local roads (p = 0.0045) were significantly associated with mortality. Cluster analysis further isolated significant hotspots of mortality rate (Moran’s I = 0.31), pedestrian injury rate (Moran’s I = 0.34), and expressway/transition zone injury rate (Moran’s I = 0.18). For patients who survived to hospitalization at National Hospital Abuja, pedestrians involved in a crash and those whose crashes occurred on expressways/transition zones were at higher risk of mortality. High mortality and pedestrian and expressway/transition zone injury rates isolated to five contiguous administrative wards in Abuja. These analysis methods can be applied to determine risks and hotspots of crashes, injuries, and mortality in various settings.
Keywords
Abuja, cluster analysis, GIS, hotsport, road traffic injury, trauma registry
Introduction
Road traffic crashes are rapidly becoming one of the leading causes of injury and mortality globally. The death toll due to crashes is currently approximately 1.35 million fatalities per year (Bayomi et al., 2022; WHO, 2018). Crashes are the eighth leading cause of death in the world and the current greatest cause of death for those aged 5 to 29 years (WHO, 2018). This is particularly concerning in countries suffering from skilled workforce depletion (Sydhagen & Cunningham, 2007), as the economic productivity potential of this age group is high (Harper, 2014). Additionally, Globally, crashes are the cause of up to 50 million nonfatal injuries per year (WHO, 2018), and experts predict that by 2030 crashes will become the fourth leading cause of disability-adjusted life year loss (Mathers & Loncar, 2006).
Sub-Saharan Africa is particularly affected by the crash epidemic, as it has the highest crash mortality rate in the world (Marquez & Farrington, 2013). In Nigeria the crash-related mortality rate in 2012 was 162 per 100 000, which is 636% higher than the global average of 22 per 100 000 (Korter et al., 2013). A Nigerian has one chance in nine of dying due to a crash (Atubi & Gbadamosi, 2015) and as many as 200 000 Nigerians may be killed in crashes annually (Labinjo et al., 2009). Furthermore, crash-related deaths in Nigeria are increasing. In 2010 crashes were the fifth highest cause of death in Nigeria (CDC, 2013), and by 2016 they had become the third leading cause (Onyemaechi & Ofoma, 2016). Current data suggest that these rates continue to increase (NBS, 2017).
Nigeria’s Federal Road Safety Corps reported that Federal Capital Territory (FCT) had the highest number of crashes in 2017 compared to the other 36 states in the country (n = 1 106, 11.8% of total crashes) (FRSC, 2018). Of 3 025 patients who presented to National Hospital Abuja Trauma Centre in FCT between 2014 and 2017, over 60% were injured in a crash, of which 19% were pedestrians and 12% were using a motorcycle, tricycle, or bicycle (Holmes, 2019). Human factors predominated a recent qualitative analysis of road traffic crash etiology in FCT, especially reckless driving behaviors (Holmes et al., 2020).
The increasing trend of crashes will likely be propelled by a concurrent increase in the number of motor vehicles on Nigerian roads. Between 2000 and 2015 there was a 90% increase in the number of vehicles globally, and another 47% increase is expected by 2030 (WHO, 2015). Nigeria itself is poised to become the automotive capital of Africa by 2050 (Kazeem, 2015), as the total number of vehicles on Nigerian roads could even reach up to 69 million by that year (PwC, 2016).
There is limited geospatial research published that explores the patterns of crashes in FCT. Geospatial methods can enhance crash research by identifying where crashes, injuries, and fatalities occur; by exploring geographic patterns and trends; and by analyzing spatial associations. Also, crash prevention and intervention efforts can be optimized through geospatial research, especially in resource-limited settings where findings can maximize the use of funding by informing geographic prioritization. These methods are generally underutilized in trauma research (Whitaker et al., 2021), and crash experts are calling for their increased use, paired with descriptive and statistical methods (Ahmadi et al., 2017). This study is the first study of its kind in Nigeria to analyze trauma registry data via geospatial techniques to determine factors associated with road traffic injuries and fatalities. It was hypothesized that there is a significant crash location clustering pattern for patients who die in the hospital. This study’s results provide novel information on FCT crash sites, distributions, patterns, spatial associations, and risk factors. This study also presents a novel approach to determining such information by analyzing Nigerian trauma registry data, which can be utilized in similar settings in low- and middle-income countries (LMICs).
Materials and methods
Data collection
Injury data were analyzed from a HIPAA-compliant trauma registry of patients cared for at National Hospital Abuja (NHA) in FCT. Trauma registry data were de-identified and did not contain any protected health information. Trauma registry data collection began in 2010 following its inception as a joint project between Ahmadu Bello University Teaching Hospital in Zaria, NHA, and the Medical College of Wisconsin (MCW) (Cassidy et al., 2016). Currently only data from NHA in FCT are reported. The following data were included in the trauma registry analysis: presentation date, patient demographics, mechanism of injury, location of incident, and outcome (Holmes, 2019). The registry documents patient outcomes as alive (satisfactory, leaving against medical advice, admitted to an intensive care unit, awaiting surgery, pending, follow-up appointment, and discharged) and deceased (on arrival or while hospitalized).
Patient population for analysis
Patients sustaining traumatic injury between 1 January 2016 and 30 August 2018 were included in this analysis because these years had the most complete data on crash locations. Trauma patients who were not injured in a road traffic crash were excluded. Of 3 595 total trauma patients, 2 136 (59.4%) were injured in a road traffic crash. Crash patients whose crashes were geocoded (1 460 of 2 136 patients, 68.4%) were then assigned to one of the 60 wards within FCT based on the location of their crash, for spatial pattern mapping and cluster analysis.
Statistical and spatial analyses
Descriptive statistics were used to summarize the following patient characteristics: age, sex, mode of transportation, road type at crash location, and outcome (deceased or living). Age was compared between deceased persons and survivors using Wilcoxon rank-sum test. Wilcoxon rank-sum testing is preferable when comparing groups of continuous measurements with non-normal distributions. Sex, mode of transportation, and road type were compared using a chi-square test, which is widely used for comparing categorical data between groups. Multiple logistic regression analysis was used to evaluate risks of mortality in relation to age, sex, mode of transportation, and road type. Logistic regression analysis aims to isolate predictive factors of a binary variable, in this case traffic fatality. Goodness-of-fit of the logistic regression model was established using the Hosmer-Lemeshow test. Modes of transportation were divided into vehicle-users and pedestrians. Road types were divided into local roads and expressways or transition zones (areas where expressways transition into local roads, such as at junctions, bridges, and roundabouts).
Geographic Information Systems (GIS)-based exploratory spatial data analysis was conducted by comparing choropleth maps of road traffic mortality rate (defined as the number of patients involved in a crash who died after reaching NHA per 100 000 population), pedestrian injury rate (number of patients presenting to NHA who were injured in a crash as a pedestrian per 100 000 population), and the injury rate on expressway/transition zones (number of patients presenting to NHA who were injured in a crash on an expressway/transition zone per 100 000 population), as well as raw fatalities and injuries. This was followed by spatial autocorrelation analysis, in order to determine locations, distribution, patterns, and spatial associations of mortality, pedestrian injury, and expressways/transition zone injury rates. Spatial autocorrelation analysis measures the correlation of data values and locations simultaneously and determines whether spatial patterns, seen for instance in exploratory analysis, are significantly clustered or dispersed, or random.
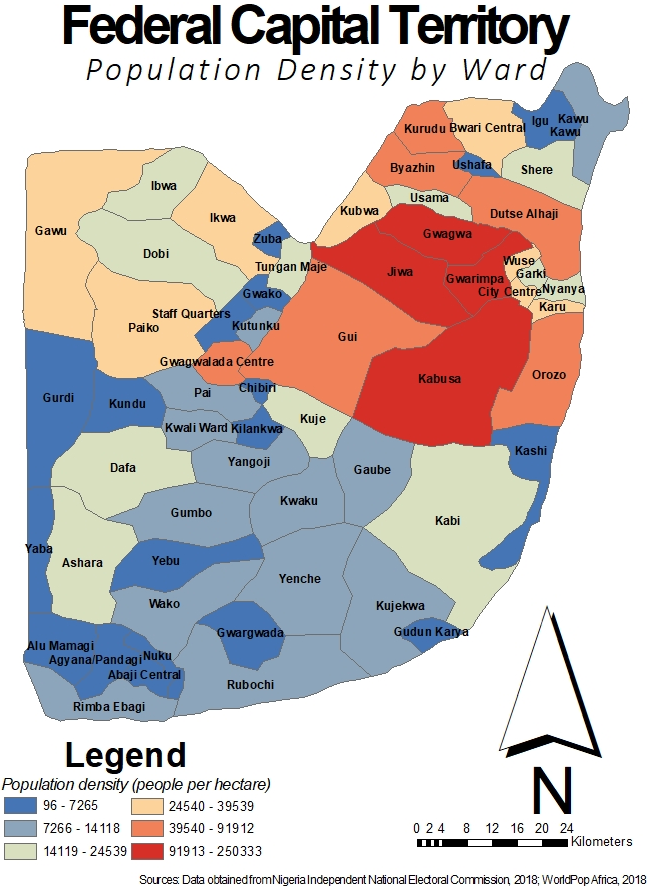
The administrative level 3 geographic region (ward) is the smallest geographic unit in FCT available for mapping and spatial analysis. There are 60 wards throughout FCT, and ward boundaries were created from Nigeria Independent National Electoral Commission polling unit maps (INEC, 2023) (Figure 1). As no census data are available at ward levels, population counts were derived for each ward using the WorldPop Africa dataset, where people per hectare were estimated for 2015 by using the random forest regression tree-based mapping approach (Stevens et al., 2015), with national totals adjusted to align with United Nations population division estimates (DESA, 2017; WorldPop, 2018). The estimated ward-level population is used for calculating the crash, injury, and mortality rates per 100 000 population. When referring to population, the remainder of this paper removes the word ‘estimated’. Results were considered statistically significant at p < 0.05. SAS OnDemand for Academics software (SAS Institute, Cary, NC) was used to conduct statistical analysis, and ArcGIS (Esri, Redlands, CA) and GeoDa (GitHub, San Francisco, CA) software were used to conduct geospatial analysis.
Results
Statistical analysis
A total of 2 136 patients treated at NHA for road traffic injuries were included in analysis. Table 1 summarizes descriptive statistics of patients and crashes. The median patient age was 30 years, ranging from 0 to 78 years. Most patients were male (n = 1 608, 75.3%). Approximately three quarters of the patients were injured in a vehicle (vehicles with ≥ four wheels, tricycles, motorcycles, and bicycles) (n = 1 615, 75.6%), while 521 (24.4%) of crash patients were injured as pedestrians. A total of 574 (26.9%) injuries occurred on expressways/transition zones (497 occurred on an expressway, and 77 occurred at junctions, bridges, and roundabouts), as compared to 1 562 (73.1%) on local roads. Nearly one quarter (n = 121) of pedestrians were injured on an expressway/transition zone. 118 crash patients (5.5%) died after reaching NHA.
|
Patient and crash characteristics |
Patient/crash population (n = 2 136) |
|---|---|
|
Median age, years (range) |
30 (0–78) |
|
Sex |
|
|
Female, n (%) |
527 (24.7%) |
|
Male, n (%) |
1 608 (75.3%) |
|
Missing |
1 |
|
Mode of transportation |
|
|
Vehicle, n (%) |
1 615 (75.6%) |
|
Pedestrian, n (%) |
521 (24.4%) |
|
Road |
|
|
Expressway/transition zone, n (%) |
574 (26.9%) |
|
Local, n (%) |
1 562 (73.1%) |
|
Outcome |
|
|
Living, n (%) |
2 018 (94.5%) |
|
Deceased, n (%) |
118 (5.5%) |
|
Patient and crash characteristics |
Deceased (n = 118) |
Living (n = 2018) |
p-value |
|---|---|---|---|
|
Median age, years (range) |
30.5 (2–72) |
30 (0–78) |
0.4425 |
|
Sex |
|
|
0.2601 |
|
Female, n (%) |
24 (4.6%) |
503 (95.4%) |
|
|
Male, n (%) |
94 (5.8%) |
14 (94.2%) |
|
|
Mode of transportation |
|
< .0001 |
|
|
Vehicle, n (%) |
67 (4.1%) |
1 548 (95.9%) |
|
|
Pedestrian, n (%) |
51 (9.8%) |
470 (90.2%) |
|
|
Road |
|
|
0.0045 |
|
Expressway/transition zone, n (%) |
45 (7.8%) |
529 (92.2%) |
|
|
Local, n (%) |
73 (4.7%) |
1 489 (95.3%) |
Table 2 summarizes results of bivariate analysis of patient and crash characteristics by patient outcome (i.e., whether the patient lived or died in hospital). Mode of transportation and road type were both significantly associated with patient outcome. A significantly higher proportion of pedestrians died at the hospital (n = 51, 9.8%) than vehicle-users (n = 67, 4.1%) (p < .0001). A significantly higher proportion of patients involved in a crash on an expressway/transition zone died (n = 45, 7.8%) than those who crashed on a local road (n = 73, 4.7%) (p = 0.0045).
Results of multiple logistic regression are summarized in Table 3. Crash patient fatality at NHA was positively associated with both involvement in a crash as a pedestrian (p < .0001) and involvement on an expressway/transition zone.
|
Variable |
Odds Ratio (95% CI) |
p-value |
|---|---|---|
|
Mode of transportation |
|
|
|
Vehicle |
Referent |
|
|
Pedestrian |
2.61 (1.78–3.81) |
< .0001 |
|
Road |
|
|
|
Local |
Referent |
|
|
Expressway/transition zone |
1.84 (1.25–2.72) |
0.0021 |
Spatial analysis
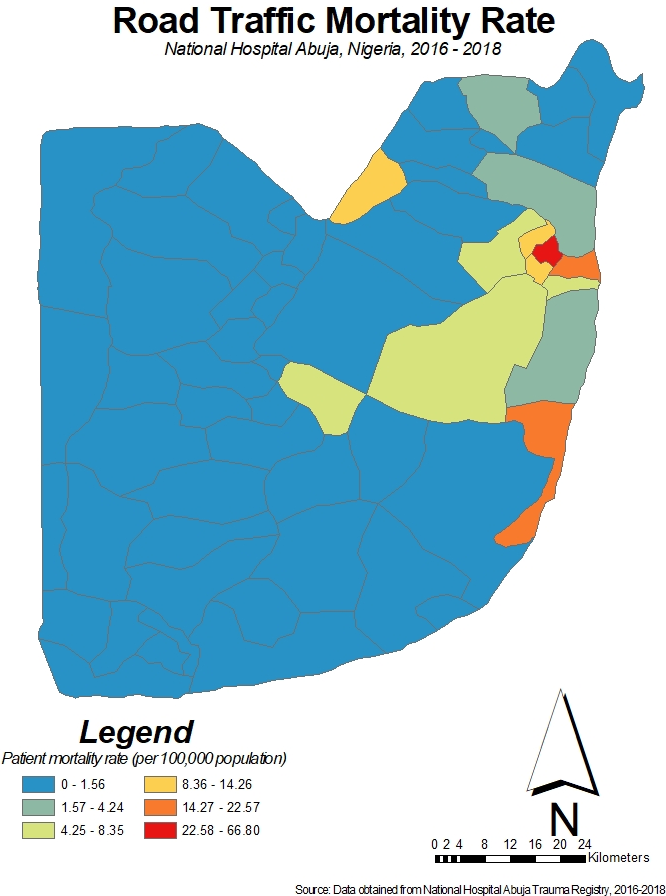
Spatial patterns and clustering of the road traffic mortality rate, pedestrian injury rate, and expressway/transition zone injury rate were analyzed. Figure 2 shows the road traffic mortality rate of crash patients after presenting to NHA, by FCT administrative ward, per 100 000 population, demonstrating the highest rates in the Garki, Nyanya, and Kashi wards descendingly.
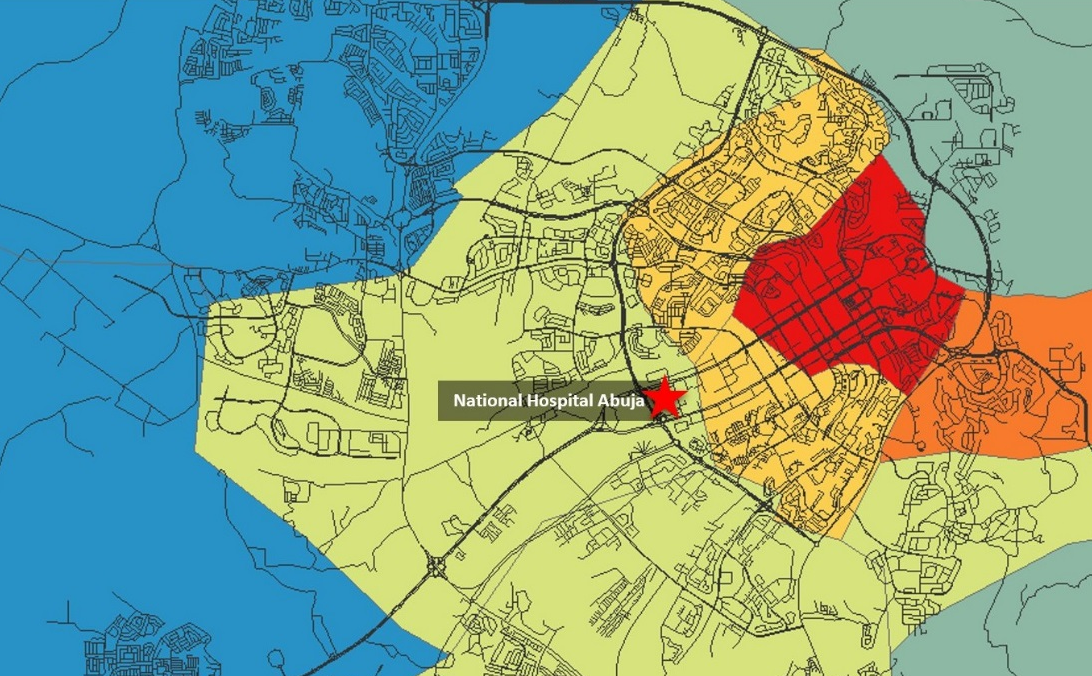
Figure 3 shows the road network in Abuja city center, comprising Garki, Nyanya, Wuse, City Centre, Karu, and Gwarimpa wards, and parts of Orozo and Dutse Alhaji, overlaying the mortality rate map, with the location of NHA.
Figure 4 depicts the raw number of crash patient deaths per administrative ward, in side-by-side comparison with the number of crash patients who presented to NHA per ward, demonstrating similar spatial patterning between death and crash occurrences.
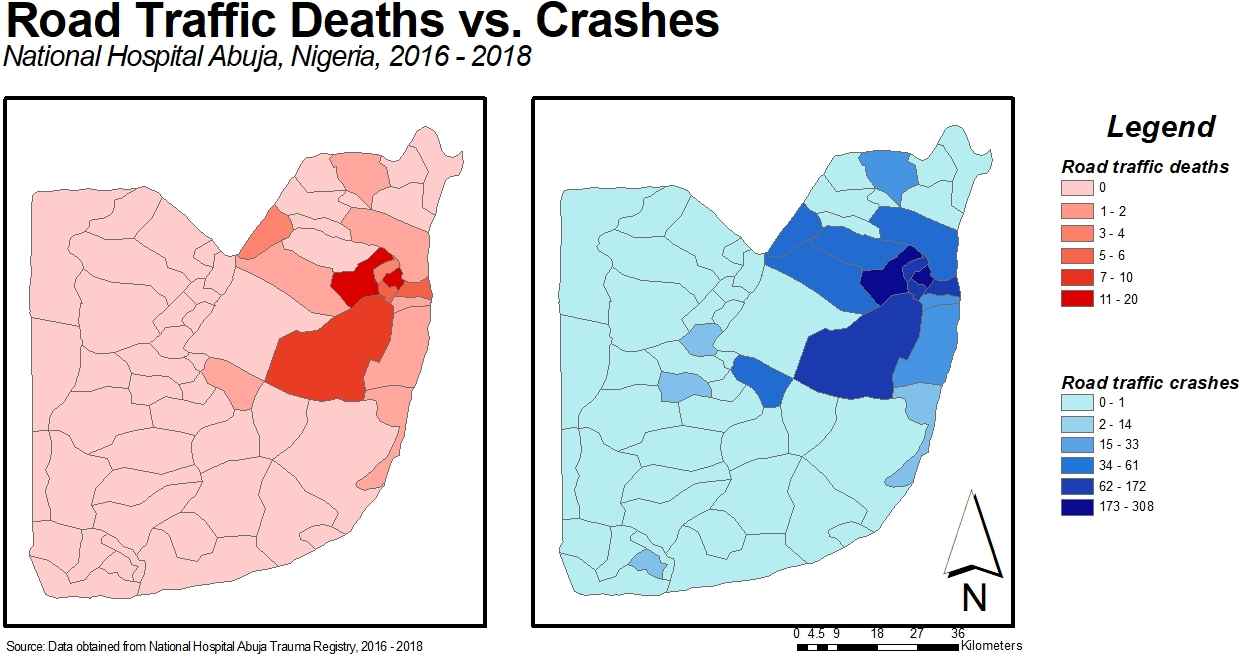
Figure 5; Figure 4 compare the road traffic mortality rate with pedestrian and expressway/transition zone injury rates, respectively.
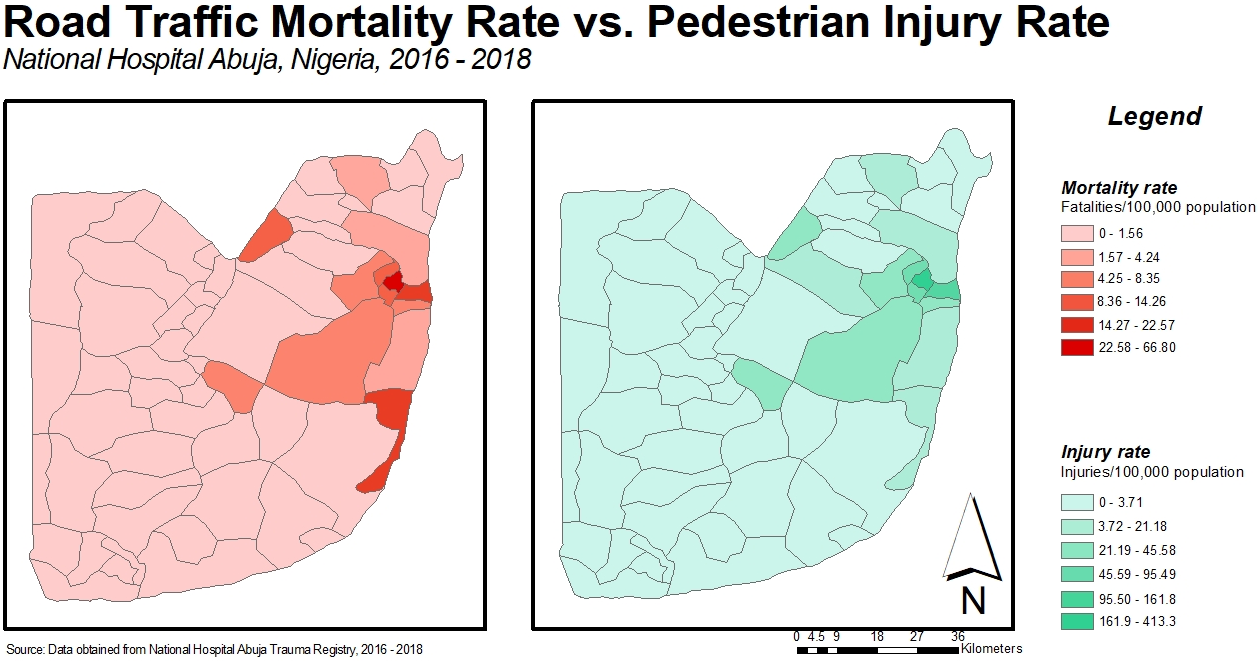
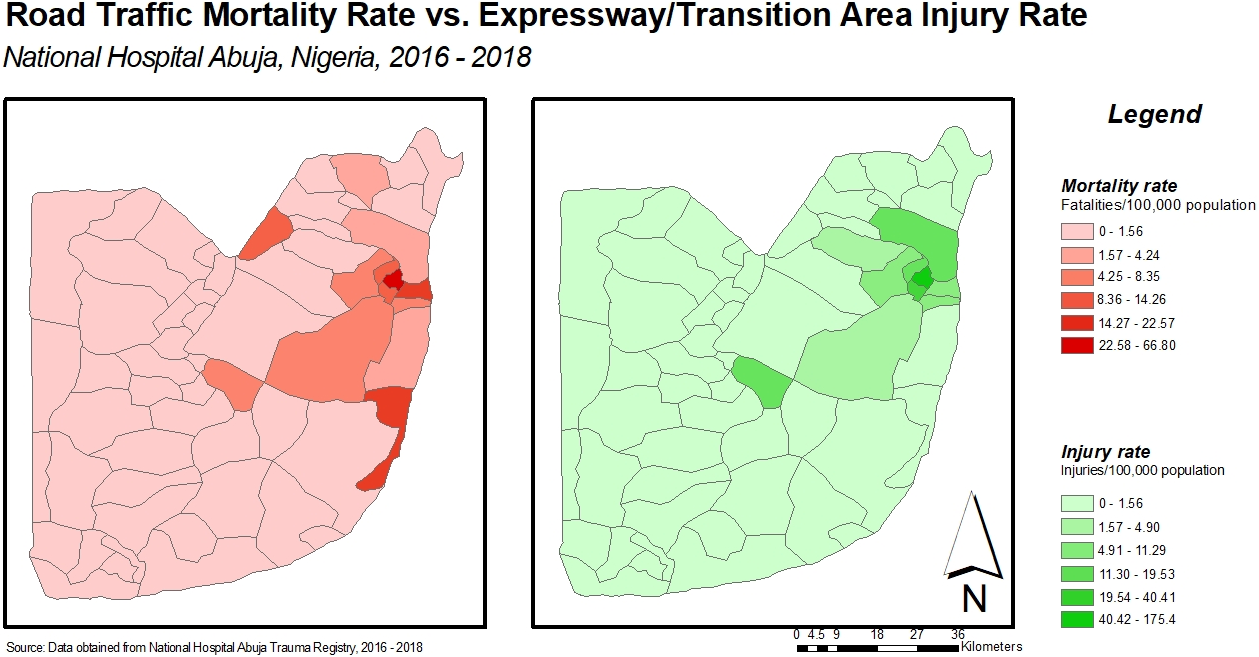
These choropleths suggest possible clustering and spatial autocorrelation of the road traffic mortality rate, pedestrian injury rate, and expressways/transition zone injury rate.
Spatial autocorrelation
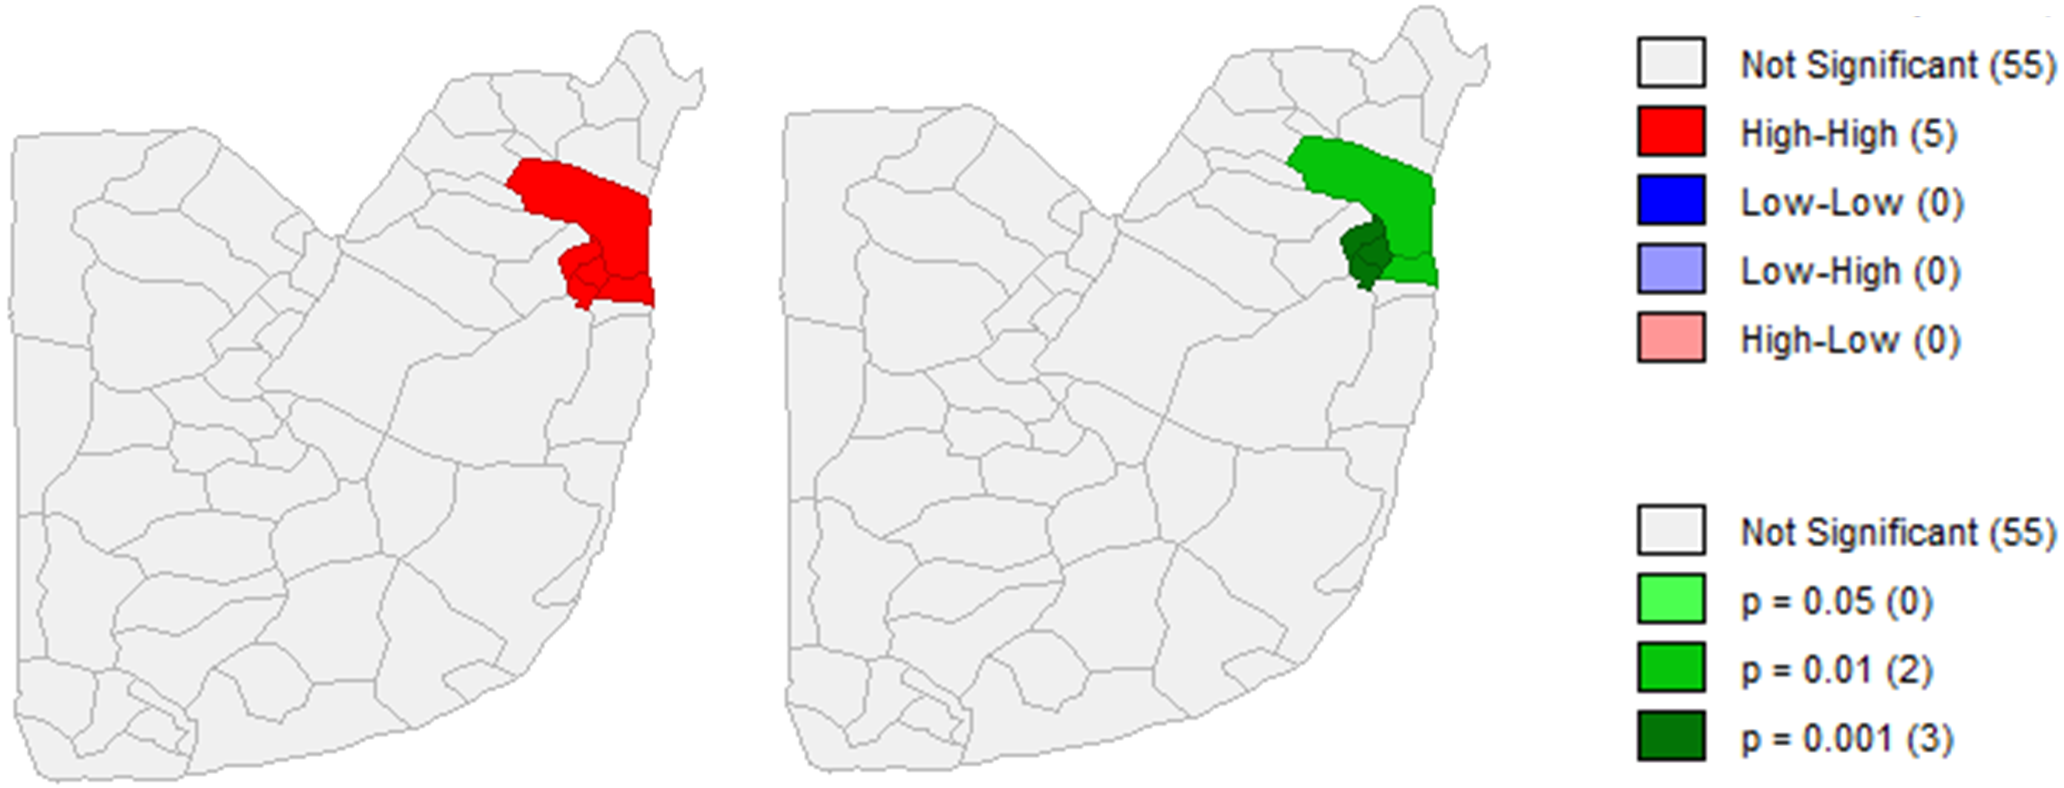
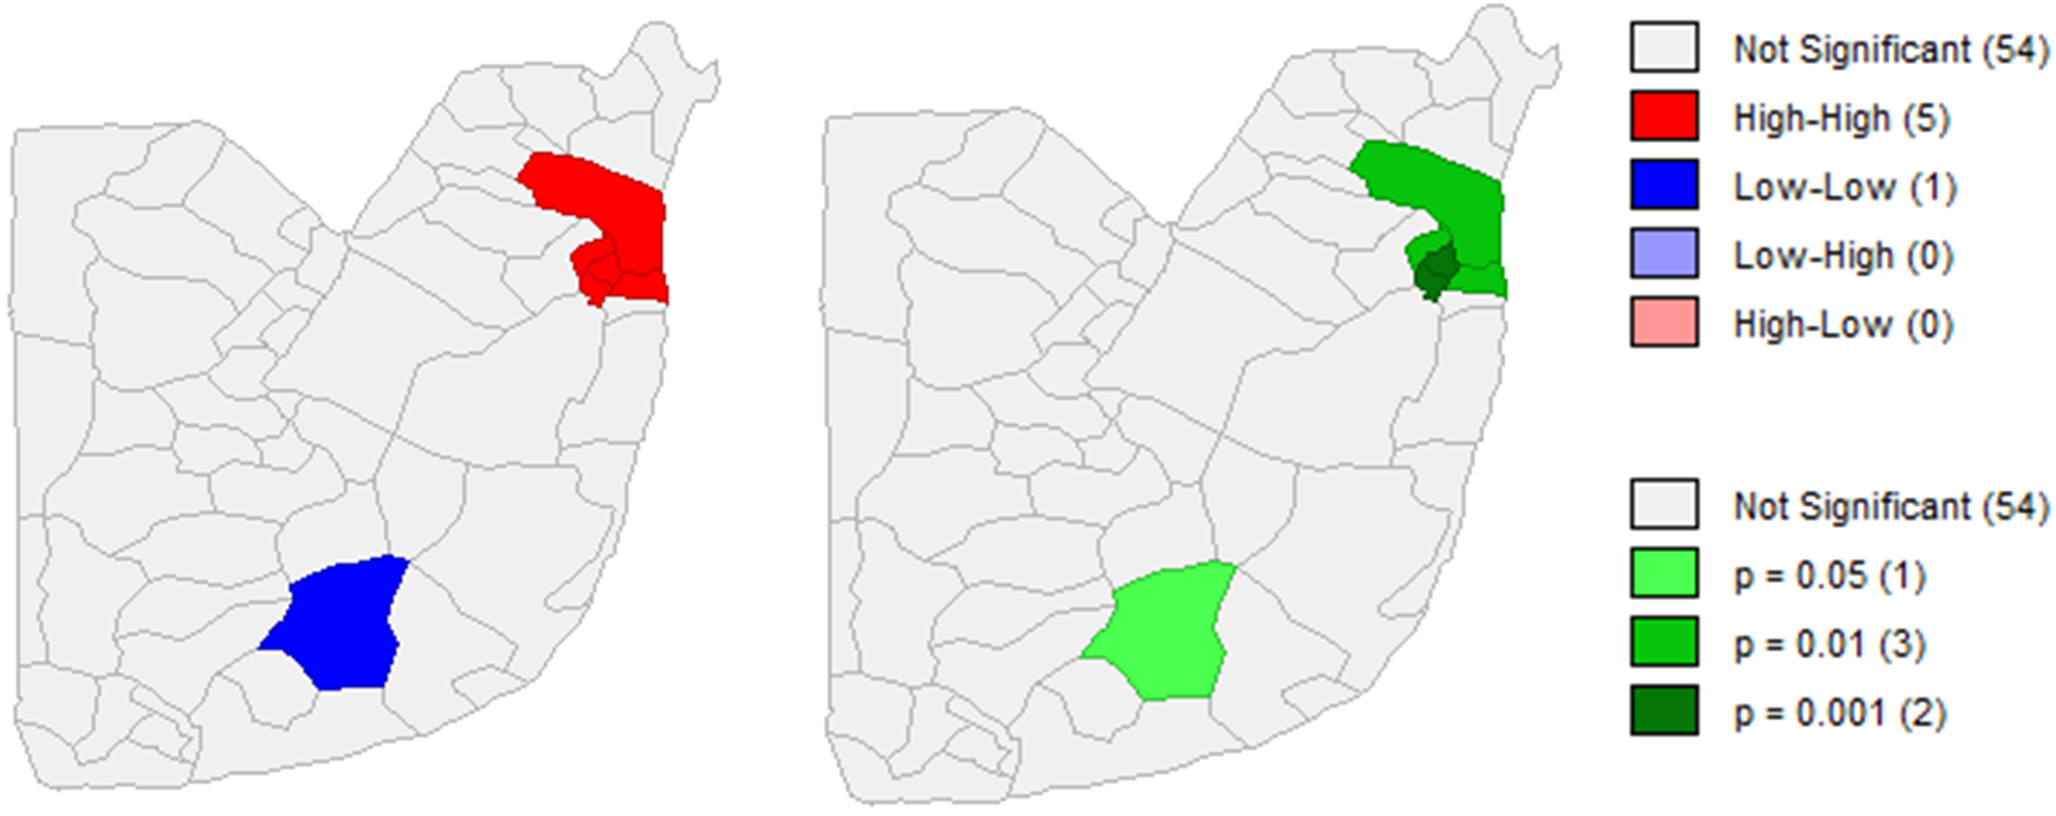
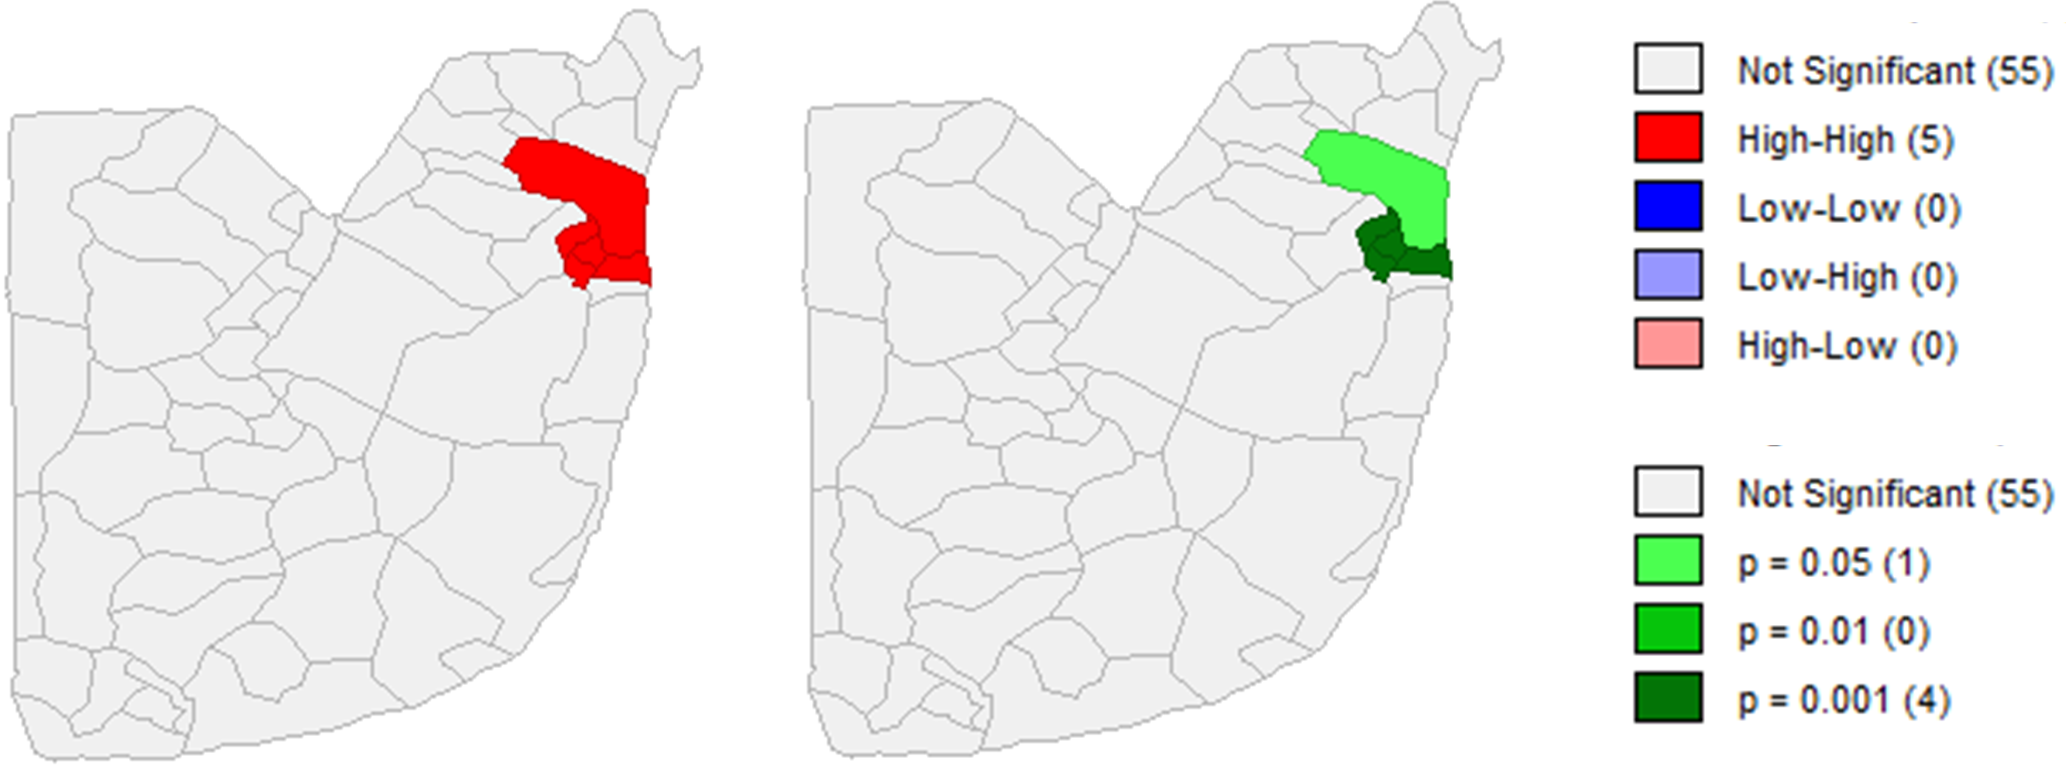
Spatial autocorrelation analysis resulted in statistically significant clustering of the population-adjusted road traffic mortality rate throughout FCT at the level of 0.01 (Moran’s I = 0.31). This indicates that the crash location clustering pattern for patients who die in the hospital is not likely due to chance. Similarly, pedestrian and expressway/transition zone injury rates were significantly clustered at the level 0.01 (Moran’s I = 0.34 and 0.18, respectively).
Figure 9; Figure 8; Figure 7 show the maps of local spatial autocorrelation analyses, with high-high clustering in red (Dutse Alhaji, Wuse, Garki, City Centre, and Nyanya wards on each of the maps) and low-low in blue (Yenche ward on the pedestrian injury map). High-high clustering indicates areas of high mortality or injury rates surrounded by areas with similarly high rates, and low-low clustering indicates areas of low mortality or injury rates surrounded by areas with similarly low rates. Cluster maps are presented side-by-side with significance maps, which indicate that these clusters are statistically significant.
Discussion
This retrospective cohort study described and compared characteristics of patients and road traffic crashes from the NHA trauma registry between January 2016 and August 2018. The results indicated that being involved in a crash as a pedestrian and being involved in a crash on an expressway/transition zone were both associated with an increased the risk for in-hospital mortality.
Mode of transportation
Although some researchers opine that the proportion of total crashes in Nigeria involving a pedestrian is comparatively low (Labinjo et al., 2009), others argue that pedestrian injuries are under-reported, as crashes involving pedestrians are frequently recorded as vehicular crashes (Aluko, 2018; Solagberu et al., 2015). Notably, in a recent survey exploring road-users’ attitudes in 32 countries, Nigeria had the second lowest safety perception score for pedestrians (Yannis et al., 2020). Pedestrian injuries may also more commonly result in death than injuries sustained by vehicle-users. Pedestrians do not wear helmets or protective clothing, and when contact with a vehicle occurs, impact on vital anatomical structures is unimpeded. Also, the high speeds at which vehicles are traveling on expressways when impact occurs with a pedestrian may lead to a higher likelihood of death. Crashes involving pedestrians have been shown to achieve greater than double the proportion of crash-related deaths in LMICs, compared to higher income countries (Sundet et al., 2018). Whereas just under 10% (n = 521) of total pedestrians in this study died at the hospital, 43% (n = 22) of pedestrians injured on expressways/transition zones died at the hospital. Further, severer injuries like these respond most favorably to immediate medical intervention, which may not be available in regions like FCT, of emergency medical services deficit (Solagberu et al., 2009). Pedestrian injuries and fatalities in Nigeria will likely increase over time as rising rural-urban migratory trends continue, population congestion increases, and higher numbers of pedestrians are exposed to a higher risk of vehicular contact (Buor, 2018).
Road type
The increased mortality from crashes on expressways/transition zones is not surprising given the traffic congestion on these types of roads and high-speed driving. Motorcycle and tricycle taxis are prohibited on expressways, so throngs of pedestrians are commonly found in transition zones, especially in highly populated areas in and around Abuja city center, as passenger interchange occurs here. Pedestrians are also commonly found crossing busy expressways on foot. Walking bridges have been built in some areas to provide safe transit for pedestrians crossing expressways, but it is conceivable that pedestrians may find them inconvenient to use and opt for a quicker method. A high number of pedestrians tend to cross expressways at night when markets along the expressways are open to customers who are just finishing their workday. This may place them at increased risk. Crashes on expressways during these times may be more severe, due to the higher numbers of pedestrians and limited visibility for both pedestrians and vehicle-users.
Next steps
There are several implications from these findings. Significant high-high spatial clustering of road traffic mortality rate, pedestrian injury rate, and injury rate on expressways/transition zones in the same five wards (Dutse Alhaji, Wuse, Garki, City Centre, and Nyanya) demonstrates the hotspots of injuries which lead to fatalities for crash patients presenting to NHA. A high density of transition zones is apparent in these five wards, which may place a large percentage of the pedestrian population in these wards at greater risk of injury and death and could explain why these specific wards comprise the cluster. These maps can serve as a blueprint of geographic prioritization for public and community health specialists and policymakers attempting to effect the highest impact at the lowest expense. Such efforts may include: studying pedestrian behaviorisms in greater depth using the Pedestrian Behavior Questionnaire (Bayomi et al., 2022), providing greater incentive for pedestrians in these five wards to use walking bridges over expressways; restructuring pedestrian/public transit interchange locations to offset them from junctions, bridges, and roundabouts in these five wards; and improving roadway emergency medical services, beginning in these five wards.
Limitations
This study has limitations. First, the data used were specific to NHA; they are not representative of the entire FCT. However, NHA houses FCT’s largest trauma center with a broad catchment area. These data can be triangulated with FRSC data to enhance the external validity of findings (Brennan & Shepherd, 2012). Second, this was a retrospective analysis and while the data were relatively complete upon admission, some entries were not geocoded, and there were missing data related to mortality, including post-discharge mortality. Descriptive and regression analyses were performed on both the total crash patient dataset (n = 2 136) and georeferenced data (n = 1 460) for comparison, with nearly identical results. Finally, although a spatial disparity in mortality rate was evident and there are known risk factors such as density of expressways, testing the effects of those factors was not feasible because of unavailable spatially matched data. It is important to continue the efforts to create reliable spatial datasets for further analyses, which would improve understanding of the interactions of environment and human behaviors and health outcomes.
Conclusions
Determining risk factors and hotspots of crash patient mortality is an essential step in addressing this health concern in affected communities, particularly in LMICs where preventative and interventional resources are limited. The methods described in this paper can be utilized to isolate risk factors and hotspots in various settings. Road traffic crashes are a significant problem in FCT. Nearly 60% of all trauma patients who presented to NHA between 1 January 2016 and 30 August 2018 were injured in a crash. One quarter of those were injured as a pedestrian, and 27% of them were injured on expressways/transition zones. Pedestrians involved in a crash, and those whose crashes occurred on expressways/transition zones are at higher risk of death after reaching NHA. A significant hotspot for mortality, pedestrian injury, and expressway/transition zone injury rates were identified in FCT, intaking Dutse Alhaji, Wuse, Garki, City Centre, and Nyanya wards. The mechanisms underlying these relationships warrant further research. This study can help guide research, and results from this and subsequent studies can inform the development of road traffic crash prevention and intervention policies, and the allocation of limited resources.
Declaration of competing interests
The authors report no conflicting interests.
Ethics statement
This study was approved by the Institutional Review Boards at both NHA and MCW/Froedtert Hospital.
CRediT contribution statement
Benjamin D. Holmes: Conceptualization, Data curation, Formal analysis, Investigation, Methodology, Writing—original draft, Writing—review & editing.
Yuhong Zhou: Formal analysis, Software, Writing—review & editing.
Ruta Brazauskas: Methodology, Formal analysis, Writing—review & editing.
Kirsten M. Beyer: Methodology, Formal analysis, Writing—review & editing.
Emmanuel A. Ameh: Conceptualization, Resources, Writing—review & editing.
Oluwole O. Olaomi: Conceptualization, Data curation, Resources.
Laura D. Cassidy: Conceptualization, Methodology, Resources, Supervision, Writing—review & editing.