Safety of horizontal curves on rural two-lane roads in Norway
Handling editor: Carmelo D'Agostino, Lund University, Sweden
Reviewers: Dick de Waard, University of Groningen, the Netherlands
Mariano Pernetti, University of Campania, Italy
Received: 21 February 2023; Accepted: 11 April 2023; Published: 19 April 2023
Abstract
Horizontal curves are found on all roads. The relationship between the characteristics of horizontal curves and the number of accidents is complex and no previous study has included all factors that are potentially influential for accidents. This paper presents a study of 63 969 horizontal curves on rural two-lane roads in Norway. Accident prediction models including more characteristics of horizontal curves than used in any previous study were developed. Most of the characteristics were found to be related to the number of accidents. Most coefficients were consistent with those found in previous studies, but some findings were surprising. Compound curves, which are curves in which radius varies throughout the curve, were found to be safer than circular or nearly circular curves. A steeper slope of a vertical grade before a curve is associated with fewer accidents.
Keywords
accident prediction model, horizontal curve, negative binomial regression
Introduction
Horizontal curves are found on all roads, although they may be sharper and more numerous on some roads than on other roads. The association between the number of accidents and characteristics of horizontal curves, like radius or length, has been studied in several studies, see next section. However, it is increasingly understood that the relationship between the characteristics of horizontal curves and the number of accidents is complex and depends on many characteristics of curves. Thus, Elvik (2017) remarks:
‘It is increasingly understood that safety in horizontal curves depends on many characteristics of the curves (Hauer, 1999): radius, the presence of transition curves, super-elevation, interaction with vertical curves, distance to adjacent curves, number of lanes and whether the road is rural or urban. None of the studies included in Figure 1 [of the 2017-paper] took all these factors into account. It is therefore not clear how any of the studies included in Figure 1, or a synthesis of them, can be applied in a specific context (defined in terms of the characteristics mentioned above) to predict the safety effect of a specific choice of curve radius.’
The main objective of this paper is to study how various characteristics of horizontal curves on rural two-lane roads in Norway are related to the number of accidents. The paper aims to include more characteristics than any previous study of the relationship between horizontal curves and the number of accidents. A review of previous studies follows, before the data used in the current study are presented and accident prediction models developed.
Review of previous studies
Table 1 lists studies that have been reviewed and indicates for each study the characteristics of horizontal curves it included. The studies were identified from previous papers (Elvik, 2013; Elvik, 2017; Elvik, 2019; Elvik, 2022) and a search using Google Scholar.
|
Study |
Radius |
Length |
Spiral transition curve |
Super-elevation |
Tangent length |
Radius of neighbour curve |
Deflection angle |
Vertical grade or curve |
Shoulder width |
Road surface friction |
Road surface roughness |
|---|---|---|---|---|---|---|---|---|---|---|---|
|
* |
* |
* |
|||||||||
|
* |
* |
* |
|||||||||
|
* |
* |
||||||||||
|
* |
* |
* |
|||||||||
|
* |
* |
* |
|||||||||
|
* |
* |
||||||||||
|
* |
* |
* |
* |
||||||||
|
* |
* |
* |
|||||||||
|
* |
* |
* |
|||||||||
|
* |
* |
* |
|||||||||
|
* |
|||||||||||
|
* |
* |
* |
|||||||||
|
* |
* |
* |
* |
||||||||
|
* |
* |
* |
|||||||||
|
* |
* |
* |
* |
||||||||
|
* |
* |
* |
|||||||||
|
* |
|||||||||||
|
* |
|||||||||||
|
* |
* |
* |
|||||||||
|
* |
* |
* |
A total of 11 characteristics of horizontal curves are listed in Table 1. The two most frequently studied are curve radius and curve length. Almost all studies have found that the number of accidents increases when the radius of a curve becomes smaller; i.e. sharp curves have more accidents than gentle curves. The length of a curve also tends to be positively associated with the number of accidents: the longer the curve, the more accidents. Other characteristics have been less frequently studied, but the length of the tangent section before a curve is positively associated with the number of accidents in curves: the longer the straight section, the more accidents in curves.
It is seen that most studies listed in Table 1 included only a few of the characteristics of horizontal curves. No study included more than four of the eleven characteristics. Some characteristics, like the presence of a spiral transition curve, super-elevation and pavement roughness, have been addressed in only a single of the studies listed in Table 1. To more fully understand the complexity of the safety of horizontal curves, studies including more characteristics of such curves are needed.
Data
The data used in this study were collected by the Norwegian Public Roads Administration, Region East (Strandvik Haugvik, 2018). The data were collected by means of inspection cars driving along all roads and collecting data on horizontal and vertical alignment by means of laser scanning at a resolution of 6.7 millimetres across the road and 12 centimetres along the road. Data on traffic volume and the number of accidents were taken from the national road data bank. Accident data include injury accidents involving vehicles running off the road. The data comprise the years from 2006 to 2017. Traffic volume is stated as Annual Average Daily Traffic (AADT) and is a mean value for the period covered by accident data. Table 2 shows minimum values, maximum values, mean values and standard deviations for all variables included in the study.
|
Variable |
Minimum |
Maximum |
Mean |
Standard deviation |
|---|---|---|---|---|
|
Number of accidents |
0 |
5 |
0.02279 |
0.16401 |
|
Annual Average Daily Traffic (AADT) |
6 |
29 550 |
1 506 |
2 435 |
|
Radius of curve (metres) |
7 |
696 |
261 |
166 |
|
Length of curve (metres) |
11 |
820 |
98 |
66 |
|
Length of spiral transition curve (metres) |
0 |
1012 |
23 |
51 |
|
Length of straight section before curve (metres) |
1 |
6 960 |
90 |
177 |
|
Dummy for compound curve* |
0 |
1 |
0.17 |
0.37 |
|
Dummy for downward grade before curve |
0 |
1 |
0.46 |
0.50 |
|
Dummy for upward grade before curve |
0 |
1 |
0.49 |
0.50 |
|
Slope of downward grade before curve (%) |
0.0 |
-13.8 |
-1.2 |
2.1 |
|
Slope of upward grade before curve (%)† |
0.0 |
14.8 |
1.3 |
2.4 |
|
Number of curves upstream of curve |
0 |
19 |
2.22 |
2.39 |
|
Length of section for counting upstream curves‡ |
0 |
1 999 |
1 558 |
643 |
|
Super-elevation (%) |
0.0 |
17.9 |
3.6 |
2.2 |
|
Variation of super-elevation (%)§ |
0.0 |
70.9 |
5.6 |
4.0 |
|
Dummy for adequate cross slope before curve |
0 |
1 |
0.70 |
0.46 |
|
Dummy for adequate cross slope in curve |
0 |
1 |
0.63 |
0.48 |
|
Rut depth (millimetres) |
0.3 |
1 628.6 |
6.9 |
8.3 |
|
International Roughness Index (IRI) value |
0.46 |
7.59 |
2.93 |
1.31 |
* A compound curve is a curve in which radius varies throughout the curve.
† Two values listed as 208 were regarded as errors, since a grade cannot exceed 90 degrees (it is then fully vertical).
‡ This variable was not included in the accident prediction models.
§ The upper value of 70.9 is implausible.
The mean number of accidents per curve was 0.02279. This is a very low number. The total number of accidents was 1458. Mean AADT was just 1506 reflecting the fact that most rural two-lane roads in Norway have very low traffic volume. Two curves had a vertical grade before the curve of 208 degrees, which clearly must be wrong. Apart from this, the rest of the data had plausible values for all variables. Table 3 shows the distribution of accidents between the 63 969 curves included in the study.
|
Accident count |
Empirical distribution |
Poisson distribution |
Negative binomial distribution |
Poisson lognormal distribution |
|---|---|---|---|---|
|
0 |
62 632 |
62 528 |
62 632 |
62 623 |
|
1 |
1 238 |
1 425 |
1 227 |
1 250 |
|
2 |
81 |
16 |
98 |
77 |
|
3 |
15 |
0 |
10 |
11 |
|
4 |
2 |
0 |
1 |
3 |
|
5 |
1 |
0 |
0 |
1 |
|
Sum |
63 969 |
63 969 |
63 968 |
63 969 |
|
Mean |
0.02279 |
|
|
|
|
Variance |
0.02690 |
|
|
|
|
Overdispersion parameter |
7.90730 |
|
|
|
|
Chi-square |
|
χ2 = 442.19 |
χ2 = 7.50 |
χ2 = 0.92 |
|
Degrees of freedom |
|
Df = 2 |
Df = 3 |
Df = 3 |
|
P-value |
|
P < 0.000 |
P = 0.058 |
P = 0.821 |
Note: Cells with estimated frequency less than 5 have been merged with cells with estimated frequency more than five when estimating the Chi-square.
It is seen that the Poisson lognormal distribution best fits the empirical distribution of accidents. The negative binomial distribution also has a quite good fit to the empirical distribution. A negative binomial regression model was used when developing accident prediction models. There was no excessive number of zeros in the data. In fact, the fitted number of curves with zero accidents according to the negative binomial distribution is identical to the observed number (63 632).
Accident prediction models
Accident prediction models were developed in stages, by adding new variables at each stage. This was done in order to assess the stability of regression coefficients across model specifications. Table 4 shows the pairwise correlations between the variable included in the models (Pearson's r 2). Most of the correlations are low. Only two correlations out of 153 exceed ±0.6. These have been highlighted in the Table 4.
|
(1) |
(2) |
(3) |
(4) |
(5) |
(6) |
(7) |
(8) |
(9) |
(10) |
(11) |
(12) |
(13) |
(14) |
(15) |
(16) |
(17) |
(18) |
|
|---|---|---|---|---|---|---|---|---|---|---|---|---|---|---|---|---|---|---|
|
(1) |
1 |
.113 |
-.050 |
.107 |
.005 |
.029 |
.065 |
-.002 |
-.018 |
.013 |
-.008 |
-.013 |
.027 |
.049 |
-.006 |
-.023 |
.003 |
-.066 |
|
(2) |
1 |
.137 |
.057 |
.175 |
.169 |
.077 |
.087 |
-.083 |
.007 |
-.003 |
-.154 |
.143 |
-.080 |
-.018 |
.023 |
.059 |
-.451 |
|
|
(3) |
|
1 |
-.262 |
.576 |
.424 |
-.064 |
.100 |
-.076 |
.023 |
.046 |
-.386 |
.013 |
-.507 |
-.009 |
.076 |
.018 |
-.350 |
|
|
(4) |
|
|
|
1 |
.043 |
.120 |
.523 |
-.020 |
-.009 |
.042 |
.009 |
.146 |
.209 |
.328 |
.002 |
-.079 |
-.023 |
-.208 |
|
(5) |
|
|
|
|
1 |
.591 |
.052 |
.069 |
-.075 |
.054 |
.038 |
-.275 |
.093 |
-.277 |
.056 |
.045 |
.013 |
-.361 |
|
(6) |
|
|
|
|
|
1 |
.078 |
.110 |
-.106 |
.025 |
.021 |
-.323 |
.084 |
-.212 |
.017 |
-.009 |
.010 |
-.345 |
|
(7) |
|
|
|
|
|
|
1 |
-.002 |
-.015 |
.019 |
-.006 |
.007 |
.138 |
.126 |
.010 |
-.020 |
.005 |
-.120 |
|
(8) |
|
|
|
|
|
|
|
1 |
.307 |
-.617 |
.567 |
-.122 |
-.001 |
-.077 |
-.204 |
-.162 |
-.008 |
-.107 |
|
(9) |
|
|
|
|
|
|
|
|
1 |
-.497 |
.541 |
.093 |
-.023 |
.060 |
.187 |
.139 |
.001 |
.068 |
|
(10) |
|
|
|
|
|
|
|
|
|
1 |
-.919 |
.043 |
.027 |
.014 |
-.000 |
.011 |
.008 |
-.013 |
|
(11) |
|
|
|
|
|
|
|
|
|
|
1 |
.029 |
-.009 |
-.008 |
-.000 |
-.011 |
-.004 |
-.046 |
|
(12) |
|
|
|
|
|
|
|
|
|
|
|
1 |
-.006 |
.289 |
.017 |
-.020 |
-.005 |
.167 |
|
(13) |
|
|
|
|
|
|
|
|
|
|
|
|
1 |
.071 |
.203 |
.435 |
.099 |
-.099 |
|
(14) |
|
|
|
|
|
|
|
|
|
|
|
|
1 |
.020 |
-.119 |
.057 |
.195 |
|
|
(15) |
|
|
|
|
|
|
|
|
|
|
|
|
|
1 |
.439 |
.034 |
.032 |
|
|
(16) |
|
|
|
|
|
|
|
|
|
|
|
|
|
|
1 |
.048 |
.002 |
|
|
(17) |
|
|
|
|
|
|
|
|
|
|
|
|
|
|
|
1 |
.231 |
|
|
(18) |
|
|
|
|
|
|
|
|
|
|
|
|
|
|
|
|
1 |
Variables: (1) Number of accidents; (2) Annual Average Daily Traffic, AADT; (3) Radius of curve, metres; (4) Length of curve, metres; (5) Length of spiral transition curve, metres; (6) Length of straight section before curve, metres; (7) Dummy for compound curve; (8) Slope of downward grade before curve, %; (9) Slope of upward grade before curve, %; (10) Dummy for downward grade before curve; (11) Dummy for upward grade before curve: (12) Number of curves upstream of curve; (13) Super-elevation, %; (14) Variation of super-elevation, %; (15) Dummy for adequate cross slope before curve; (16) Dummy for adequate cross slope in curve: (17) Rut depth, millimetres; (18) International Roughness Index, IRI, value.
(Lord, 2006) has pointed out that estimates of the overdispersion parameter can be unstable in samples characterised by a low mean value. The mean value in this sample is clearly very low (0.02279). On the other hand, sample size is large (63 969). As a rule-of-thumb, (Lord, 2006) suggests that if the product of mean value and sample size exceeds 1 000, a low mean value should not be a problem. Nevertheless, estimates of the overdispersion parameter will be assessed critically with a view to potential instability and unreasonable values.
Table 5 shows estimated coefficients in negative binomial accident prediction models developed in four stages. The first stage included traffic volume only. At successive stages, additional predictor variables were added. For length of spiral transition curves, 1 was added before converting the variable to natural logarithms. The radius of a curve is the minimum radius of the curve.
|
Terms |
Model 1 |
Model 2 |
Model 3 |
Model 4 |
|---|---|---|---|---|
|
Constant term |
-8.3634 (0.1780) [0.000] |
-11.2031 (0.3916) [0.000] |
-11.0180 (0.4540) [0.000] |
-9.1536 (0.5830) [0.000] |
|
Ln (AADT) |
0.6526 (0.0238) [0.000] |
0.6677 (0.0244) [0.000] |
0.6458 (0.0246) [0.000] |
0.5825 (0.0271) [0.000] |
|
Ln (Radius) |
|
-0.6901 (0.0463) [0.000] |
-0.7359 (0.0467) [0.000] |
-0.7894 (0.0530) [0.000] |
|
Ln (Length) |
|
1.2968 (0.0662) [0.000] |
1.3050 (0.0659) [0.000] |
1.1999 (0.0701) [0.000] |
|
Ln (Length of spiral transition+1) |
|
-0.0379 (0.0383) [0.322] |
-0.0490 (0.0386) [0.204] |
-0.0413 (0.0391) [0.290] |
|
Ln (Length of straight section+1) |
|
0.1267 (0.0215) [0.000] |
0.0967 (0.0221) [0.000] |
0.0823 (0.0222) [0.000] |
|
Dummy for compound curve |
|
-0.3594 (0.0785) [0.000] |
-0.3667 (0.0784) [0.000] |
-0.3267 (0.0784) [0.000] |
|
Slope of downward grade before curve (%) |
|
|
0.0176 (0.0183) [0.337] |
0.0052 (0.0194) [0.790] |
|
Slope of upward grade before curve (%) |
|
|
-0.0625 (0.0200) [0.002] |
-0.0537 (0.0211) [0.011] |
|
Dummy for downward grade before curve |
|
|
0.5592 (0.2456) [0.023] |
0.4513 (0.2651) [0.089] |
|
Dummy for upward grade before curve |
|
|
0.5385 (0.2460) [0.029] |
0.4285 (0.2654) [0.106] |
|
Super-elevation (%) |
|
|
|
-0.0234 (0.0155) [0.132] |
|
Variation of super-elevation (%) |
|
|
|
0.0194 (0.0075) [0.010] |
|
Number of curves upstream of curve |
|
|
|
-0.0687 (0.0147) [0.000] |
|
Dummy for adequate cross slope before curve |
|
|
|
0.0751 (0.0692) [0.278] |
|
Dummy for adequate cross slope in curve |
|
|
|
-0.1676 (0.0717) [0.019] |
|
Rut depth (millimetres) |
|
|
|
0.0018 (0.0020) [0.351] |
|
International Roughness Index (IRI) value |
|
|
|
-0.2113 (0.0348) [0.000] |
|
Overdispersion parameter |
4.4454 (0.5125) [0.000] |
1.9824 (0.2791) [0.000] |
1.9179 (0.2721) [0.000] |
1.7331 (0.2600) [0.000] |
|
Elvik index |
0.4378 |
0.7493 |
0.7575 |
0.7808 |
Note: Cell values provide the coefficient, (standard error) and [P-value].
Vertical grades were included both as dummy variables, indicating the presence of a grade, and as numerical variables indicating the steepness of the grade in percent, stated as positive numbers for upward grades and negative numbers for downward grades. This definition of the variables was chosen to avoid the problem of missing values. If grade is included as two variables, one with a positive sign (upward) and one with a negative sign (downward), the data cells for upward slope will be empty when there is a downward slope, and vice versa. The statistical software interprets empty cells as missing values; consequently both variables will be interpreted as consisting of missing values only.
For variables that were included in more than one model, it is seen that estimates of the regression coefficients are quite stable. Most estimates are slightly attenuated (become smaller in value) as more variables are added to the model, but none of them change sign. Goodness-of-fit is evaluated by means of the Elvik index (Fridstrøm et al., 1995). This is based on the overdispersion parameter. The overdispersion parameter is defined as follows:
Var(x) is the variation of the recorded number of accidents, λ is the expected number of accidents, either as predicted by means of accident prediction models or as the mean value of the distribution of accidents between the units of observation used in developing an accident prediction model, and μ is the overdispersion parameter. The overdispersion parameter can be estimated both for crude data and as an estimator of residual variance in an accident prediction model. To estimate the overdispersion parameter in crude data, solve Equation 1 for μ. This gives:
Denoting the overdispersion parameter in the crude data as and the overdispersion parameter in a fitted model as , the Elvik index is defined as follows:
It takes on values between 0 and 1 and shows the share of systematic variation in accident counts explained by the model. It is seen from Table 3 that the overdispersion parameter of the crude data was 7.9073. The overdispersion parameter is reduced in value as more variables are added to the prediction model, as seen at the bottom of Table 5. The values are reasonable and do not indicate any instability due to a low-mean problem. Figure 1 shows a decomposition of the variance in the data set.
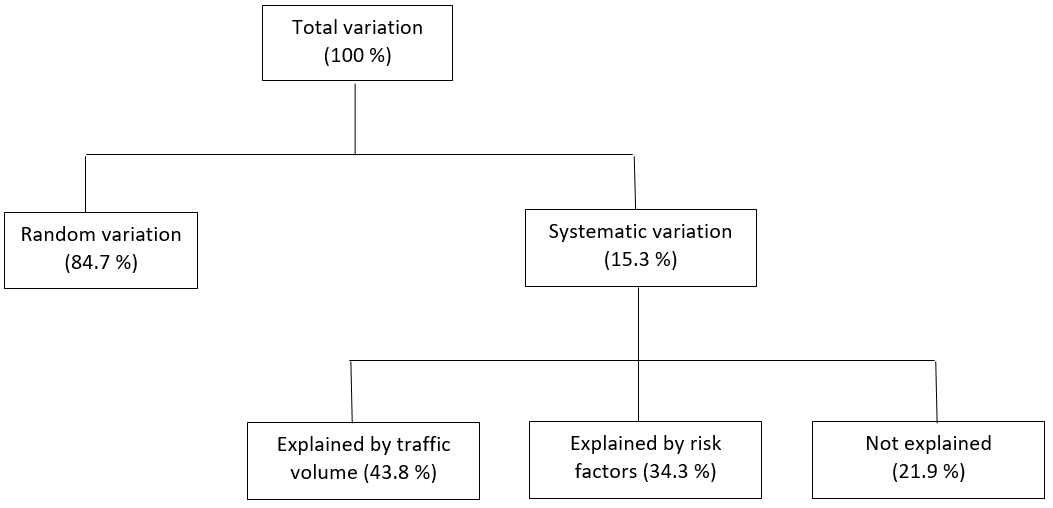
Most of the variation in the number of accidents is random (84.7%). It was nevertheless possible to fit an accident prediction model to the data, which explains most of the systematic variation in the number of accidents (78.1%). Traffic volume alone explains more of the systematic variation in the number of accidents than all other factors combined.
The estimated coefficients are mostly consistent with what previous studies have found. The effects on accidents of each variable can be estimated by applying the coefficient for that variable, keeping all other variables constant. Sharper curves (lower radius) have a higher number of accidents than gentler curves. This is consistent with almost all previous studies. The coefficient for curve radius indicates that a curve with a radius of 50 metres will have about 7 times as many accidents as an otherwise identical curve with a radius of 600 metres.
The positive coefficient for the length of a curve indicates that the number of accidents increases as curves get longer. At a constant radius, increasing the length of a curve will trace out an increasing part of a circle. At an angle of 57.3 degrees, the length of the curve equals its radius, i.e. the curve is a radian. A curve with 100 degrees of deflection will have length of 1.745 times the radius. This relationship is shown in Figure 2.
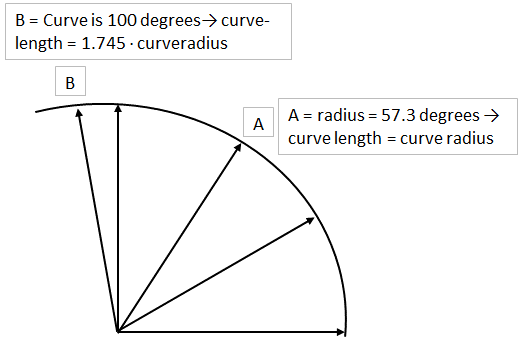
According to the coefficient for curve length, a 100-degree curve will have more than 4 times as many accidents as a 30-degree curve. The coefficient for spiral transition curve is particularly interesting. Only one of the studies reviewed in Table 1 (Zegeer et al., 1992) included this variable. It found that curves having spiral transition curves at both ends had about 2%–4 % fewer accidents than curves without spiral transition curves. The coefficient estimated in model 4 indicates that a curve which has spiral transition curves of the mean length (23 metres) has about 12% fewer accidents than an otherwise identical curve without spiral transition curves (i.e. length = 0). Increasing the length of a spiral transition curve by 10 metres is associated with almost 2% fewer accidents.
Increasing the length of the straight (tangent) section ahead of a curve is associated with an increased number of accidents. This is consistent with previous studies. All else equal, an increase in the length of the straight section before a curve from 50 to 600 metres is associated with an increase in the number of accidents of 23%.
The presence of a grade (upwards or downwards) ahead of a curve is associated with an increased number of accidents (of about 55%). However, the slope of the grade is negatively associated with the number of accidents. Thus, if a downward slope, which is indicated by negative numbers, changes from -1.2% to -2.4%, there is an estimated 0.6% reduction in the number of accidents. Likewise, changing an upward slope from 1.3% to 2.6% is associated with an estimated accident reduction of 6.7%. Therefore, grades as such are associated with an increased number of accidents, but the steeper they are, the lower is this increase.
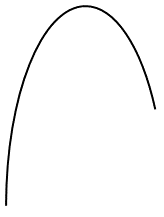
A compound curve, often referred to as an ‘egg curve’ in Norwegian, is a curve that does not have constant radius. It, in a sense, resembles the curvature of an egg. Figure 3 is an attempt at drawing such a curve.
These curves are not consistent with current design standards for horizontal curves. In fact, these curves have not been designed according to any design standard at all but have emerged ‘naturally’ as a result of fitting the road to the landscape with as little construction work as possible.
According to the estimated coefficient, these curves are safer than curves with a constant radius. This finding is surprising and possible explanations of it will be discussed in the discussion section of the paper.
The coefficient for super-elevation is negative. Only one of the studies reviewed in Table 1 (Shalkamy & El-Basyouny, 2020) included this characteristic. That study also found a negative coefficient for super-elevation, suggesting that there are fewer accidents when super-elevation increases. Super-elevation is stated in percent. Increasing it from the mean value 3.6% to 4.6% is associated with 2.3% fewer accidents.
Design standards for horizontal curves in Norway specify minimum values for cross slope before a curve and in a curve. Not all curves comply with design standards. However, those that comply with the design standard for cross slope in the curve are safer than those that do not comply with the design standard. Finally, rut depth in the road surface of curves does not seem to have much of an effect on safety, whereas increasing roughness, as indicated by the International Roughness Index, appears to be associated with a lower number of accidents.
Discussion
By and large, the results of the study presented in this paper are consistent with the results of previous studies. There were, however, some surprising results. One of them was that compound curves, which do not have a constant radius, were safer than curves with a constant radius. Another was that the steeper a vertical grade is, the smaller is the increase in the number of accidents associated with it.
One may speculate that behavioural adaptation by drivers accounts for these findings (Elvik, 2022; Evans, 1985; Wilde, 1982). For example, when driving through a compound curve, the driver has to turn the steering wheel continuously. This requires more attention to the driving task than driving in circular curves where it is sufficient to rest the steering wheel at an appropriate turning radius.
As far as vertical grades are concerned, drivers may brake in a steep downward slope to prevent speed from increasing. A steep upward slope limits sight distance, which may cause drivers to slow down and increase their alertness.
While these behavioural adaptations seem plausible, drivers do not fully compensate for the increase in risk associated with horizontal curves. The smaller the radius, the higher the number of accidents. The longer the straight section before a curve, the more accidents there are in the curve.
With respect to practical application of the findings of the study, it is important to keep at least two things in mind. The first is that it is, in general, not possible to change a single characteristic of a horizontal curve in isolation. Thus, if radius is made larger, the curve also becomes longer and the length of the straight sections between the curve and adjacent curves become shorter. If one were to apply the model to predict the effect on accidents of increasing the radius of a curve, one would then have to include not just the coefficient for radius, but also the coefficients for length of curve and length of straight section ahead of the curve. Possibly even other characteristics, like super-elevation, might be affected.
The second limitation of the study as far as practical application is concerned, is that it did not include all factors that are likely to be related to the safety of curves and could be affected if changes are made to the alignment of a curve or set of curves. It did not include, for example, lane width, shoulder width, and speed limit. All of these might change if a road is reconstructed, making, for example, curve radius larger than before.
Conclusions
The main conclusions of the research presented in this paper can be summarised as follows:
-
The safety of horizontal curves on rural two-lane roads in Norway is related to very many factors. This study included 17 factors, more than any previous study of horizontal curve safety, but it was still incomplete.
-
The variation in the number of accidents between curves is mostly random; still the accident prediction model explained 78.1% of the systematic variation in the number of accidents.
-
The most important explanatory factor with respect to systematic variation in the number of accidents is traffic volume.
-
The existence of vertical grades before a curve is associated with an increased number of accidents; however, the steeper the grades, the smaller is the increase in the number of accidents.
-
Compound curves (with radius varying throughout the curve) were found to be safer than curves with a constant radius.
Declaration of competing interests
The authors declare that they have no known competing financial interests or personal relationships that could have appeared to influence the work reported in this paper.
CRediT contribution statement
Rune Elvik: Conceptualisation, Formal analysis, Methodology, Writing—original draft, Writing—review & editing. Espen Strandvik Haugvik: Conceptualisation, Data curation, Formal analysis, Writing—review & editing.